Estimating LAI of Rice Using NDVI Derived from MODIS Surface Reflectance
Estimating LAI of Rice Using NDVI Derived from MODIS Surface Reflectance
Volume 5, Issue 6, Page No 1047-1053, 2020
Author’s Name: Rushikesh Kulkarni1,a), Kiyoshi Honda2
View Affiliations
1Symbiosis Institute of Technology, Symbiosis International (Deemed University), Lavale, Pune, Maharashtra, 412115 India
2Department of Astronautics and Aeronautics, Chubu University, 1200 Matsumoto-cho, Kasugai, Aichi 487-8501, Japan
a)Author to whom correspondence should be addressed. E-mail: rushikeshk@sitpune.edu.in
Adv. Sci. Technol. Eng. Syst. J. 5(6), 1047-1053 (2020); ![]() DOI: 10.25046/aj0506127
DOI: 10.25046/aj0506127
Keywords: Rice LAI, In-situ LAI, MODIS Surface reflectance

Export Citations
The measurement of Leaf Area Index is of fundamental importance in agriculture and ecological research because it reflects plant growth. This study aims to estimate LAI from, NDVI derived from standard eight days composite MODIS surface reflectance, acquired during the rice growing period.
A two-stage model was developed to relate the LAI of rice to NDVI derived from MODIS surface reflectance. In the first stage, a correlation has been developed between ‘MODIS NDVI’ and ‘in situ NDVI’ derived from spectral reflectance measured with spectrophotometer, in rice field of Suphanburi Province, Thailand. In the second stage, correlation has been developed between in situ NDVI and, in situ LAI measured with handheld LAI-2000 instrument. Eventually, a model has been derived using these two relationships, which estimate LAI from MODIS Surface Reflectance, in an irrigated rice field, central Thailand.
Received: 29 October 2020, Accepted: 20 November 2020, Published Online: 14 December 2020
1. Introduction
In agriculture and ecology, historically, the Leaf Area Index (LAI) concept is used for the estimation and evaluation of crop production and crop yield and the scheduling of irrigation and amendments during crop cultivation [1]. In order to assess growth and vegetation intensity across the globe, monitoring the distribution and change of LAI is significant. It is directly related to the interception and absorption of light by the canopy. It also influences heat balance and evaporation from the cropping field and thus, accurate assessment of LAI is necessary [2]. However, many factors are important if the reflectivity of the crop canopy is to be assessed. These include the complexity of canopy design, improvements to the internal arrangement of leaves and background effects of the soil [1].
Direct measurement of canopy LAI is accurate but extremely labor intensive and destructive [3]. Remote sensing techniques have been used to measure LAI on a landscape scale or even global scale. The benefit of the remote sensing technique is that it can collect plant canopy information on a global scale without interfering with normal plant growth [4, 5]. The introduction of simple NDVI-LAI relationships has yielded reliable results over a 12-year period in the estimate of green vegetation abundance [6]. There are two common approaches to estimate LAI using remote sensing [7]. The first one is associated with spectral vegetation index (SVI) and the second one, is by modelling approach [7]. In the first approach, an empirical relationship between a Vegetation Index (VI) and LAI has to be established. One major drawback of this method is that equation have to be established for each vegetation type. Thus, it requires substantial LAI measurements and corresponding remote sensing data [8]. This method is unsuitable for pixels of low-resolution remote sensing data enclosing a heterogeneous field. Another approach to estimate LAI is by using Bi-Directional Distribution Function (BRDF) models such as Spectral Absorption of Inclined Leaves (SAIL). These models usually consist of a set of equations that relate surface physical properties to observed signals as a function of wavelength. Physical properties may include soil reflectance, canopy architecture, optical properties and geometric configuration of sensing systems as well as illumination sources. . The input parameters needed for BRDF models are single-scattering albedo of individual leaves, leaf inclination distribution and anisotropic properties of both canopy and soil substrates. BRDF models can then be theoretically inverted to obtain the model parameters, and some vegetation parameters can be estimated [7].
The relationship between growth traits and Normalized Differential Vegetation Index (NDVI) to assess their potential use in estimating the growth of rice crops has been examined [9]. Experiments were conducted at the Taiwan Agriculture Research Institute (TARI) experimental farm on loam soil during the first and second cropping seasons (1996-1997). Plants were sampled at two weeks intervals after transplanting till harvest and the LAI was computed at each new sampling date. A LI-1800 high spectral resolution portable Spectroradiometer (LI-COR Inc., Nebraska, USA) was used to measure the reflectance to calculate in-situ NDVI. Yang and Su then developed a correlation between the computed LAI and in-situ NDVI. A linear regression gave results with R2=0.982 for SPOT HRV and R2= 0.985 for Landsat MSS. As these spectral transformations are highly correlated, estimation of growth traits based on NDVI can be accurate for both in-situ NDVI and satellite-derived NDVI. Thus reflectance band of HRV and MSS sensors could be used as predictors of canopy characteristics [9].
In-Situ LAI and spectral reflection data were assessed for the 2004-2005 period in part of Suphan Buri, Thailand [10]. This was done in order to develop a relationship between LAI and NDVI at ground level. In 2004, the researchers developed a model to estimate ground based LAI from ground-based NDVI. This is a specific case, since the remote sensing data corresponding to the field data collection period was not available. It was assumed that NDVI from Landsat MSS and from SPOT VGT to be equal and thus, used the model developed by Yang and Su (1998) for MSS to estimate ground based NDVI from SPOT VGT [10]. Yang and Su’s LAI – NDVI correlation estimated LAI in the range of 0.082 to 1.848 for SPOT VGT data which seemed too low compared to the LAI field data collected by Srinuandee in 2004-05, which were measured in the range of 0.0 to 7.15. Srinuandee’s field based correlation estimated LAI in the range of 2.03 to 5.3002 for a pixel in SPOT VGT.
Srinuandee’s model showed little improvement compared to Yang and Su’s model however, impressive variation in result have not been observed. Improvements made by Srinuandee on Yang and Su’s model are not proving conclusive. Thus, the main goal of this research was to estimate LAI from Moderate Resolution Imaging Spectroradiometer (MODIS) based NDVI with major changes on Srinuandee’s efforts. Indeed, in-situ LAI data recorded by Srinuandee seems to be overestimated and BRDF effect has not been considered during data collection. BRDF effect is an important factor to be considered in case of low-resolution remote sensing data where satellite have wide swath since the measurements vary according to different viewing angles.
2. Materials and methods
2.1. Description of Study Area
The case study was conducted in rice field of Song Phi-Nong district, Suphan Buri Province, central part of Thailand during January’ 2006 to April’ 2006 which is the growing period of first crop in Suphan Buri province. The geographic location of study site as shown in Figure 1. Experiment was carried out in the homogeneous rice field which was detected using Landsat 7 ETM +, land use map and aerial photographs.
The topography of study area was mostly flat lowland terrain. Thus the rice fields in this area remains completely flooded during rainy season. The climate of the Province characterized mainly by three seasons: (i) rainy season from May to October (ii) cool and dry season from November to February (iii) hot and dry season from March to May. The average annual rainfall in the central plain is between 900-1300 mm, average solar radiation about 17 MJ m-2d-1 and temperature ranges from 33-340C to 23-24 0C.
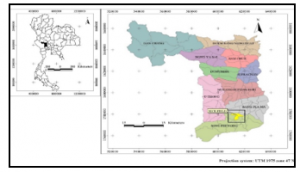
Figure 1: Location of study area in Suphan Buri Province, Central Thailand
3. Field Data Collection
The spectral reflectance and LAI were measured using a Spectroradiometer and a LAI-2000 Plant Canopy Analyser (PCA) respectively from the first stage of rice growth till the harvesting period. LAI was measured at 9:00 am to 11:00 am because LAI canopy analyser doesn’t need direct solar radiation to measure LAI and LAI measurements should be done with low sun elevation angle which is in between morning time or in the evening time. Five different locations were sampled at each time of ground trothing.
In-situ spectral reflectance readings used to calculate NDVI have been recorded at five different angles in East and West directions separately in order to create similar circumstances as satellite data; since, satellite moves in North-South direction with acquiring reflectance in East-West direction. Each measurement was recorded with 150 intervals, starting from 00 to 600, marked on a simple handmade clinometer in order to examine BRDF effect in the field refer Figure 2. Five readings of spectral reflectance at each five different angles in East and West directions and five LAI readings, from five sampled locations were averaged for each day of ground truthing. Total eight readings of spectral reflectance at each five different angle and eight readings of LAI, were measured in field during the period of 12th February to 2nd April. The fibre optics wire of the spectrometer was clamped at each angle and spectral reflectance readings were recorded in both directions, so total ten readings of spectral reflectance has been measured each day of ground truthing. One end of fibre optic wire was at a height of 1.5 m from ground level and another end was connected to spectrometer which was further connected to computer through USB port. The spectrometer measures spectral reflectance in the range of 304 nm to 1135 nm with an increment of 1 nm. In order to compare in situ NDVI with MODIS data, average reflectance for red band was calculated from wavelength of 620 nm to 670 nm and that for near infrared band was calculated from wavelength of 841 nm to 876 nm.
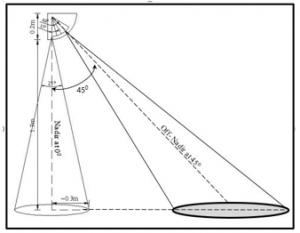
Figure 2: Schematic diagram of clinometer setup used to measure surface reflectance in the field with various angles.
In-situ NDVI estimated from field spectral reflectance measured in each week of data collection has been compared with NDVI estimated from 8 days composite MODIS surface reflectance acquired on corresponding week of ground thruthing, refer figure 5. Two field data collection dates, 26th Feb and 3rd March, are members of 8 days composite of 26th February to 5th March (Table 1).
The general flow chart of the methodology is shown in figure 3. The atmospheric corrected MODIS surface reflectance is obtained and compared to the field NDVI derived using a fiber-optic spectroradiometer.
The relationship between MODIS derived NDVI and LAI is established as shown in flow chart of methodology figure 3.
4. Results and discussion
4.1. Correlation analysis of in situ NDVI and NDVI derived from MODIS
Thus, eight values of in situ NDVI were compared with seven values of MODIS derived NDVI. NDVI derived from MODIS surface reflectance and in situ NDVI did not show the same pattern in early crop development.
Table 1: Comparison of field data collection dates and MODIS 8-days composite dates
| Field Data collection dates | MODIS 8-days composite dates |
| 12th Feb | 10th Feb – 17th Feb |
| 19th Feb | 18th Feb – 25th Feb |
| 26th Feb | 26th Feb – 05th Mar |
| 03rd Mar | 26th Feb – 05th Mar |
| 12th Mar | 06th Mar – 13th Mar |
| 19th Mar | 14th Mar – 21st Mar |
| 26th Mar | 22nd Mar – 29th Mar |
| 02nd Apr | 30th Mar – 06th Mar |
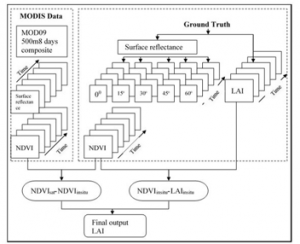
Figure 3: Overall methodology of model development
However, they agree in the full vegetative stage. In the field, early growing stage paddy has a dispersed pattern of newly germinated rice plants along with water, refer figure 4. In this case, muddy soil was easily visible at this stage, which induces canopy background contamination error. While in case of observation from MODIS, angular effect make the field looks different from the way it actually looks with naked eyes. Thus, angular effect was responsible for higher NDVI in case of MODIS observations. Difference between “true” NDVI, as would be measured at the surface, and that actually determined from the space are sensitive to attenuation by atmosphere and by aerosols [11]. In this case MODIS BRDF nadir adjusted 16 days composite data was compared with in situ NDVI figure 6. Similar growing pattern was obtained with in situ ground truth measurement measured at nadir. However, it was rather difficult to compare 16 days composite data with a data acquired on single day.
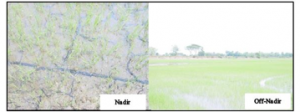
Figure 4: Photograph of paddy field taken at nadir and at off-nadir.
MODIS NDVI was compared with average in situ NDVI estimated from NDVI from all five locations in the field, in both directions i.e. East and West, for all five observation angles. Ground truth surface reflectance was collected in morning time from 9:00 am to 11:00 am.
Linear correlation coefficient (R2) was calculated between in situ NDVI estimated in five angles and NDVI derived from MODIS surface reflectance,(Table 2). The results obtained were more or less seems to be equal in all cases figure 7[a-e]. The in situ NDVI was linearly interpolated to corresponding view zenith angle of MODIS.
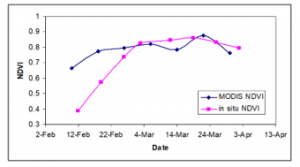
Figure 5: Plot between estimated NDVI in field at 00 viewing angle and NDVI from MODIS surface reflectance.
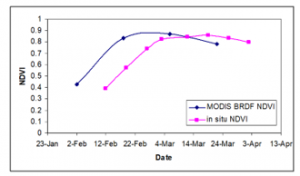
Figure 6: Plot of NDVI computed from MODIS Nadir adjusted data, NDVI estimated from field-collected data
Table 2: Linear relationships between in situ NDVI at different angle and MODIS NDVI
| Observation angle | Relationship | R2 |
| 00 | y= 2.447x – 1.1838 | 0.65 |
| 150 | y= 2.437x – 1.1793 | 0.66 |
| 300 | y= 2.447x – 1.1838 | 0.65 |
| 450 | y= 2.532x – 1.2469 | 0.67 |
| 600 | y= 2.488x – 1.2068 | 0.68 |
Table 3: Characteristics of MODIS on respective dates.
| MODIS data available day | DOY | View zenith angle | solar zenith angle | NDVI |
| 02 Feb | 33 | 6.77 | 39.20 | 0.5987 |
| 10 Feb | 41 | 7.93 | 36.59 | 0.6649 |
| 18 Feb | 49 | 6.43 | 30.69 | 0.7757 |
| 26 Feb | 57 | 8.39 | 32.14 | 0.7962 |
| 06 Mar | 65 | 22.26 | 28.93 | 0.8199 |
| 14 Mar | 73 | 20.07 | 29.22 | 0.7835 |
| 22 Mar | 81 | 22.45 | 24.01 | 0.8748 |
| 30 Mar | 89 | 19.39 | 25.14 | 0.7643 |
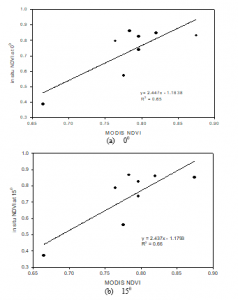
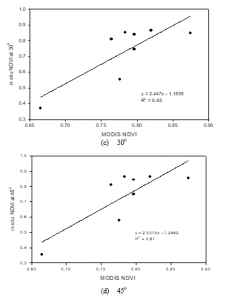
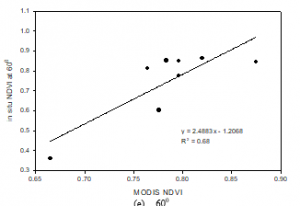
Figure 7: Relationship between in situ NDVI estimated at all five different angles and MODIS NDVI
| In-situ NDVIinterpolated = 2.3959* NDVIMODIS – 1.1448 (1) |
| Model derived in-situ NDVIat 00 = 0.9586 * NDVIinterpolated + 0.024 (2) |
| Model derived in-situ NDVI at 00 = 2.2967*NDVIMODIS – 1.0727 (3) |
MODIS metadata file represents the specifications of the MODIS surface reflectance product. (Table 3). The in-situ NDVIS measured at various angles is interpolated to the corresponding zenith angle of the MODIS. The results are shown in Table 4.
Table 4: Interpolated in situ NDVI corresponding to view zenith of MODIS
| Field data collection Day | Interpolated in situ NDVI |
| 12 Feb | 0.3794 |
| 19 Feb | 0.5675 |
| 26 Feb | 0.7362 |
| 03 Mar | 0.8252 |
| 12 Mar | 0.8642 |
| 19 Mar | 0.8616 |
| 26 Mar | 0.8492 |
| 02 Apr | 0.7941 |
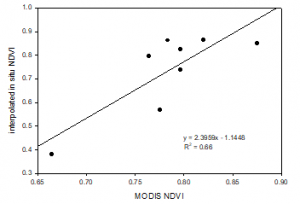
Figure 8: Relationship between MODIS NDVI and interpolated.
The interpolated in situ NDVI was adjusted to standardized form i.e. at nadir observation. Thus, the in situ NDVI was derived from MODIS NDVI in multistage approach.
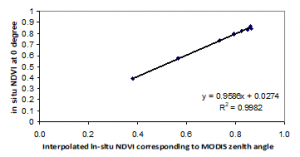
Figure 9: Plot of in situ NDVI estimated at 00 and interpolated in situ NDVI.
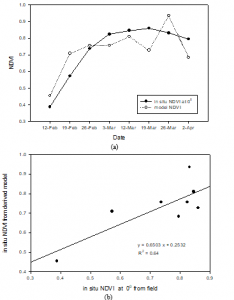
Figure 10: Comparison of in situ NDVI estimated at 00 in field and in situ NDVI obtained by derived model
The presence of clouds has been shown to have a major impact on the field data set. The remote sensing data collected on the day 19th March and 22nd March have lots of errors which induced errors in calculation of NDVI and LAI.
The field data collection in this study started with data collection from seven locations but due to proper care and maintenance of rice at two locations in the field, data collection from only five sites could be considered till the end of study.
5. Validation of Model
The derived NDVI from model showed nearly same pattern with an in situ NDVI estimated at 00 in the field, figure 10 [a-b]. In the beginning of rice growth, modelled in situ NDVI seems to be approaching to get better fitness with in situ NDVI. However, in the last stage of rice growth, few contaminations induced in remote sensing data were intending to the modelled in situ NDVI to oscillate from expected output.
6. Correlation analysis of in situ NDVI and in-situ LAI
In-situ NDVI and in-situ LAI were not linear together. The sensitivity of NDVI to LAI becomes increasingly weak with increasing LAI beyond a threshold value, which was typically between 2 and 3 [11]. NDVI increases almost linearly with increasing LAI and then asymptotic region was observed in which NDVI increases very slowly with increasing LAI. Ground surface was almost completely covered by leaves in asymptotic region.
A linear correlation coefficient (R2) was calculated between in situ NDVI estimated at 00 and in situ LAI. However, most of the LAI measurements were in the range of 4 to 5. A non-linear correlation analysis between in situ NDVI and in situ LAI was used in this study.
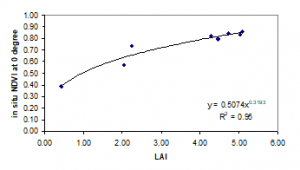
Figure 11: In situ NDVI computed at Nadir and in-situ LAI collected from filed.
Eventually the result obtained by non-liner correlation analysis between in situ NDVI estimated at 00 and in situ LAI is:
|
In situ NDVI at 00 = 0.5074 LAI0.3193
|
(4) |
7. Final Model development
The final model involves two parts, the first one is a NDVI transformed from satellite to in situ and the second one from in situ NDVI to LAI. In the first part, similar variables (NDVI) were compared. In the second part, the spectral reflectance and an in-situ LAI were measured at the same location and at the same time in the rice field, which makes this multi stage modeling approach more realistic than single stage model. However direct relationship between MODIS NDVI and in situ LAI was not used in this study.
In situ NDVI was calculated with RMSE of 0.603 and that of for LAI was estimated at 2.120. The high RMSE could be induced because of the contamination error in the remote sensing data. The remote sensing data acquired on 22nd of March estimated higher value of NDVI which caused an error in LAI calculation.
|
In situ NDVI at 00 = 2.2967 NDVIMODIS – 1.0727 (5)
|
| LAI = (NDVIin situ / 0.5074)3.1318 (6) |
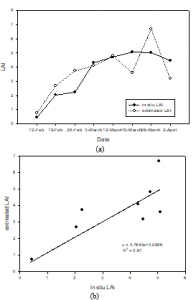
Figure 12: Validation of model LAI with in situ LAI
The LAI estimated with developed model grow similar as the in situ LAI measured. Coefficient of correlation (R2) was found to be 0.61 which could be increased with increasing accuracy of remote sensing data.
8. Conclusions
In this study, field-based rice LAI is estimated from standard MODIS surface reflectance product. We proposed multi stage approach to derive LAI from MODIS surface reflectance. In the first stage, in situ NDVI is derived from MODIS NDVI and in the second stage, field-based LAI is derived from in situ NDVI. BRDF corrected relationship is considered in the first stage.
The angular effect in MODIS NDVI causes little higher values of modeled in situ NDVI than in situ NDVI estimated at 00. In the case of in situ measurements of surface reflectance small area is sampled by fiber optics wire as compared to remote sensing data. If the number of locations in the site is increased more realistic result can be obtained. The data information of rice growth in a year definitely improves the result. The accuracy of the model could be increased with increasing in the field data collection for entire period of rice cropping cycle in a year.
The model could be used for regional scale with MODIS 250m and accuracy can be checked with MODIS 500m. The model can also be further developed for other crops like sugarcane, maize etc. The model could be improved for mixed pixel condition. The LAI could be estimated by using some other vegetation indices such as Soil Adjusted Vegetation Index (SAVI) and accuracy check can be done with the derived model in this study.
In order to enhance the applicability of LAI-NDVI relationship, more crops and more satellite remote sensing data sets should be assessed and checked. The use of multi-angular remote sensing for LAI estimation may be further tested and investigated using radiative transfer models.
Acknowledgements
We thank Ms. Kamal Thapa for her assistance and support during in-situ data measurement and also thankful to Thai research students from the RS-GIS Field of Study for helping as interpreter, Thai- English-Thai during field data measurement.
Conflict of Interest
The authors declare no conflict of interest.
- C. Tan, P. Zhang, X. Zhou, Z. Wang, X. Zi-qiang, “Quantitative monitoring of leaf area index in wheat of different plant types by integrating NDVI and Beer-Lambert law,” Scientific Reports, Nature Research, 1–10, 2020, doi:10.1038/s41598-020-57750-z.
- R.R. Jensen, M.W. Binford, “Measurement and comparison of Leaf Area Index estimators derived from satellite remote sensing techniques,” International Journal of Remote Sensing, 25(20), 4251–4265, 2004, doi:10.1080/01431160410001680400.
- Y. Guangjian, H. Ronghai, L. Jinghui, W. Marie, J. Hailan, M. Xihan, “Agricultural and Forest Meteorology Review of indirect optical measurements of leaf area index: Recent advances , challenges , and perspectives,” Agriculture and Forest Meteorology, 265, 390–411, 2019, doi:10.1016/j.agrformet.2018.11.033.
- Q. Jiao, B. Zhang, J. Liu, L. Liu, “A novel two-step method for winter wheat-leaf chlorophyll content estimation using a hyperspectral vegetation index,” International Journal of Remote Sensing, 35(21), 7363–7375, 2014, doi:10.1080/2150704X.2014.968681.
- C. Tan, D. Wang, J. Zhou, Y. Du, M. Luo, Y. Zhang, “Remotely Assessing Fraction of Photosynthetically Active Radiation ( FPAR ) for Wheat Canopies Based on Hyperspectral Vegetation Indexes,” Frontiers in Plant Science, 9:776, 1–9, 2018, doi:10.3389/fpls.2018.00776.
- P. Taylor, D.C. Garson, B. Lacaze, “Monitoring Leaf Area Index of Mediterranean oak woodlands: Comparison of remotely-sensed estimates with simulations from an ecological process-based model,” International Journal of Remote Sensing, 24(17), 3441–3456, 2003, doi:10.1080/0143116021000024267.
- J. Qi, Y.H. Kerr, M.S. Moran, M. Weltz, A.R. Huete, S. Sorooshian, “Leaf Area Index Estimates Using Remotely Sensed Data and BRDF Models in a Semiarid Region,” Remote Sensing of Environment, (73), 18–30, 2000, doi:10.1016/S0034-4257(99)00113-3.
- M.W. Kappas, P.A. Propastin, “Review of Available Products of Leaf Area Index and Their Suitability over the Formerly Soviet Central Asia,” Journal of Sensors, Vol.2012, 2012, doi:10.1155/2012/582159.
- Yang. C.M. and Su M.R., “Correlation of Spectral Reflectance to Growth in Rice Vegetation,” in Asian Conference on Remote Sensing (ACRS), Proceeding of the 19th Asian Conference on Remote Sensing ACRS: 16-20 November 1998, Manila., 1998.
- I.A. Srinuandee Panithan, Honda Kiyoshi, Chemin Yann, “SWAP Crop Model Parameter Identification using SPOT Vegetation in Suphanburi, Thailand.,” in Proceeding of the 25th Asian Conference on Remote Sensing, ACRS 2004, November 22-16, 2004, Chiang Mai, Thailand, 2004.
- T.N. Carlson, D.A. Riziley, J. Ji, “On the Relation between NDVI , Fractional Vegetation Cover , and Leaf Area Index,” Remote Sensing of Environment, 62, 241–252, 1997.