
Determinants of Technological and Innovation Performance of the Nepalese Cellular Telecommunications Industry from the Customers’ Perspective
Volume 5, Issue 6, Page No 1013-1020, 2020
Author’s Name: Rewan Kumar Dahala), Ganesh Bhattarai, Dipendra Karki
View Affiliations
Tribhuvan University, Faculty of Management, Nepal Commerce Campus, New Baneshwor, Kathmandu, 44600, Nepal
a)Author to whom correspondence should be addressed. E-mail: dahalrewan@gmail.com
Adv. Sci. Technol. Eng. Syst. J. 5(6), 1013-1020 (2020); ![]() DOI: 10.25046/aj0506122
DOI: 10.25046/aj0506122
Keywords: Innovation, Measures, Organization, Performance, Technology, JEL Classification, L25, L32, L86

Export Citations
The study aimed to understand and analyze the technological and innovation performance measures of the Nepalese cellular telecommunications industry from the customers’ perspective. The measures like network service quality, signal strength and coverage, voice quality, and calls drop are used for technological performance, whereas measures like product/service innovation, process innovation, customization, competitive innovation, and marketing innovation are used for innovation performance. It followed a descriptive research design employing a structured questionnaire survey instrument. Two market leader companies of the Nepalese telecommunications industry (Nepal Telecom and Ncell) and their customers were considered as objects of the study. For this study, 391 respondents were selected by using the judgmental sampling technique. Targeted respondents of the study were postgraduate understudies, service holders, business persons, and freelancers. The survey instrument was set in three segments with 19 questions to collect and analyze information with the help of a statistical package for the social sciences and analysis of moment structures software. Two constructs with nine test variables found as the determinants of the technological and innovation performance of the Nepalese cellular telecommunications industry. The results of the study would provide helpful guidelines in understanding the key drivers of the technological and innovation performance in the Nepalese scenario.
Received: 30 August 2020, Accepted: 21 November 2020, Published Online: 08 December 2020
1. Introduction
One of the most important inquires in business has been why some organizations succeed while others fizzle. Organizational performance is one of the most articulated concerns for all organizations, either profit or not-for-profit. It has been immensely important for stakeholders, especially for managers, to identify the components that influence an organization’s performance so that they can initiate appropriate actions. However, describing, conceptualizing, and measuring organizational performance has never been an easy undertaking [1]. Various researchers have made an attempt to define and assess organizational performance, yet it remains an issue of debate among analysts [2]. Basically, organizational performance refers to the outcomes of daily administrative processes [3] that the organization intends to accomplish in the long-term [4]. The primary concern of the study of organizational performance is the suitability of various approaches to deal with the idea usage and its measurement [5].
Organizational performance is a multifaceted concept, and the use of a financial measures-based performance system alone is not sufficient to measure performance of organizations operating in highly competitive, innovative, and advanced technological environments [6]. As such, the contemporary business environment demands a multidimensional performance measurement system that can provide more information to stakeholders, more specifically managers. Out of several dimensions of the performance measurement system, the telecommunication industry’s two inherent components are technology and innovation due to the fact that adoption of technological advancements through innovative actions distinguishes products/services or companies in the competitive market.
Although the determinants of technological and innovation performance are still unclear, accomplishing and sustaining superior organizational performance, especially in the cellular telecommunications setting has become a top priority today. The study therefore tries to find the measures to assess and quantify the technological and innovation performance of the Nepalese cellular telecommunications industry. Alongside that, the study’s objective is to examine the intensity of technological and innovation performance measures in the Nepalese scenario and initiate some theoretical and practical discussions for better organizational performance.
This study is extremely significant in the scenario of Nepalese telecommunications industry as the cellular telecommunications has been growing by leaps and bounds and gradually covering the broad spectrum of Nepali populace. As per [7], the number of Global System for Mobile (GSM) network subscribers has surpassed 3.5 million as of June 2020. The industry’s main focus as it can be observed is on mobile phones and their primary functions, such as calling and hearing. Telecommunication companies are under persistent pressure to deliver creative items more rapidly, at lower cost, and with enhanced quality [8]. This shows that cellular telecommunications companies have a special relationship with the customer, and necessitates the assessment of organizational performance in order to strength that relationship by incorporating new features at lower cost with better services in the future.
2. Literature Review
The literature contends that technological and innovative performance measures are endogenous and are impacted by more profound organizational growth determinants. In today’s knowledge-based economy, corporate growth is driven primarily by creative capacity, invigorated by the pertinent information and technological externalities, instead of gathering capital [8]. So, performance measures concerning technology and innovation stand at the point of convergence of organizational performance measurement system.
2.1. Technological performance measures
The world of technology is changing at a rapid pace, and telecommunications technology is not an exception. Over time, technological changes have a significant impact on the creation of marketing opportunities [9]. The preferences of customers change rapidly and pose numerous difficulties for any business [10]. Technological advances, especially in information and communication technology (ICT), make product/service innovation conceivable [11]. New technologies bring new challenges to business players and seek opportunities to offer customers innovative products/services to pursue long-term relationships [12] and distinguish them from other competitors [13]. Previous studies like [14]-[16], have analyzed the crucial role of technology in the performance and competitiveness of organizations. This study thus examined and evaluated some technological performance measures among the various customers.
Network and service quality has a significant role in organizational performance for telecom service providers [17]. In [18], [19], the authors acknowledged that network quality is one of the crucial factors that determine the organization’s performance in evaluating its service quality.
Signal strength and coverage have always been essential criteria for selecting telecom services. Multiple studies demonstrate that signal strength and range positively affect consumers’ satisfaction and the organization’s image [20], leading to overall organizational performance.
Voice quality in telecommunications networks has been a fundamental part of service qualification. Because of the inherent characteristics of a converged voice and voice-over internet protocol (VoIP), administrators face specific problems such as echo, jitter, delay, side-tone, background noise, etc. Quick and efficient mitigation of VoIP issues to maximize call quality leads to better service provider performance [21].
Calls drop is another key performance indicator to assess the performance of operators’ networks. It is expected to have a direct impact on customer satisfaction and retention [22].
Electronic customer relationship management (e-CRM) allows users to frequently communicate with one another and maintain their databases as clearly as possible while improving customer relationships [23]. Implementation and uses of e-CRM enhance organizational effectiveness and significantly connect with the overall performance [24].
2.2. Innovation Performance Measures
New methods of products, processes, and other components are being applied to organizations by innovation [25]. It transforms into a product/service as it is produced and bought by the customer and provides the vendors with financial benefits. Innovation performance measures introduce new strategic tactics, working environment and guidelines, decision-making techniques, and better external relations approaches [26]. Studies like [27], [28], [29], have been conducted to examine the crucial role of innovation on a firm’s performance and competitiveness. Despite several dimensions of the innovation performance measures, the study secured just five general business criteria and assessed them from the customers’ perspective.
Product/service innovation satisfies customers by turning the invention or idea into a product/service and enhancing company value at acceptable risk [30]. Innovation analyzes the needs of the customers and provides the products/services accordingly. Therefore, product/service innovation helps escalate customer benefits [29] tantamount to better organizational performance.
Process innovation refers to doing business in a new and innovative way [31]. Conversion of new technology into processes, especially in ICT based companies, has a significant impact on the performance of the firm. Process innovation therefore represents a type of service innovation that provides an immense advantage in creating new streams of value for better customer experiences, thereby enhancing a firm’s competitiveness and overall performance of a company [32].
Customization is the process of making and changing something to the buyer’s or user’s needs. The telecommunication sector’s service competitiveness, including variations of services and facilities and the degree of customization, influences technological and innovative performance. Additionally, customization capability encourages service systems to suit a specific customer within a particular use-circumstance and to make a unique value for that customer [33].
Competitive innovation is a strategy that organizations use to make a competitive advantage by developing products that nobody else can, showing improvements over every other person, or presenting prevalent, less expensive, and quicker services [34]. It is a type of social design that focuses on creating and elaborating the best and practical thoughts originating from the best innovators for superior organizational performance.
Marketing innovation is implementing a new advertising technique, including significant changes in product design, placement, packaging, distribution, communication, promotion, and pricing strategy [35]. According to [36], improvisation, modification, augmentation, or transformation of existing trade channels using technology can reduce transaction costs that lead to better organizational performance. [37] also argued that companies developing innovative practices were more able to position themselves on the market against their competitors and achieve emphatic retention of customers.
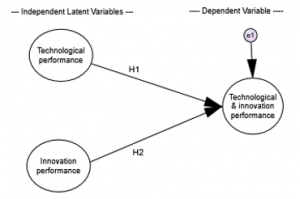
Figure 1: Conceptual framework of the study
2.3 Technological and Innovation Performance
Various metrics can be used to assess a firm’s performance [38]. Technological and innovation initiatives are considered to be primary indicators of the cellular telecommunication industry. They allow the firm to improve capability to meet the demands of its evolving domestic and international market [39], thus giving the firm a lucrative outcome.
The overall technological aspect is multidimensional and can be decomposed appropriately from different perspectives [40]. Studies showed that technological advancement is a primary determinant of superior long-term success [41] and leads to better performance than rivals [42].
The overall innovation aspect allows better delivery of the services offered and a more significant impact of any campaign and promotes organizational changes standardizing certain activities [43]. In [44], the authors evidenced that in firms, where there is a willingness to innovate its products/services, there is a significant and positive impact on overall organizational performance.
3. Conceptual Framework and Hypotheses
Organizational performance shows the development and progress of an organization [45]. The analysis of organizational success is one of the most investigated variables. It is a criterion for management and tends to depend on the fitness between corporate systems and situational factors. Therefore, the study is driven by the contingency theory, which provides a practical perspective for examining and measuring different contingent variables.
Within the framework of prior literature and conceptual sketching, the study has the following two hypotheses:
H1: Technological performance positively and significantly affects technological and innovation performance.
H2: Innovation performance positively and significantly affects technological and innovation performance.
4. Methodology
The quantitative research strategy was employed to extract information for the study, and the required information was acquired through a structured questionnaire survey from the targeted respondents. The study used a statistical package for social sciences (SPSS) version 23 and analysis of moment structures (AMOS) version 21 software to dissect and decipher the information. The study’s targeted populace comprised all the Global System for Mobile (GSM) customers of Nepal Telecom and Ncell. According to [7], the sample companies’ customers possess more than 93 % of the Nepalese cellular telecommunications market share. The study employed a judgmental sampling technique because there was no proof of active and the dead Subscriber Identification Module (SIM) card issued with the sample organizations. Targeted respondents of the study were postgraduate understudies, service holders, business persons, and freelancers. A sampling plan was used as proposed by [46], [47] and ensured at least 385 respondents’ responses. Therefore, the study employed 391 respondents’ perceptions as sample.
The designed questionnaire for the survey comprised 19 questions and structured them into three segments. In the first segment, seven items were requested, relating to demographic and general information. In the second segment, 10 items mentioned about technological and innovation performance measures in various dimensions. In the last segment, two items inquired about the overall technological and innovation performance. The last two segments centered on the study variables with a series of close-ended questions to get the appropriate information. With a 6-point Likert-type scale of 1 = strongly disagree to 6 = strongly agree, all the survey queries of the study variables were estimated. The 6-point scale was picked because it excludes the undecided middle rating.
The researchers distributed the questionnaires through an online and a field survey. Based on the data provided by different colleges/universities, an online survey conducted among university graduates from the recent five years and who are working in Nepal’s various parts. A total of 500 respondents approached during the 30-days of January/February 2020. Out of this, 143 responses were received from the online survey and recorded in SPSS for further analysis. On the other hand, the researchers themselves disseminated 500 questionnaires among Tribhuvan, Kathmandu, Pokhara, and Purbanchal Universities’ graduate students and their faculties to conduct the field survey. Out of them, 276 responses were collected during the period of 30 days in January/February 2020. From the collected responses through the field survey, 28 were rejected due to incomplete information. The remaining 391 responses were considered valid and were used in this study.
5. Reliability and Validity of the Survey Instrument
The study assessed the reliability and validity to confirm the constructs’ suitability before evaluating the hypothesized model. The survey instrument’s overall reliability statistics showed an excellent Cronbach’s alpha (α = 0.819) and the average inter-item correlation coefficient (r = 0.312) from the 10 test items. Despite having excellent values of the statistics, construct-wise Cronbach’s alpha was also analyzed. The value of Cronbach’s alpha of the technological performance construct having five test items (VAR_8, 9, 10, 11, and 12) was 0.775. The analysis found that the VAR_12 ‘the company alters and provides me all information through SMS’ required to delete because of the higher value of alpha 0.807 if the item deleted. The variable VAR_12 also had a low correlation (0.317) to total correlation, while the rest were in the area of 0.576 to 0.680. Therefore, VAR_12 was also not relevant in the study and deleted from the analysis. None of the items were found to delete at the innovation performance construct. Thus, reliability statistics promoted nine variables within two constructs for further study. Table 1 presented the analytical result for the reliability statistics of each construct.
Table 1: Reliability Statistics
|
Construct |
Cronbach’s Alpha | The average inter-item correlation coefficient | Name of the items | No of items | |
| Technological performance | 0.807 | 0.512 | VAR_ 8, 9, 10, 11 | 4 | |
| Innovation performance | 0.765 | 0.394 | VAR_13, 14, 15, 16,17 | 5 | |
| Total no of items | 9 | ||||
The construct-wise statistics showed that both constructs had good alpha values, i.e., 0.7 or higher, as suggested by [48]. The innovation performance construct had good average inter-item correlation (r = 0.394) whereas the technological performance construct had (r = 0.512) slightly higher than the recommended ideal range of 0.15 to 0.50 by [49]. A higher value of the average inter-item correlation indicated that the measuring variables might be capturing a small bandwidth and tended to be very similar to each other.
The study had an adequate sample size concerning the validity issue since the Kaiser-Meyer-Olkin (KMO) value of 0.816 from nine test items was more significant than the threshold value of 0.5 as recommended by [50]. The significant value of Bartlett’s test of sphericity (1035.011, df = 36, p = 0.000) indicated that the variables had some correlations to each other. The constructs’ validity was assessed by using convergent and discriminant validity. Table 2 presented the validity statistics of the technological and innovation performance model.
Table 2: Validity Statistics
|
Constructs |
Composite Reliability (CR) |
Average variance extracted (AVE) |
Max./Average shared variance (MSV/ASV) |
Constructs
|
|
|
Technological Performance |
Innovation Performance |
||||
| Technological performance | 0.79 | 0.49 | 0.212 | 0.70 | |
| Innovation performance | 0.77 | 0.40 | 0.212 | 0.47 | 0.63 |
Validity statistics showed that both constructs had a good value of composite reliability, i.e., greater than 0.7, as suggested by [51]. They stated that if the average variance extracted is less than 0.5, but composite reliability is higher than 0.70, the latent measures’ convergent validity is adequate. In addition, in [52], the authors proclaimed that AVE values > 0.4 are considered acceptable convergent validity measures. In the case of discriminant validity, there was no multicollinearity problem since inter latent variables correlation (r = 0.47) was less than the threshold value of 0.7, as recommended by [53]. Similarly, as per [51] criterion, AVEs of the constructs were greater than MSV/ASV. The square root of the constructs’ AVEs (presented in bold in Table 2) was higher than the correlation between the constructs for satisfactory discriminant validity. Therefore, the constructs were distinct and measuring the theoretically-driven facts. Besides, absolute values of skewness (- 0.515 to – 0.152) and kurtosis (- 0.949 to – 0.142) of the observed variables proved normality of the data as they were reported within the recommended ± 2 range [54]. The absolute value of standardized residual covariance of the variables (- 1.862 to + 1.589) within the recommended range of ± 2.58 [55] also indicated that the latent variables had a significant effect on the model.
6. Results and Analysis
By administrating the organized questionnaire to 391 cell phone users of Nepal Telecom and Ncell, the required information was accounted for, dissected, and deciphered. According to the sample encircled, responses were taken from understudies (56.7 %), service holders (38.9 %), business persons (2.3 %), and freelancers (2.0 %). Female (51.7 %) respondents were somewhat higher than the male (48.3 %) respondents. Even though the field study was conducted in Kathmandu valley, it covered all provinces of Nepal since the respondents regularly used to come to Kathmandu valley at one time or another. Demographically, the respondents were from: Province 1 (19.4 %), Province 2 (9.5 %), Bagmati (36.8 %), Gandaki (11.5 %), Lumbini (12.5 %), Karnali (4.6 %) and Sudur Pashchim (5.6 %). The study ensured almost equal participation from Nepal Telecom (50.1 %) and Ncell (49.9 %) and showed that 79.0 % of users carrying the pre-paid subscriber identity module (SIM) card exclusively. All the respondents had at least experience of five years or more in carrying the cell phone services in Nepal.
Descriptive statistics observed that all nine test variables except VAR_9 (signal strength and coverage) averaged more than 3.5 on a six-point Likert scale and revealed that all the test items within the constructs had the right intensity. The signal strength and coverage (VAR_9) was perceived to the lowest mean value of 3.21 (below the average mean of 3.5). Such a result indicated that cellular companies need to improve their signal strength and coverage. The respondents’ response dispersions from the mean of all indicator items were quite similar.
The study applied structural equation modeling (SEM) to evaluate the significance of the hypothesized paths and the model’s explanatory power by computing multiple correlation coefficients for each endogenous variable. Technological and innovation performance was measured by nine test variables within two latent variables, as presented in Figure 2, and the key parameter estimates of the model shown in Table 3.
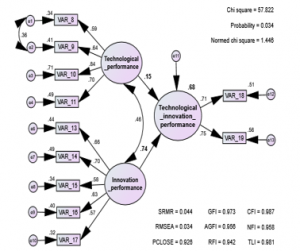
Figure 2: Technological and innovation performance model
Table 3: Parameter Estimates of the Technological and Innovation Performance Model
| Indicators | URW | SRW | SE | CR | p-value |
|
Technological performance —> Tech & innovation performance |
0.142 |
0.152 |
0.061 |
2.326 |
0.020 |
|
Innovation performance —> Tech & innovation performance |
0.941 |
0.743 |
0.119 |
7.920 |
*** |
| Network and service quality (VAR_8) <— Technological performance |
0.857 |
0.586 |
0.086 |
9.950 |
*** |
| Signal strength and coverage (VAR_9) <— Technological performance |
0.885 |
0.643 |
0.082 |
10.841 |
*** |
|
Voice quality (VAR_10) <— Technological performance |
1.179 |
0.844 |
0.097 |
12.198 |
*** |
|
Calls drop (VAR_11) <— Technological performance |
1.000 |
0.701 |
|||
| Product/service innovation (VAR_13) <— Innovation performance |
1.220 |
0.663 |
0.131 |
9.329 |
*** |
|
Process innovation (VAR_14) <— Innovation performance |
1.274 |
0.702 |
0.132 |
9.637 |
*** |
|
Customization (VAR_15) <— Innovation performance |
1.115 |
0.584 |
0.130 |
8.604 |
*** |
|
Competitive innovation (VAR_16) <— Innovation performance |
1.185 |
0.629 |
0.131 |
9.032 |
*** |
|
Marketing innovation (VAR_17) <— Innovation performance |
1.000 |
0.565 |
|||
| Overall technological aspect (VAR_18) <— Tech & innovation performance |
0.964 |
0.711 |
0.087 |
11.037 |
*** |
| Overall innovation aspect (VAR_19) <— Tech & Innovation performance |
1.000 |
0.749 |
|||
|
Technological performance <–> Innovation performance |
0.225 |
0.460 |
0.040 |
5.647 |
*** |
| e1 <–> e2 | 0.300 | 0.364 | 0.055 | 5.416 | *** |
|
Note: URW = Unstandardized regression weights; SRW = Standardized regression weights; SE = Standard error; CR = Critical ratio; *** = Significant at 0.01 level |
|||||
As presented in Table 3, the technological and innovation performance model produced statistically significant critical ratios at p ≤ 0.05 for all measuring test variables, covariance relationships between latent variables, and error terms. The testing model results produced standardized regression weights that were all significantly different from zero and above the 0.5 threshold level for a good fit, as recommended by [56]. The standardized regression weights indicated that innovation performance was a better predictor of technological and innovation performance (β = 0.743, p < 0.01) than technological performance (β = 0.152, p < 0.01). Various indices also observed to test the constructs’ model fit, as presented in Table 4.
Table 4: Model Fit Indices of the Technological and Innovation Performance Model
| Model fit measures |
Cut-off value |
Recommended by |
Model of the study |
|
| Chi square (χ2) | Smaller the better | Wan, 2002 | 57.822 | |
| Probability (p) | > 0.05 | Wan, 2002 | 0.034 | |
| Normed chi square [χ2 /df] | ≤ 3.00 | Kline, 1998 | 1.446 | |
| Standardized Root Mean-square Residual [SRMR] |
≤ 0.08 |
Hu & Bentler, 1999 |
0.044 |
|
| Root Mean Square Error of Approximation [RMSEA] |
≤ 0.08 |
Hu & Bentler, 1999 |
0.034 |
|
| RMSEA Associated p Value [PCLOSE] |
≥ 0.05 |
Garson, 2009 |
0.926 |
|
| Goodness of Fit Index [GFI] | ≥ 0.90 | Bagozzi & Yi, 1988 | 0.973 | |
| Adjusted Goodness of Fit Index [AGFI] |
≥ 0.90 |
Bagozzi & Yi, 1988 |
0.956 |
|
| Relative Fit Index (RFI) | ≥ 0.80 | Hair et al., 2006 | 0.942 | |
| Comparative Fit Index [CFI] | ≥ 0.90 | Hu & Bentler, 1999 | 0.987 | |
| Normed Fit Index [NFI] | ≥ 0.80 | Bentler & Bonnet, 1980 | 0.958 | |
| Tucker Lewis Index [TLI] | ≥ 0.90 | Hu & Bentler, 1999 | 0.981 | |
All the model fit indices were fallen in the range of recommended cutoff values and evidenced an excellent fit with the technological and innovation performance model. Exemplary values of the chi-square, normed chi-square, and probability as recommended by [57], [58], revealed the absolute and parsimonious fit of the model. Values of root-mean-square residuals, the root-mean-square error of approximation, associated p-value, and goodness of fit index as recommended by [59]-[61], further proved the absolute fit of the model. Values of adjusted goodness of fit index, comparative fit index, normed fit index, and Tucker Lewis index as recommended by [59], [61], [62], supported the incremental fit of the model.
7. Discussion and Conclusion
Traditional financial measures-based backward-looking accounting systems’ dissatisfaction led to a performance measurement revolution in the late 1970s [63]. Each organization has its reasons to measure performance. So, multidimensional performance measurement systems have been acknowledged since the 1990s. Scholars from different schools of thought have used the concept of subjective information to scale organizational performance. As the guidance of contingency theory, this study explores the subjective measures of technological and innovation performance in the Nepalese scenario. A literature review of the study identified 10 observed variables within two constructs to assess technological and innovation performance. The study did not accept the test variable e-CRM (VAR_12) as the determinant of technological performance in the Nepalese scenario though it was significant in the earlier studies like [23], [24].
The latent variable ‘technological performance’ was assessed from four observed variables: network and service quality (β = 0.586, p < 0.01); signal strength and coverage (β = 0.643, p < 0.01); voice quality (β = 0.844, p < 0.01); and calls drop (β = 0.701, p < 0.01) that directly influence the technological and innovation performance. Technology and information facilitate innovation in competitive markets [64]. As consistent with the past studies like [17]-[22], [65], the study confirms that network and service quality, signal strength and coverage, voice quality, and calls drops to have significant influence to choose the cell phone operators as the service provider. That means cell phone operators must ensure good and strong technological performance measures to satisfy their subscribers. Such evidences lead to an inference that technological performance at the Nepalese scenario was significantly associated with technological and innovation performance (β = 0.152, p < 0.01).
The latent variable ‘innovation performance’ was assessed from five observed variables: product/service innovation (β = 0.663, p < 0.01); process innovation (β = 0.702, p < 0.01); customization (β = 0.584, p < 0.01); competitive innovation (β = 0.629, p < 0.01); and marketing innovation (β = 0.565, p < 0.01). Service innovation influences customer satisfaction and retention [66] that eventually leads to better organizational performance. Process innovation applies a new method for doing something that helps an organization remain competitive and meets customer demands. Customization can govern the effectiveness of other capabilities and create higher competitive advantages [67]. Competitive innovation differentiates and adds competitive value to their products/services by adopting innovations and new technologies. Marketing innovation aims to give value to the customers and to improve competitive advantage. As consistent with previous research like [68]-[70], the study showed that the observed variables have a positive and significant effect on innovation performance. Besides, it supports the study conducted in [71] that innovation performance positively and significantly impacts technological and innovation performance. Hence, innovation culture has been pronounced as a pre-condition for improving organizational, marketing, and managerial entrepreneurship in a competitive environment [72]. In other words, the innovative capabilities have a direct and positive impact on organizational performance [69]. All the evidence lured that innovation performance in the Nepalese scenario was significantly associated with technological and innovation performance (β = 0.743, p < 0.01). As per the conceptual framework of the study, the overall model summary is presented in Figure 3.

Figure 3: The model summary
The study outcomes inferred that each of the subjective performance measures provides a partial explanation of the synergetic impacts on organizational performance. The study observed nine contingent variables that quantified two response variables to measure technological and innovation performance. The technological and innovation performance depends on a fit or math between various contingent factors. Consequently, the study concludes that the model’s validation and fit were vital because they provide empirical evidence for measuring non-financial organizational performance. More precisely, it offers the power of the Nepalese cellular telecommunications industry’s technological and innovation performance measures. It is believed that the level of technological advancement with innovativeness is an essential determinant of organizational performance.
8. Limitations and Future Research
Studies of performance measurement systems cover several disciplines, and their methodological approaches differ considerably. It made a comprehensive examination extremely challenging. As a result, only two aspects of the performance measures, technological performance measures, and innovation performance measures have been considered in this study. The study variables were developed the most straightforward ways since they could be easily understandable and the respondents could mark the structured questionnaire’s option precisely. The technological performance measures have been associated with the characteristics of mobile phone networks. In contrast, innovation performance measures have been associated with the business in general because a common respondent cannot grasp the technological essence of innovation performance measures in Nepal.
Although the analysis made for the study is rigorous and the findings significantly relatable, this study is a representative instead of a comprehensive effort. The key drawback was that the analysis used only the quantitative survey to collect the necessary information with a structured questionnaire, using the terms accessible to ordinary users. The structured questionnaire denies the opportunity to discuss many of the relevant issues of the responses. Nonetheless, all the tests have been carried out to assess the authenticity and reliability of the information obtained. The reliability could depend on the number of participants that could have been further improved by a larger sample further emphasizing on the validity and generality of the findings.
The study examined new contingent variables in the cellular industry’s organizational performance measurement system. The findings of the study will serve as a foundation for future studies to refine the theory. Researchers may consider more variables such as additional packages provided by operators, latency, security, etc. not covered in this analysis. Similarly, the ownership of firm can be integrated into the research model to identify whether the findings vary with various corporate holdings. On the other hand, future studies can concentrate on other sectors or other countries to address and compare related topics with this report. These results thus unravel the avenue for future research in various contingent variables to generalize the theory. Finally, this study hopes that the analysis findings will be useful for practitioners, researchers, or policy makers and will lead to related studies and future research as a guide.
9. Implications
Studies have shown that various performance assessment frameworks have been maintained across the world. In the case of Nepal, no corporation tends to make specific use of technological and innovative performance measures explicitly in the organizational performance process. Therefore, this study sought to analyze the effects of performance measures that could further improve the Nepalese cellular telecommunications industry’s organizational performance. The consequences of this study have been divided into two parts: practical and theoretical perspectives.
9.1. <Practical Implications
The study results would help telecommunications industry managers recognize the customers’ perception of organizational success as a path to technical acceptance and innovation in the Nepalese scenario. The analysis provides more evidence for the various management decisions. Managers can focus on variables that obtained low weights from respondents. This study would also provide valuable guidance for identifying the critical driving variables of technical and innovative change and offer insightful knowledge on the system’s strategic areas of organizational performance evaluation.
9.2. Theoretical Implications
The study is driven by the contingency theory, which provides a reliable lens to consider different variables and new ways to measure them. Every measure of a firm’s performance has advantages and disadvantages, and provides a prospect of success for researchers. It endeavored to fill the literature gap and address the Nepalese scenario’s issues not considered by previous researchers. On the other hand, the government can help companies innovate by leading and supervising their innovation efforts and by providing them with an amiable institutional environment.
- A. Elrahman, A. El-Borsaly, S. Hassan, “The impact of service quality on organizational performance in the mobile telecommunications sector in Egypt,” Proceedings on Engineering Sciences, 2(1), 93-104, 2020, doi: 10.24874/PES02.01.010.
- J. Barney, “Firm resources and sustained competitive advantage,” Journal of Management, 1(17), 99-120, 1991.
- N. Hussein, A. Mohamad, F. Noordin, N.A. Ishak, “Learning organization and its effect on organizational performance and organizational innovativeness: A proposed framework for Malaysian Public Institutions of Higher Education,” Procedia-Social and Behavioral Sciences, 130, 299-304, 2014.
- N.A. Morgan, D. W. Vorhies, C.H. Mason, “Market orientation, marketing capabilities, and firm performance,” Strategic Management Journal, 30(8), 909-920, 2009. doi:10.1111/1467-88963B.00097.
- N. Venkatraman, V. Ramanujan, “Measurement of business performance in strategy research: A comparison of approaches,” Academy of Management Review, 11(4), 801-14, 1986.
- T.Z.T. Mat, M. Smith, “The impact of changes in environment and AMT on management accounting practices and organizational strategy, structure and performance,” Journal of Applied Management Accounting Research, 12(1), 55-82, 2014.
- Nepal Telecommunication Authority, “Management information system report,” 140(188), 1-10, July 2020.
- M.U. Din, I.U. Mangla, M. Jamil, “Public policy, innovation and economic growth: An economic and technological perspective on Pakistan’s telecom industry,” The Lahore Journal of Economics, 21, 369-391, 2016.
- J.A. Varela, M. del Río, “Market orientation behavior: An empirical investigation using MARKOR,” Marketing intelligence & Planning, 21(1), 6-15, 2003.
- J.S. Chen, T.H. Tsou, A.Y.H. Huang, “Service delivery innovation: Antecedents and impact on firm performance,” Journal of Service Research, 12(1), 36-55, 2009.
- K.H. Huarng, “A comparative study to classify ICT developments by economies,” Journal of Business Research, 64(11), 1174-1177, 2011. doi:10.1111/1467-98X.00097.
- S.P. Yeh, H-W. Fu, “Effects of service innovation on customer satisfaction in recreation industry,” International Journal of Applied Mathematics and Statistics, 38(8), 107-116, 2013.
- M.R. Saco, P.A. Goncalves, “Service design: An appraisal,” Design Management Review, 19(1) 10-19, 2008.
- S.K. McEvily, K.M. Eisenhardt, J.E. Prescott, “The global acquisition, leverage, and protection of technological competencies,” Strategic Management Journal, 25(8), 713–722, 2004.
- W.J. Orlikowski, “Using technology and constituting structures: A practice lens for studying technology in organizations,” Organization Science, 11(4), 404–428, 2000.
- Y. Xu, D.C. Yen, B. Lin, D.C. Chou, “Adopting customer relationship management technology,” Industrial Management & Data Systems, 102(8), 442-452, 2002.
- N.K. Saha, M.R. Islam, A.U. Hoque, “Factors affecting customers’ satisfaction of mobile phone subscribers: An empirical study on mobile telecommunication industry in Bangladesh. International Journal of Business and Management, 11(6), 252-261, 2016.
- R. Negi, “Determining customer satisfaction through perceived service quality: A study of Ethiopian mobile users, International Journal of Mobile Marketing, 4(1), 31-38, 2009.
- S. Rahman, A. Haque, M. Ahmad, “Choice criteria for mobile telecom operator: Empirical investigation among Malaysian customers,” International Management Review, 7(1), 50-57, 2011.
- K.S. Woo, H.K.Y. Fock, “Customer satisfaction in the Hong Kong mobile phone industry,” The Service Industries Journal, 19(3), 162–174, 1999.
- E.T. Aire, B.T. Maharaj, L.P. Linde, “Implementation considerations in a SIP based secure voice over IP network,” in Proceedings of the 7th AFRICON, 167-172, Botswana, Africa, 2004.
- B. Eljaam, Customer satisfaction with cellular network performance: Issues and analysis, Ph. D. Dissertation, Iowa State University, United States, 2005.
- C. O’Leary, S. Rao, C. Perry, “Improving customer relationship management through database/internet marketing,” European Journal of Marketing, 38(3/4), 338-354, 2004.
- N. Kim-soon, M.F. Zulkifli, “The impact of electronic customer relationship management (e-CRM) on the business performance of small company,” Journal of Engineering and Technology, 3(12), 139-153, 2012.
- M. Dachyar, L. Hananto, “Innovation and quality service factors to customer loyalty in Indonesia telecommunication company by using structural equation modeling method,” Management and Technology in Knowledge, Service, Tourism & Hospitality, 1, 41-44, 2014, https://doi.org/10.1201/b16700-10.
- M. Polder, G.V. Leeuwen, P. Mohnen, W. Raymond, “Product, process and organizational innovation: Drivers, complementarity and productivity effects. CIRANO–Scientific Publications, 2010s-28, 2010, http://dx.doi.org/10.2139/ssrn.1626805
- D.M. DeCarolis, “Competencies and imitability in the pharmaceutical industry: An analysis of their relationship with firm performance,” Journal of Management, 29(1), 27–50, 2003.
- S. Thornhill, “Knowledge, innovation and firm performance in high-and low-technology regimes,” Journal of Business Venturing, 21(5), 687–703, 2006.
- G. Zaefarian, S. Forkmann, M. Mitręga, S.C. Henneberg, “A capability perspective on relationship ending and its impact on product innovation success and firm performance,” Long Range Planning, 50(2), 184–199, 2017.
- T. Dotzel, V. Shankar, L.L. Berry, “Service innovativeness and firm value,” Journal of Marketing Research, 50(2): 259–276, 2013, http://dx.doi.org/10.1509/jmr.10.0426.
- A.F. Akgün, H. Ince, S.Z. Imamoglu, H. Keskin, I. Kocoglu, “The mediator role of learning capability and business innovativeness between total quality management and financial performance,” International Journal of Production Research, 52(3), 888–901, 2014.
- T. Anning-Dorson, “Organizational culture and leadership as mediators of service innovation and firm competitiveness: A study of an emerging economy,” International Journal of Innovation Management, 20(7), 1-29, 2016b.
- T. Anning-Dorson, “Interactivity innovations, competitive intensity, customer demand and performance,” International Journal of Quality and Service Sciences, 8(4), 536–554, 2016a.
- N.N.A. Aziz, S. Samad, “Innovation and competitive advantage: Moderating effects of firm age in foods manufacturing SMEs in Malaysia,” Procedia Economics and Finance, 35, 256-266, 2016.
- M.U. Hassan, S. Shaukat, M.S. Nawaz, S. Naz, “Effects of innovation types on firm performance: An empirical study on Pakistan’s manufacturing sector,” Pakistan Journal of Commerce and Social Sciences, 7(2), 243-262, 2013.
- A. Rodríguez-Pose, R. Crescenzi, “Mountains in a flat world: Why proximity still matters for the location of economic activity,” Cambridge Journal of Regions, Economy and Society, 1(3), 371–388, 2008.
- H.V. Auken, A. Madrid-Guijarro, D. Garcia-Perez-de-Lema, “Innovation and performance in Spanish manufacturing SMEs,” International Journal of Entrepreneurship and Innovation Management, 8(1), 36-56, 2008.
- K. B. Clark, T. Fujimoto, Product development performance: Strategy, organization, and management in the world auto industry, Boston: Harvard Business School Press, 1991.
- S. A. Zahra, G. George, “Absorptive capacity: A review, reconceptualisation and extension. Academy of Management Review, 27(2), 185-203, 2002, https://doi.org/10.5465/AMR.2002.6587995.
- D. Leonard-Barton, “Core capabilities and core rigidities: A paradox in managing new product development”, Strategic Management Journal, 13(S1), 111–125, 1992.
- R. Blundell, R. Griffith, J. Van Reenen, “Market share, market value and innovation in a panel of British manufacturing firms”, Review of Economic Studies, 66(3), 529-554, 1999, DOI:10.1111/1467-937X.00097.
- A. De Massis, F. Frattini, E. Pizzurno, L. Cassia, “Product innovation in family versus nonfamily firms: An exploratory analysis”, Journal of Small Business Management, 53(1), 1-36, 2013, DOI:10.1111/jsbm.12068.
- C. Carmen, G. M. Jose, “The role of technological and organizational innovation in the relation between market orientation and performance in cultural organizations, European Journal of Innovation Management, 11(3), 413-434, 2008, DOI: 10.1108/14601060810889035.
- B. Menguc, S. Auh, “Creating a firm-level dynamic capability through capitalizing on market orientation and innovativeness”, Academy of Marketing Science Journal, 34(1), 63-73, 2006.
- A. Koohang, J. Paliszkiewicz, J. Goluchowski, “The impact of leadership on trust, knowledge management, and organizational performance: A research model, Industrial Management & Data Systems, 117(3), 521-537, 2017.
- R. Krejcie, D. Morgan, “Determining sample size for research activities,” Educational & Psychological Measurement, 30, 607-610, 1970.
- B.L. Bowerman, R.T. O’Connell, J.B. Orris, Essential business statistics (3rd ed), McGrawHill, 2004.
- J.C. Nunnally, Psychometric theory (3rd ed.), McGraw-Hill, 1993.
- L.A. Clark, D. Watson, “Constructing validity: Basic issues in objective scale development,” Psychological Assessment, 7(3), 309-319, 1995.
- H.F. Kaiser, “An index of factorial simplicity,” Psychometrika, 39, 31–36, 1974.
- C. Fornell, D.F. Larcker, “Evaluating structural equation models with unobservable variables and measurement error,” Journal of Marketing Research, 18(1) 39-50, 1981.
- R.P. Bagozzi, H. Baumgartner, The evaluation of structural equation models and hypothesis testing, In R. P. Bagozzi (ed.), Principles of marketing research 386–422, Cambridge: Blackwell, 1994.
- L.S. Meyers, G. Gamst, A.J. Guarino, Applied multivariate research: Design and interpretation, Sage Publications, Inc., 2006.
- D. George, M. Mallery, SPSS for windows step by step: A simple guide and reference, 17.0 update (10a ed.), Pearson, 2010.
- B.M. Byrne, Structural equation modeling with AMOS: Basic concept, applications, and programming (2nd ed.), Taylor and Francis Group, 2010.
- J.F.Hair, W.C. Black, B.J. Babin, R.E. Anderson, R.L. Tatham, Multivariate data analysis, Prentice Hall, Pearson Education, Inc., 2006
- T.T.H. Wan, Evidenced-based health care management: Multivariate modeling approaches, Kluwer Academic Publishers, 2002.
- R.B. Kline, Methodology in the social sciences: Principles and practice of structural equation modeling, Guilford Press, 1998.
- L. Hu, P. Bentler, “Cutoff criteria for fit indices in covariance structure analysis: Conventional criteria versus new alternatives,” Structural equation modeling – A multidisciplinary journal, 6(1), 1-55, 1999.
- G.D. Garson, “Structural equation modeling”, 2009, http://faculty.chass.ncsu.edu/garson/PA765/structur.htm
- R. Bagozzi, Y. Yi, “On the evaluation of structural equation models, Journal of the Academy of Marketing Science, 16(1), 74-94, 1988.
- P.M. Bentler, D.G. Bonnet, “Significance tests and goodness of fit in the analysis of covariance structures,” Psychological Bulletin, 88, 588-606, 1980.
- S. S. Nudurupati, U.S. Bititci, V. Kumar, “State of the art literature review on performance measurement,” Computers & Industrial Engineering, 60(2), 279-290, 2011.
- A. Sood, G. J. Tellis, “Do innovations really pay off? Total stock market returns to innovation, Marketing Science, 28(3), 442–456, 2009.
- S. Khan, S. Afsheen, “Determinants of customer satisfaction in telecom industry–A study of telecom industry Peshawar KPK Pakistan,” Journal of Basic and Applied Scientific Research, 2(12), 12833-12840, 2012.
- S. Salunke, J. Weerawardena, J.R. McColl-Kennedy, “Competing through service innovation: The role of bricolage and entrepreneurship in project-oriented firms,” Journal of Business Research, 66(8), 1085-1097, 2013.
- C. K. Prahalad, V. Ramaswamy, “Co-creation experiences: The next practice in value creation,” Journal of Interactive Marketing, 18(3), 5–14, 2004.
- S. Afriyie, J. Du, K. Appiah, A-A. I. Musah, “The nexus between types of innovation and marketing performance of SME in an emerging economy,” International Review of Management and Marketing, 8(6), 78–92, 2018, https://doi.org/10.32479/irmm.7042
- L.F. Hsieh, L.H. Lin, “A performance evaluation model for international tourist hotels in Taiwan – An application of the relational network DEA,” International Journal of Hospitality Management, 29, 14–24, 2010.
- S. Yıldız, F. Baştürk, I. T. Boz, “The effect of leadership and innovativeness on business performance,” Procedia-Social and Behavioral Sciences, 150, 785–793, 2014.
- V.H. Nam, “The roles of human and social capital in the development of manufacturing SMEs in Vietnam, Journal of Economic Development, 16(1), 5-22, 2014, https://doi.org/10.33301/2014.16.01.01.
- H. Aksoy, “How do innovation culture, marketing innovation and product innovation affect the market performance of small and medium-sized enterprises (SMEs)?” Technology in Society, 51, 133-141, 2017, https://doi.org/10.1016/j.techsoc.2017.08.005.