Design of a Remote Real-time Groundwater Level and Water Quality Monitoring System for the Philippine Groundwater Management Plan Project
 , Maria Aileen Leah G. Guzman 2, Maria Leonora C. Guico 1, Jose Claro N. Monje 1, Mark Glenn F. Retirado 1, John Chris T. Kwong 1, Genevieve C. Ngo 1, Annael J. Domingo 1
Adv. Sci. Technol. Eng. Syst. J. 5(6), 1007–1012 (2020);
 DOI: 10.25046/aj0506121
Recent technological advances allow us to utilize remote monitoring systems or real-time access of data. While the use of remote monitoring systems is not new, there are still numerous applications that can be explored and improved on, one such is groundwater level and quality monitoring. In the Philippines, the extraction of groundwater for both domestic use and industrial use are manually monitored by the government’s concerned agency and is done at least once per year. With this current setup, the real and significant state of the groundwater is not reflected in a way that is most valuable to the government and to the community. This project aims to design and develop a remote real-time groundwater level and quality monitoring system. It is intended to provide quantitative data for policy makers in addressing recurrent water shortages in the Philippines. This paper discusses the designed system composed of three modules: power module, sensors and control, and data visualization. These three modules provide real-time data from far-flung locations while being energy-sustainable. Dry runs of the system in a controlled environment yielded excellent results — average data accuracy of 96.63% for all six (6) groundwater quantity and quality parameters namely: pH, temperature, electrical conductivity, total dissolved solids, salinity, and static water level (SWL), and 90.63% data transmission reliability. Initial deployment of the system on one of the groundwater monitoring well in Metro Manila, Philippines returned a 91.16% data transmission reliability. The system is currently installed in 20 groundwater monitoring sites all-over the Philippines and is scheduled for more installations.
1. Introduction
In the Philippines, the main freshwater sources are inland surface water and groundwater. These water sources are used by the agricultural, industrial, and domestic sectors [1]. For the domestic sector, the ideal setup utilizes the surface water as the main source and the groundwater as a reserve during a water crisis [2]. But in the current recurring water shortage crisis, it is inevitable that these groundwater reservoirs are tapped as additional water resources.
The monitoring of water supply and water quality using observation wells is paramount. There are calls for deployment of sensor systems for monitoring wells for dense communities with high water usage and industrial areas producing wastes and contaminants [2]. If the rate of potential groundwater recharge is lower than the rate of extraction, the extraction well could dry up. Additionally, water contamination will harm the consumers, including agricultural farms and livestock located downstream [3].
Regular monitoring of the water is crucial. There is a need for automated water quality monitoring systems that regularly gather data from observation wells at designated and crucial times of the day. This lessens manual collection of samples, particularly in hard-to-reach and dangerous areas [4]. The use of wireless sensor networks (WSNs), deployed on-site to transmit data back at specified intervals, has been found to be an efficient way of regularly monitoring and ensuring that water quality remains consistent and compliant with standards [5]-[7]. This setup provides needed information to relevant agencies that allow them to make well-informed decisions and guidelines for water conservation.
In full, this paper focuses on the design of the sensor system composed of three modules, namely: the power supply, sensor and control, and data visualization.
2. Overall System Overview
Figure 1 shows the overall framework of the groundwater monitoring system which is composed of: (A) Power Supply, (B) Sensor and Control, (C) Data Visualization, and (D) Monitoring Well. While the block diagram of the whole system and components for each sub-system are shown in Figure 2.
The power supply sub-system provides power to the sensor and control sub-system through a rechargeable battery. The battery and solar panel are both managed by the solar charge control to prevent unwanted voltage or current discharges during low sunlight or nighttime.
The sensor and control sub-system uses a microcontroller to fetch data from the sensor units. The sensor data collected are pH level (pH), temperature, electrical conductivity (EC), total dissolved solids (TDS), salinity, and groundwater level (static water level). These water parameters are listed under the water quality monitoring guidelines for groundwater from the Philippines’ Department of Environment and Natural Resources Administrative Order No. DAO-2016-08 [8]. This set of sensor data is consolidated and sent to the cloud server using a GSM/GPRS module [9], [10]. This sub- system uses an on-site micro-SD card for data back-up in case of remote communication loss.
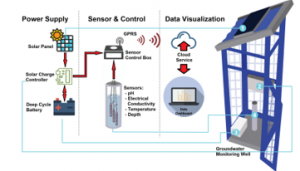
Figure 1: GMP System Framework

Figure 2: GMP System Block Diagram
Once the data is received by the cloud server, they are processed by the data visualization sub-system. The processed visualized data can be accessed through a dedicated website. The website includes a presentation of the project with its goals and partner institutions; a map showing the monitoring well sites with sensor systems; a view of available data; and a page on helpful information regarding water level and water quality parameters.
3. Design Implementation
3.1. Power Supply
It is essential that the system has a reliable power supply to operate and transmit data at required intervals. The system’s power supply is composed of the solar battery, the solar panel, and the charge controller. Actual components used are shown in Figure 3.
The solar battery acts as the main source of power for the sensor system. It provides power while being rechargeable by harnessing solar energy.

Figure 3: Solar charge controller (left), Solar panel (center), Deep cycle battery (right)
The solar panel charges the battery to keep it above the cutoff voltage. The solar panel harvests energy from the sun and converts it to electrical energy. To replenish the energy consumption of the system, the solar panel is located and properly positioned to be directly exposed to sunlight for at least 3 hours a day. Unable to meet the minimum exposure time might not guarantee full recharge of the solar battery. In this case, the sensor system will only work until the energy of the solar battery is depleted. The specification of the solar panel is shown in Table 1.
Table 1: Solar Panel Specifications
| Type | Mono Crystalline |
| Power | 50W |
| Open-Circuit Voltage | 22.5V |
| Current at Max Power | 2.75A |
| Material | Weatherproof Tempered Glass
Aluminum Frame |
| Dimensions | 70×54 cm2 |
The solar charge controller maintains the proper recharging and disconnection of the solar panel and the battery. The solar charge controller disconnects the solar panel when the solar panel output voltage does not meet the minimum requirement for charging the battery. Also known as a solar charge regulator, it protects a solar battery’s life by limiting the electric current allowed to the connected solar battery when charging, and from the solar battery while used to power a device.
The solar charge controller in the setup has 3 pairs of positive and negative terminals where three types of devices can be attached: a solar panel, a battery, and a load. The load in this case is the sensor control box. A cutoff voltage is set to prevent the battery from fully draining itself. This allows the system to work for roughly two (2) weeks without sunlight exposure.
3.2. Sensor and Control
A Bluno Mega microcontroller is the central unit of the sensor system. It features enough serial ports to accommodate the various sensors and can be managed via Bluetooth communications for the calibration method. It collects sensor data before sending it using a GSM/GPRS module.

Figure 4: pH sensor probe (left), Submersible pressure sensor (center), and EC sensor probe (top right)
The sensor system measures groundwater quality by collecting the parameters pH, temperature, electrical conductivity, total dissolved solids, and salinity. A sixth parameter, static water level (SWL), is included to measure groundwater quantity relative to the ground level. The sensor system uses off-the-shelf environmental sensors from Atlas Scientific and a pressure transducer from Sendo Sensors. The sensor components are shown in Figure 4. The sensors used with the corresponding units are summarized in Table 2.
Table 2: Water Level and Water Quality Sensors
| Sensor | Parameter | Unit |
| Atlas Scientific
Industrial pH Sensor |
pH,
Temperature |
pH
°Celsius |
| Atlas Scientific
Industrial Conductivity K 1.0 Sensor |
Conductivity, Total Dissolved Solids, Salinity | microSiemens/centimeter
ppm, ppt |
| Sendo Sensors
Pressure Transducer |
Static Water Level | meter |
The Atlas Scientific sensor probes are interfaced with Atlas Scientific carrier boards for better electrical isolation. Each EZO™ circuit carrier board from Atlas Scientific contains calibration data and receives the analog sensor information to be sent to the Bluno Mega’s serial ports as digital data. The system contains three EZO™ circuits: pH, temperature, and electrical conductivity. The pH sensor probe is also being used for temperature detection, hence it is connected to both the pH and temperature EZO™ circuit carrier boards.
The Sendo Sensors pressure transducer sends signal directly as current in milli-Ampere values. However, the Bluno Mega’s Analog-to-Digital Converter can only read voltage signals. The sensor probe’s 4-20mA current loop is connected in parallel to a resistor to convert the electrical signal as a corresponding voltage value. Since the maximum voltage the Bluno can read is 5-volts, we need a 250-ohm parallel resistor. The available single-resistor resistance value closest is 220 ohms. Therefore, our highest analog voltage reading peaks at 4.4 volts, and the pressure data is calibrated accordingly.
3.3. Data Visualization
For data telemetry, a minimum-standard 2.5G network is used for data transmission to cloud servers since there are areas in the Philippines that do not have access to even a 3G network and above. With this limitation, the Elecrow SIM800C GSM/GPRS module is chosen as the data telemetry module.
Since the GPRS module is designed for Arduino, minimal modification is required to interface it with the Bluno Mega. However, the pin assignments for software serial ports are different. The GSM module’s default software serial ports are at pins 7 and 8. Since these pins are not usable as software serial pins for Bluno Mega, pins 7 and 8 of the GSM module are rewired to pins 10 and 11 of the Bluno Mega, respectively.
4. Results
4.1. The Sensors and Control Box
Figure 5 shows the setup of the system in a controlled environment, as well as the setup installed on some of the groundwater monitoring wells in Metro Manila, Philippines. The sensors and control box are tested for accuracy after calibration by comparing the sensor readings to that of the known values of several specified buffer solutions.
Note that prior to actual calibration, initial trend tests should show the sensor reacting to its specific parameter, e.g., pH level. Once the trend test readings show a correct trend, such as pH level sensor value increasing when dipped in higher pH level, the sensor is then accepted for calibration.
For calibration, the pH sensor is tested using pH buffer solutions 4, 7, and 10, being acidic, neutral, and basic solutions respectively. The sensor’s electrical responses for each of the buffer solution are recorded. Then by using linear regression method on the three calibration points, any pH values outside the buffer solution range can be obtained. As for the electrical conductivity sensor, three-point calibration method is also used. The first point being the dry-state or 0µS (zero), second and third points uses standard electrical conductivity solutions 1,440µS and 12,880µS respectively from Atlas Scientific, with the higher value being the more conductive or saline solution. The same linear regression method is used to determine electrical conductivity values outside the calibration points. As for the pressure sensor, it is calibrated based on water depth and pressure relationship. The sensor is dipped in a container filled with water and with known depth. Two-point calibration is used for determining water depth with respect to pressure read by the sensor. To test the accuracy of the pH and EC sensors after calibration, the sensors are re-tested in parallel with a pH level digital testing stick, a litmus paper, and an EC testing stick.
Shown in Figure 6 are the results of the pH level test after calibration. The different instruments used showed almost consistent values with the pH solution, thus validating the performance of the system’s pH sensor. This results in a computed general accuracy for the pH sensor of 95%.

Figure 5: Test setup in a controlled environment (top-left), the setup installed on some of the groundwater monitoring wells (top-right, bottom-left), and the team during one of the system installations (bottom-right)

Figure 6: pH level test using litmus paper, digital tester, and the pH sensor
4.2. Test Setup and Initial Deployment
To further test the different sensors, the setup equipped with data telemetry capability was left in a controlled environment with distilled water for 4 days, as can be seen in Figure 5 (top-left). Table 3 indicates the summary of data gathered for 4 days: showing the minimum, maximum, and average values transmitted for each parameter; the accuracies of the transmitted values compared to the expected values; and the overall average accuracy. The accuracy for parameters pH, temperature, EC, TDS, salinity, and SWL are 92.14%, 94.69%, 97.26%, 99.06%, 100%, and 100% respectively, which then translate to an overall average accuracy of 96.63%. These accuracy values are very well comparable with the sensors’ technical specifications which are listed at 95%-98% accuracy.
Table 3: Summary of Test Data from Controlled Environment
| pH | Temp | EC | TDS | Sal | SWL | |
| Min | 7.09 | 23.33 | 640 | 346 | 0.31 | 0.17 |
| Max | 7.95 | 29.82 | 763 | 412 | 0.37 | 0.19 |
| Average | 7.55 | 27.38 | 719.17 | 388.63 | 0.35 | 0.18 |
| Expected | 7 | 26 | 700 | 385 | 0.35 | 0.18 |
| Accuracy (%) | 92.14 | 94.69 | 97.26 | 99.06 | 100 | 100 |
| Average Accuracy (%) | 96.63 | |||||
After yielding promising results from the controlled test setup, the system was then deployed initially on one of the groundwater monitoring well in Metro Manila, Philippines, as shown in Figure 5 (top-right). The setup was left on the monitoring well for 31 days equipped with data telemetry and solar panel for power sustainability. Table 4 shows the summary of data gathered from the deployed system. Different with the data from controlled setup, data from the deployed setup were not compared with any expected values due to the nature of the setup being a monitoring system. Accuracy checks for sensor readings were done prior to installing the system on the groundwater monitoring well by comparing them with the values obtained using pH level and EC digital testing kits, as well as the manual measurement of the actual SWL.
Table 4: Summary of Data from initially deployed Monitoring System
| pH | Temp | EC | TDS | Sal | SWL | |
| Min | 9.06 | 36.05 | 1105 | 597 | 0.55 | 17.05 |
| Max | 11.82 | 36.37 | 1391 | 751 | 0.70 | 17.97 |
| Average | 9.83 | 36.23 | 1237.02 | 668.27 | 0.62 | 17.44 |
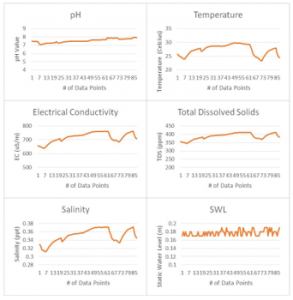
Figure 7: Sensor Test Results at 100 data points (x-axis)
4.3. The Telemetry
In terms of data transmission reliability, we have the system send data around every hour. In this paper, we define data transmission reliability as the capacity of the system to transmit data to the remote server via GPRS communication [11]. Table 5 shows the summary for the data telemetry reliability. For the controlled-environment setup, the remote server was able to receive 87 data sets out of the expected 96 from the 4-day test setup, thus yielding 90.63% of data telemetry reliability. While for the field-deployed setup, the remote server was able to receive 650 out of the 713 data sets, for 91.16% transmission reliability. These reliability values also translate to about 21 data sets per day. The complete 87 data sets from the controlled-setup can be seen represented by the graphs shown in Figure 7.
Table 5: Summary for Data Telemetry Reliability
| # OF DATA SET | |||
| Controlled-Setup | Deployed-Setup | ||
| Actual | 87 | Actual | 650 |
| Expected | 96 | Expected | 713 |
| Reliability (%) | 90.63 | Reliability (%) | 91.16 |
4.4. The Power and Sustainability
A simple voltage divider circuit is installed in the control system for the Bluno to read the voltage level of the battery power source. This allows for remotely monitoring the power level of the system for its consumption and recharging cycles. In Figure 8, the battery voltage trend both for controlled- and deployed-setups having 87 data sets can be seen. The battery voltage for the setup under controlled-environment have a decreasing trend with the setup being in a laboratory setting where the battery is not connected to a solar panel or any charging source. While the voltage trend for the deployed-setup shows a cyclic trend for charging and discharging phases that signifies that the solar panel is decently exposed to sunlight.
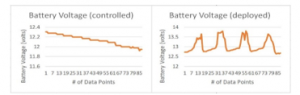
Figure 8: Battery voltage trend, controlled-environment (left), deployed-setup (right)
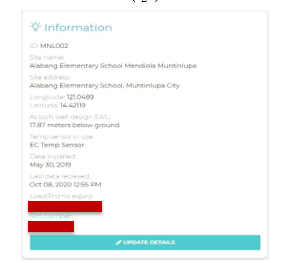
Figure 9: Screenshot of the Data Visualization Platform showing the information regarding the Monitoring Well
4.5. Data Visualization
After gathering these water quantity and quality parameters, the control box sends the data to a cloud server for visualization purposes in a web-based platform. These can be viewed publicly on the website of the project. The data are sorted according to location, data type (pH, temperature, EC, TDS, Sal, SWL), and in chronological order. A screenshot of the data visualization in Figures 9 shows the information about one of the monitoring wells in Metro Manila, Philippines, while Figure 10 shows the monitoring well’s actual SWL readings for about a month.

Figure 10: Screenshot of the Data Visualization Platform showing actual SWL data
5. Conclusion
The research group is able to develop a fully-functional energy-sufficient remote monitoring system that can gather and record accurate groundwater quality and quantity data. The data can be transmitted reliably to a separate web-server. Further testing for robustness and accuracy during extended field deployments is recommended. In conclusion, the designed and developed system can operate with an overall average accuracy of 96.63% for 6 water quantity and quality parameters, and 91% data transmission reliability. Considering the data transmission requirement of at least 1 data set per day by the funding agency, it is therefore recommended for installation for the remaining groundwater monitoring wells all over the Philippines.
One of the challenges encountered during the designing and development of the system is the calibration of the sensors as there are occasions where the manufacturer’s calibration kits are off. Worth mentioning is the pH sensor since its EZOTM circuit is very sensitive to electrical static discharge and mishandling. It is also problematic to manually control its calibration offsets. The analog pH sensor is used instead. By mathematically computing for the calibration equations and offsets, more consistent readings of pH values are obtained.
Another challenge is the power consumption of the system. The sensors consume more power than the charging capability of the power sub-system due to unforeseen lower solar exposure. This is remedied by having the sensors undergo sleep mode majority of the time and varying the remote sending frequency of the system.
Acknowledgment
This research is a project implemented by the Ateneo de Manila University (ADMU), funded by the Department of Science and Technology (DOST) – Philippine Council for Industry, Energy and Emerging Technology Research and Development (PCIEERD), National Water Resources Board (NWRB), and partially funded by the University Research Council (URC) of the Ateneo and the Ateneo Research Institute of Science and Engineering (ARISE).
- The World Bank Group, Philippines: Environment Monitor 2006 (English), 1, Washington, D.C., 2006.
- A.C. Rola, J.M. Pulhin, A.H. Rosalie, Water supply and demand and the drivers of change in Water Policy in the Philippines: Issues, Initiative, and Prospects, Springer International Publishing: 15–40, 2018.
- National Water Resources Board, Water Resources Assessment for Prioritized Critical Areas (Metro Manila), Metro Manila, 2004.
- National Water Resources Board, 2018 Annual Report, National Water Resources Board, Metro Manila, 2018.
- K. Sumathi, E. Christina Dally, G.V. Ashwini, S. Saigokul, “Water Pollution Indicator using Arduino Uno,” International Journal of Innovations in Engineering and Technology, 9(2), 28–39, 2017, doi:10.21172/ijiet.92.05.
- S. Pasika, S.T. Gandla, “Smart water quality monitoring system with cost-effective using IoT,” Heliyon, 6(7), e04096, 2020, doi:10.1016/j.heliyon.2020.e04096.
- L.B. Imran, R.M.A. Latif, M. Farhan, H. Aldabbas, “Smart City Based Autonomous Water Quality Monitoring System Using WSN,” Wireless Personal Communications, 115(2), 1805–1820, 2020, doi:https://doi.org/10.1007/s11277-020-07655-x.
- Department of Environment and Natural Resources, Water Quality Guidelines and General Effluent Standards of 2016 (DAO 2016-08), 2016.
- Elecrow, Elecrow GPRS/GSM Shield v1.0 Guide, 2019.
- J. Du, J. Guo, D. Xu, Q. Huang, “A remote monitoring system of temperature and humidity based on OneNet cloud service platform,” in 2017 IEEE Electrical Design of Advanced Packaging and Systems Symposium (EDAPS), IEEE, Shaanxi, China: 1–3, 2017, doi:10.1109/EDAPS.2017.8277059.
- S. Gokulanathan, P. Manivasagam, N. Prabu, T. Venkatesh, “GSM Based Water Quality Monitoring System Using Arduino,” Shanlax International Journal of Arts, Science and Humanities, 6(4), 22–26, 2019, doi:10.34293/sijash.v6i4.341.
No related articles were found.