
Feature Gate Computational Top-Down Model for Target Detection
Volume 5, Issue 6, Page No 1001-1006, 2020
Author’s Name: Aarthi Ramachandrana), Amudha Joseph, Shunmuga Velayutham
View Affiliations
Department of Computer Science and Engineering, Amrita School of Engineering, Amrita Vishwa Vidyapeetham, Coimbatore & Bengaluru, 560035, India
a)Author to whom correspondence should be addressed. E-mail r_aarthi@cb.amrita.edu
Adv. Sci. Technol. Eng. Syst. J. 5(6), 1001-1006 (2020); ![]() DOI: 10.25046/aj0506120
DOI: 10.25046/aj0506120
Keywords: Target search, Top-Down model, Human detection, Moving object detection

Export Citations
Computer vision is a technique used for processing images and videos which are increasingly becoming ubiquitous day by day. Technologies developed are revolving around human needs and demands high computational power as volume of data increases. The extraction of the necessary information for processing, that is independent of various scene complexity is a challenging task. Computation visual attention methods channelize a way to select the information using psychological studies on the human visual system. This work aims to develop a computational visual attention method to select the target in a scene. Feature Gate Top-Down model is proposed to filter the significant region of a target in the scene. The proposed model is extended as a choice-based system to detect target or salient movement in surveillance videos. Experimental analysis is performed on various scenes for detecting human as a target followed by the analysis on surveillance videos is evaluated. The metrics such as Kullback-Leibler divergence (KL div), Normalized Scanpath Saliency (NSS), Correlation Coefficient (CC) and similarity reveals that the proposed model is more adaptive in identifying the target region by suppressing other dominant objects.
Received: 22 August 2020, Accepted: 10 November 2020, Published Online: 08 December 2020
1. Introduction
In this era of technology, many human activities largely demand on various kind of information processing by machines. The simplifica- tion and accessibility of devices make the accumulation of data that is increasing day-by-day. Consequently, modern computing meth- ods focus on processing such voluminous data especially images and videos. The demand is to manipulate and maintain the data in an intelligent way and to extract the information whenever required. The computer vision methodologies provide a solution to the prob- lem in terms of image labelling, classification and compression etc. Many applications focus on human-centric technology especially detecting the target in the image or video for further manipulation. Target detection is a challenging problem, due to variations in natu- ral factors like background, illumination and posture of object. So the thrive for the robust target detection algorithm is continuing as an active area of research. In this work, the effectiveness of adapting visual attention technologies in target detection is proposed. Visual attention methods are derived by analyzing the behaviour of the human eye while processing the information that is in form of image or video. The computational models devised from the hypothesis of the visual system have often helped to improve and simplify the task of many vision applications. Visual attention model has been developed and studied through two approaches viz. Bottom-Up (BU) and Top-Down (TD) approach. BU approaches detects the salient region in the image and TD approaches detects the regions based on intention. As target search as intention in the scene, object may or may not be salient in the scene. Hence the proposed work is on TD computational model that identifies the significant regions of target in an image. The organization of the paper is as follows: Sec- tion 2 presents the preliminaries of the visual attention mechanism and human detection system. Section 3 proposes computational Top-Down model. Section 4 discusses experimental design and simulation results. Conclusion is given in section 5.
2. Related Work
The proposed method is demonstrated to detect the human as a target in the scene. In [1] surveyed many models that detect all mov- ing objects and classified humans using features like shape, texture etc. The state-of-the-art human detection methods were analyzed in
[2] and the advantages of each method with a guide to the choice for applications were briefly discussed. The proposed visual atten- tion techniques detect both target in the scene as well as moving object. In psychological attention theories, the BU is handled by early vision regions where the component is fast and instantaneous. There are models developed to extract BU component by extending theories and image-based techniques. Saliency detection based on regional contrast that can simultaneously evaluate global contrast differences and spatial coherence was discussed in [3]. Histogram- based Contrast(HC) method [4] was used to define saliency values for image pixels using colour statistics of the input image. The method extended to Colour Co-occurrence Histogram (CCH) that captures saliency based on location information and statistics of image pixels were composed into a visually perceivable image. It was inspired by the behaviour of the human visual system and the fact that visual attention was driven by the low-level stimulus. The images were analyzed in various resolutions, then the maps were computed on multiple low-level features like intensity, colour, orien- tation, and texture. The top-down component was highly dependent on the task, the human visual system, attention could be focused volitionally to cues determined by the current task (e.g., looking for something). In [5], the author derived the TD (Top Down) map generated using the decision tree classifier on the test date. A fuzzy rule-based system was used in [6], [7] and [8], where the feature is used for the specific image property (Intentional features) in- troduced in fuzzy inference system on learned features. A Visual Attention System for Object Detection and Goal-Directed Search (VOCUS) [9] model derived the TD map by tuning the features of the target region in the map. The weights were calculated from the ratio of mean value between the Region of Interest (RoI) and the surrounding region. The contextual information of the object was used in many works as TD component. The method in [10] method used spatial information on global context information to detect the target. The gist of the scene was determined to categorize as indoor and outdoor and to perform the task based on that. In [11] learned the behaviour of human eye fixations while playing a video game mapped to scene as TD model. Natural Language Processing (NLP) and then interfaced with vision using Language Perceptional Trans- lator (LPT) for parsing the sentence and to extract the corresponding properties of an object like location, colour, size and shape for the object. Few features that influence the visual search task were con- text, features and background [12]. Context was unimportant for the detection of human due to its dynamic behaviour in surveillance scenes. Features that are highly related to the target was elicited other than the distractor feature. Brain system had functional areas as a pre-attentive stage where the parallel processing of basic vi- sual cues were performed and subsequently followed by the region where complex-operation such as recognition was performed [13]. In Top-Down model the location that satisfied the target features from inhibiting the other distracting region was favoured. Boolean map model [14] divided the region as selected and not selected by sequentially producing Boolean map considering one feature at a time. It combined the result of one feature that becomes the input for searching the other feature. The main contribution of this work is the development of computational visual attention method to select the target in a scene. We have proposed a model namely feature gate model using biological theories, that makes use of the influence of target features and integrates the distinctive features for filtering the target. Then the model is extended to video by integrating with moving object detection algorithm. The method is analysed with map generated without intention and prominence of a target concerning surrounding environment complexity. The proposed method is also compared with other existing models to evaluates its performance.
3. Feature Gate Top Down Model
Feature gate model [15], terms derived from visual attention system as gate control the flow of information from each level of the hierar- chy to the next. The gating of each location depends on the features present. It is a fast and efficient method for inhibiting distractor locations in the search task. The specific aim of the work is:
- Implement the Feature Gate model concept for effective feature combination of target
- Evaluating the influence of pre-learned feature extending to video The results are analysed for visual target search appli- cation, where the choice for selecting the target region in frames is also included.
The system architecture is presented in Figure 1. The sequence of ‘k’ frames(fr) from fri−k, fri−k+1,. . . fri are considered to be en- titled as processed in the system. The ith frame (fri) in the video sequence is considered for finding static TD map. The low-level features like colour, orientation and intensity are tuned to pops out
the target or salient region as static map. The proposed Feature Gate Top-Down model (FGTD) is discussed in subsection 3.1 and pop out the probable location of the target(human) as TD map. The ’k’ frames are used for finding the potential region of moving target in the scene by entropy-based moving object detection discussed in section 3.2. The saliency map is calculated from low-level feature by procedure discussed in [16]. The model has the flexibility to select a specific target in the video or it can detect the potential salient moving object. Hence, the weights Wm and Ws is help to increase or decrease the proposition of selecting the target. The final map generated as discussed in subsection 3.3.
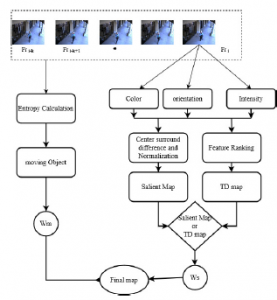
Figure 1: Overview of Proposed model
3.1 TD Map Generation
The human brain fires the neurons based on the task that need to be coordinated. In case of developing a TD model, it requires to enable the relevant low-level feature information. The feature re- lated and necessary for the target passes through the open gate and other features are inhibited by the closed gate. The features that are passed through the open gate will be kept in the output and others are restricted from appearing in the output. Some of the pre-defined set of local features are learned in the model. Color, intensity, and orientation play a significant role in determining the salient regions in images. The architecture for FGTD model is given in Figure 2. The details of the target and environment to be searched are given as input to the system. The visual feature and salient features are considered for evaluation of TD Information. These features are well suited for target search concerning various background. Features are expressed as a feature map and then com- bined to form conspicuity maps. Feature map is mapped to form a sub-conspicuity map. The features are learned from low-level features in different scales. The input image is broken down into intensity, colour and orientation maps. Four broadly-tuned color channels Red(R), Green(G), Blue(B) and Yellow(Y) are created. Gaussian pyramids R(s), G(s), B(s), and Y(s) are created from these four colour channels. Centre-surround differences (Θ) between a “centre” fine-scale c and a “surround” coarser scale s yield the fea- ture maps as represented in equation 1. Scales are obtained from pyramid with center c= 2,3,4 and surround scale S= 3,4 . Feature maps across color, orientation and intensity are computed using Itti model [16]. Conspicuity feature map of intensity, color opponent as Red-Green (RG) in (1) and orientation in (2) of target region are also calculated. Three-level orientation feature for θ= 0◦,45◦,90◦,135◦ of target region are calculated. Gabor filter is used to obtain differ- ent orientation features. The mean of features is extracted from the selected target region of the image to create training samples.

Figure 2: Architecture of FGTD map generation
In the learning phase, each feature is observed across different environments. The proposed FGTD Model combines the few rele- vant feature of the target as selecting weight as ‘1’ (open) and other as weight ‘0’(close). Thus the features that are relevant to object are given uniform weightage and irrelevant features are removed. The target-specific local features are learned and used as cues while searching. The details of the target as features are given as training
data to the system. The target features are learned and stored based on the dominancy as TD Information. Relief algorithm[17] is a successful attribute ranking method, which has been well studied and adopted for classification problems. The experimental analysis is performed by having the target as human in various scene from other background region. The mean value of the features are used to classify target from non-target. The algorithm used in this method is proposed in [17] as ReliefF to rank the features. Rather than single hit and miss while detection, the approach relies on parameter k that specifies the use of k-nearest hits and misses in the scoring update for each target instance. The features rank and weights are calculated based on scores. TD map has been generated based on combining the first ‘n’ ranked features. There are mathematical operations for combining the feature map. The summation is used to combine the feature from TD candidate map. Further the TD map on static images is combined with movie object map to extend to videos.
3.2 Moving Object Map
Visual saliency helps the human brain to select the most salient region in real-time. In human vision system apart from the static salient region, the moving object attracts attention in a sequence of images. To extend the method for video analysis, motion is an added feature required to process by analyzing the set of sequence of images, which gives moving object map. The map is obtained by the method in [18] that uses entropy calculation to detect the moving object map from every instance. It also eliminates the background noise like the movement of the tree, flag, elevator, fan, etc based on processing location information. The same proce- dure adopted to detect the moving object map(M) is given below,
Input:‘k’ successive frames(fr) in the video (fri−k, fri−k+1………… fri)
Output:Detection of moving object in ith frame as ’M’.
Step 1: Convert f ri to gray scale and quantize into ‘L’ levels. Step 2: Normalize the frame to the range [0, L-1].
Step 3: Calculate entropy by designing probability mass function for ‘k’ frames.
Step 3.1: Obtain the histogram integer values.
Step 3.2: Let R(x, y) is a local region in coordinate (x, y). The information content M(x,y) is calculated as (3)
M(x, y) = p(R(x, y), k)log2 p(R(x, y), k) (3)
∀k
Step 3.3: Eliminate the static elements by analyzing M(x, y).
Step 4: Continue the step 1 to 3.3 for the entire video sequence.
3.3 Final Map Generation
Regions related to TD Knowledge have higher saliency value than other regions. The contribution of features in the field is not uni- form and its weights are varied between the targets. Assigning the appropriate weight to the feature channel pops out the target region. The weights help to determine the amount of feature that
Table 1: Metrics used for analysis
| Evaluation method | Equation | Significance of value |
|
Similarity: closeness between maps ground truth S h(i) and predicted values S s(i) |
n X min(S s(i) − S h(i)))) i=1 |
‘1’ determines the results are same; 0 de- picts it is different |
|
Normalized Scan path Saliency (NSS): Average response value of human eye po- sition in a model’s saliency map |
n i i NS S = 1 X S (xh, yh) − µs n i=1 σs |
Score>1 saliency map shows significantly higher value than the human fixated location map |
|
Kullback–Leibler(KL) Div.: KL diver- gence predicts the distance Between two distribution S(x) and h(x). |
D(s, h) = X s(x)log s(x) x h(x) |
It is non negative value, the score is 0 if distribution s=h |
|
Correlation Coefficient (CC): Mea- sures the strength of linear relationship between the model and human saliency map |
D(s, h) = X s(x)log s(x) x h(x) |
CC varies between -1 to 1. Positive values shows the better correlation in prediction than -ve values |
Table 2: The Ranking of features by ReliefF
| Features | R | G | B | Y | I | RG | GR | BY | YB | 0◦ | 45◦ | 90◦ | 135◦ |
| Ranking | 10 | 8 | 6 | 12 | 13 | 11 | 3 | 1 | 9 | 4 | 5 | 2 | 7 |
helps to separate the target region from other regions. In this work, weights for moving object map (Wm) and static map (Ws) is used to fine-tune the result. Each intermediate feature map is multiplied by its corresponding weight to form the final map as in (4). The weight stands for the amount of information that is decided based on the required property on output. The weight can be within the range of [0-1], and according to the probability theory the sum of weight is ‘1’. To summarize, the FGTD model that uses biological inference to select the salient location of target pixels is given by,
Finalmap = Wm ∗ (M) + Ws ∗ (BUorTDMap) (4)
4. Results and Discussion
In this section the experiments done on proposed FGTD model on static images followed by combining it with movie object map is dis- cussed. The dataset is taken from various sources on internet having the target with different illumination and scale complexities. Exper- iments are done with the aim to find the influence of TD knowledge compared with map generated by without intention. The application of computer vision domain namely human detection having target as human are evaluated using metrics like similarity, NSS, KLdiv and CC of visual attention models. In Table 1, S (xi , yi ) saliency features discussed in section 3.1 are learned, and relief method is used to rank the features. The ranking of features for human as target is given in Table 2. The TD map is generated for test image by combining first ‘5’ features according to ranking starting from Blue-Yellow(BY), orientation 90◦ e.t.c. The sample result obtained for 6 images are presented in Figure 3. The first column shows test image and second column gives the result map without intention [16]. The result obtained by proposed FGTD is highlighted with red color square box and finally the expected target region is highlighted with red color oval shape. value of human fixation at ith position, mean µs and variance σs of saliency region, Cov(s,h) covariance of saliency(s) and human map(h). In Figure 3 gives the comparison of FGTD with BU Map. First Column is input image, followed by result obtained by BU model and proposed FGTD model and region of human target in the scene.
The FGTD model in section 3.1 is evaluated to detect the human target with dataset consisting of more than 200 images that were collected under varying illumination, scale and background.

Figure 3: Comparison of FGTD with BU Map
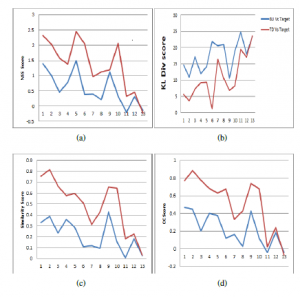
Figure 4: Performance Analysis of FGTD model with map[16](a)NSS, (b)KL div,(c)Similarity and (d) CC , where X-Axis in the graph images arranged according to the background clutter
A comparison between Map [16] and FGTD Map with target has been carried out to measure how the model helps to pop out the relevant region as it decreases in prominence in image. Hence the performance is compared with human perception without in- tention measures like similarity, Normalized Scan path Saliency (NSS), KL div and Correlation Coefficient (CC) in Table 1 used for analysis. Hundreds of image samples were collected under various environments, illumination and scaling conditions. In Figure 4, KL Div score is minimized in the variation of 0 10. NSS, CC and similarity score is maximized compared with map[16] Model. The scores improved especially in case of target in cluttered background. Observation shows that FGTD model helps to move closer to target region even if it uses minimum feature of the target object to filter out the irrelevant information from image. But, it shows similar performance of saliency map when the entire test image has the same feature as target. In Figure 4 the performance Analysis of FGTD model with map[16] metrics are compared with NSS, KL div, Similarity and CC, where the X-Axis in the graph is the image samples arranged according to the background clutter.
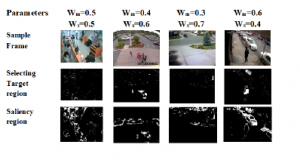
Figure 5: Comparison of BU model with TD map where First row weight parameters are given,second row has TD map with moving target and third row has BU map combined with Moving target
Hence the background distraction is minimum in indoor scene, the outdoor scene sample are highlighted. The first column rep- resents an indoor scene, where other represent outdoor scene. In order to analyze the result, the result by selecting as human region (TD map) and saliency region (without intention) are presented. A comparison with Map [16] and FGTD Map with target Evaluated by factors prescribed in Table 1 are presented in Figure 6. Performance Analysis of proposed model with map[16] of NSS, KL div, Simi- larity and CC is represented. The X-Axis in the graph has samples arranged based on increasing complexity of scene.
The static map is further combined with moving object map to extend in video. The dataset consists more than 100 video clips collected from surveillance video of varying outdoor and indoor scene. The model can select Most Salient Region (MSR) as human or it can directly consider as salient region by BU model. The impact of selection between TD Map or salient map are analyzed by varying the weight parameter Wm and Ws are represented in Figure 5. The result obtained for indoor and outdoor scene with and without human presences are evaluated. The sample results obtained for 6 video frames are presented in Figure 5.

Figure 6: Performance Analysis of proposed model with map[16] (a)NSS, (b)KL div,(c)Similarity and (d) CC , where the X-Axis in the graph has samples arranged on increasing complexity of scene
In Figure 6, KL Div Score is minimized in the variation of 0.2
NSS, Similarity and CC Score is maximized in the variation of 0.02 1. The score shows reliable performance even in case of moving object that is not salient. The model is also compared with moving object detection algorithms like optical flow [19] and dynamic background subtraction [20] methods. The existing algo- rithm detects all the movie objects in the scene. So, the evaluation is performed on the scene where the pedestrians or vehicle is present in the video. The analysis done more than 30 video sequence with frame rate of 30 to 45 frames per second. The average pedestrians speed varied from 3 km/hour to 5 km/hour and vehicle speed in the video varied from 40 km/hour to 80 km/hour. The performance metrics like True Positive Rate(TPR), False Positive Rate(FPR), True Negative Rate(TNR) and False Negative Rate(FNR) are listed in Table 3. It gives the average detection rates on all video clips. The proposed model shows better performance in compared with other methods.
Table 3: Comparison of FGTD method with existing techniques
| Model | TPR | FPR | TNR | FNR |
|
Optical flow method |
80.56 % | 15.11 % | 82.89 % | 17.44 % |
|
Background Subtraction method |
69.19 % | 15.75 % | 82.25 % | 32.81 % |
|
Proposed Model |
85.75 % | 73.19 % | 26.81 % | 24.25 % |
5. Conclusion
The main contribution of this work is a TD model that binds the low- level features and pops out the target region. The FGTD model com- bines the features-based rank order derived by relief method. Further the model is combined with moving object map for analysing the performance in video processing. The weight based final map gen- eration provides the significance of weight modulation in region detection. The method is evaluated with the computer vision prob- lem to detect a human in a scene. The procedure has been extended to detect the target in videos and compared with existing methods. As compared with the scene perceived without intention, the pro- posed approach shows the capability of suppressing the dominant region of the image to pop out the target. The methods can be further extended to detect different targets in a real-world scene. It can be further extended to simultaneously detect multiple targets in the scene. The features like depth and texture can be included for better robotic navigation in the scenarios.
Conflict of Interest
The authors declare no conflict of interest.
- M. Paul, S. M. Haque, S. Chakraborty, “Human detection in surveillance videos and its applications – a review,” 2013, doi:10.1186/1687-6180-2013-176.
- D. T. Nguyen, W. Li, P. O. Ogunbona, “Human detection from images and videos: A survey,” Pattern Recognition, 2016, doi:10.1016/j.patcog.2015.08. 027.
- M. M. Cheng, N. J. Mitra, X. Huang, P. H. Torr, S. M. Hu, “Global contrast based salient region detection,” IEEE Transactions on Pattern Analysis and Machine Intelligence, 2015, doi:10.1109/TPAMI.2014.2345401.
- S. Lu, J. H. Lim, “Saliency modeling from image histograms,” in Lecture Notes in Computer Science (including subseries Lecture Notes in Artifi- cial Intelligence and Lecture Notes in Bioinformatics), 2012, doi:10.1007/ 978-3-642-33786-4 24.
- S. Amudha.J, “A Knowledge Driven Computational Visual Attention Model,” International Journal of Computer Science Issues, 2011.
- E.M. De Almeida Neves, J. E. Borelli, A. Gonzaga, “Target search by bottom- up and top-down fuzzy information,” in Brazilian Symposium of Computer Graphic and Image Processing, 2000, doi:10.1109/SIBGRA.2000.883895.
- J. Amudha, K. V. Divya, R. Aarthi, “A fuzzy based system for target search using top-down visual attention,” in Journal of Intelligent and Fuzzy Systems, 2020, doi:10.3233/JIFS-179712.
- W. S. Lin, Y. W. Huang, “Intention-oriented computational visual attention model for learning and seeking image content,” in 2009 4th IEEE Confer- ence on Industrial Electronics and Applications, ICIEA 2009, 2009, doi: 10.1109/ICIEA.2009.5138402.
- S. Frintrop, “VOCUS: A visual attention system for object detection and goal- directed search,” Lecture Notes in Computer Science (including subseries Lecture Notes in Artificial Intelligence and Lecture Notes in Bioinformatics), 2006.
- N. Bergboer, E. Postma, J. Van Den Herik, “A context-based model of attention,” in Frontiers in Artificial Intelligence and Applications, 2004.
- R. J. Peters, L. Itti, “Beyond bottom-up: Incorporating task-dependent influ- ences into a computational model of spatial attention,” in Proceedings of the IEEE Computer Society Conference on Computer Vision and Pattern Recogni- tion, 2007, doi:10.1109/CVPR.2007.383337.
- J. Amudha, R. K. Chadalawada, V. Subashini, B. Barath Kumar, “Optimised computational visual attention model for robotic cognition,” in Advances in In- telligent Systems and Computing, 2013, doi:10.1007/978-3-642-32063-7 27.
- A. M. Treisman, G. Gelade, “A feature-integration theory of attention,” Cogni- tive Psychology, 1980, doi:10.1016/0010-0285(80)90005-5.
- J. Zhang, S. Sclaroff, “Saliency detection: A boolean map approach,” in Pro- ceedings of the IEEE International Conference on Computer Vision, 2013, doi:10.1109/ICCV.2013.26.
- K. R. Cave, M. S. Kim, N. P. Bichot, K. V. Sobel, “The feature gate model of visual selection,” in Neurobiology of Attention, 2005, doi:10.1016/ B978-012375731-9/50094-X.
- L. Itti, C. Koch, E. Niebur, “A model of saliency-based visual attention for rapid scene analysis,” IEEE Transactions on Pattern Analysis and Machine Intelligence, 1998, doi:10.1109/34.730558.
- R. J. Urbanowicz, M. Meeker, W. La Cava, R. S. Olson, J. H. Moore, “Relief- based feature selection: Introduction and review,” 2018, doi:10.1016/j.jbi.2018. 07.014.
- R. Aarthi, J. Amudha, K. Boomika, A. Varrier, “Detection of Moving Objects in Surveillance Video by Integrating Bottom-up Approach with Knowledge
- S. M. Shilpa, Prathap H.L, “A Survey on Object Detection and Tracking Methods,” International Journal of Innovative Research in Computer and Com- munication Engineering, 2014.
- R. D. Sharma, S. L. Agrwal, S. K. Gupta, A. Prajapati, “Optimized dynamic background subtraction technique for moving object detection and tracking,” in 2nd nternational Conference on Telecommunication and Networks, TEL-NET 2017, 2018, doi:10.1109/TEL-NET.2017.8343526.