
Investigation of the Effect of FBG Profiles, Temperature and Transmission Distance for Environmental Sensing & Monitoring
Volume 5, Issue 6, Page No 912-919, 2020
Author’s Name: Muhammad Arif Riza, Yun Ii Goa)
View Affiliations
School of Engineering and Physical Sciences, Heriot-Watt University Malaysia, Putrajaya, 62200, Malaysia
a)Author to whom correspondence should be addressed. E-mail: y.go@hw.ac.uk
Adv. Sci. Technol. Eng. Syst. J. 5(6), 912-919 (2020); ![]() DOI: 10.25046/aj0506108
DOI: 10.25046/aj0506108
Keywords: Apodization, Environmental, FBG, Sensor, Simulation, Temperature

Export Citations
Optical sensors exist in various forms and one of them is fiber bragg gratings (FBG). Performance evaluation was simulated for FBG sensing. The simulation involves different grating profiles tested with complete optical sensing system. The system involves a broadband light source, FBG of various profiles and optical spectrum analyser for data interpretation. Different profile of gratings imprinted on an FBG outputs wavelength spectra and simulated results satisfy this theory obtained from literatures. Temperature sensing was also simulated for the FBG at various temperature ranges that suit different industrial demands. At low temperatures FBG does give fairly noticeable sensing capabilities. When reaching 400C and above, the FBG was still capable of providing response, however when in real environments the fiber may suffer from thermal damage. FBG performance when integrated within a system with long distances of fibers were also simulated. Power attenuation was noticed at the reflectivity spectra.
Received: 29 August 2020, Accepted: 19 November 2020, Published Online: 08 December 2020
1. Introduction
This paper is an extension of work originally presented in “IEEE International Conference on Sensors and Nanotechnology 2019” [1]. Environmental monitoring have been a main topic in most fields of study. Conventional sensors nowadays such as microelectronic mechanical sensors (MEMS) or probe sensors are vulnerable to electromagnetic (EM) interference and wiring complications. This phenomena prevents its use in long-range sensing applications [2]. Fiber optic sensors is a promising alternative to conventional sensors due to its compact nature, EM proofing and multiplexing capabilities [3]. The simplicity of optical based sensors allows various sensing configurations such as absorption based sensors (interferometers) and grating based sensors. Fiber Bragg Grating (FBG) sensor is an example of an optical sensor that operates by creating a periodic perturbation of light signals within the refractive index of its core. The gratings serves as wavelength filter that permits only light with wavelengths that dissatisfy the Bragg’s equation to permeate through while the light waves that satisfy the Bragg equation will be reflected back. Therefore, strains acting on the gratings with a set periodicity can induce a shift in the wavelength spectra. The shift in wavelength defines the condition of the parameter being sensed [4]. Commonly, FBG sensors are used for pressure and thermal sensing. However, FBG sensors can be modified to sense other forms of parameter such as humidity by introducing a sensitive coatings onto the sensitized regions of the sensor.
Operations of FBG sensors require a source of propagated broadband light. In some cases, FBG sensors are positioned in remote areas where power input availability is scarce. Normally, the light source are powered by conventional batteries which could have a short lifespan and can be inconvenient maintenance wise. Hence, a sustainable power source is desired. A promising source of green energy is from ambient vibrations within the earth’s crust [5]. The concept of vibration energy harvesting involves converting amplified vibrations at resonance into useful electrical power by means of kinetic energy distribution. Ambient vibration frequencies generally fall below 100.0 Hz. However, in civil structures, the frequency can drop to less than 10.0 Hz [6]. The acceleration level of these vibrations are very low being less than 1.0 g where g = 9.81 ms-2, making it more suitable for low-power electronic application such as powering a light source.
This paper focuses on reporting simulated results of FBG tested with various different grating profiles, temperature sensing and transmission distance. Whilst simulating the FBG in different grating configurations, basis of the system which will be explained further sections will be tailored to a vibrational energy harvester power output. Since the proposed harvester design provides a low but steady power output to act as a light source, the whole FBG system will be run under low power to be simulated within various conditions including thermal and attenuation. It is an opportunity to simulate how well the system of FBG can be run with sufficient power with different types of gratings which differs from most other closely similar articles involving FBG simulation [7-9].
1.1. Optical vs Conventional Sensor
Environment sensors that are still in use comes in various types. Electrical based sensor types such as the resistive probes, p-n junction diodes and MEMS sensors have been the staple sensor devices used over the years in monitoring various parameters [10]. Some sensors that have a very low power consumption of <1.0 mW and are made to be self-sustained by equipping the sensor with a solar panel harvester [11]. However, the operation these conventional sensors require electrical flow on the active sensitized regions of the sensor. This will render the sensors to be susceptible to electromagnetic interference and damage due to short circuit. Besides having a high maintenance cost, the complexity of the sensing mechanism in electrical based sensors available in market limits its capability to be embedded within a structure [12]. These drawbacks propel researchers to find alternatives such as optical fiber sensors.
Optical sensors alone can have many different configurations based on how the modification is formed on the surface, cladding, core or tip of the fiber. In addition to FBG sensors, other optical sensors include interferometers and absorption based sensors, which function based on the principal of the energy absorption spectrum and refractive index changes. However, grating based sensors possess an advantage over other optical based sensors in terms that they are more compact and ease of modification. In addition, FBG sensors have low noise, high sensitivity and a high multiplexing imprint capabilities via phase masking, which helps provide a large mapped sensing area within an environment [13].
1.2. FBG Sensing Principle
FBG are made typically from phase masking, where periodic modulations of the refractive index are imprinted within the fiber core by intense UV laser, exposed perpendicularly to a single mode optical fiber. The modulated refractive indexes within the fiber core that has different refractive index values than the core and cladding acts as the wavelength filter for the incident propagated light. Based on Figure 1, light signals at wavelengths other than the Bragg wavelength would pass through whereas light signals with wavelength equal to the Bragg wavelength that would be reflected back. Therefore, the transmitted ray that passes the grating will have the Bragg wavelength absent in the main spectrum [14]. FBGs can be serially imprinted into one fiber at multiple sensitized regions (multiplexing). This allows the FBGs to have multiple functional sensor nodes along a fiber length which is essential for area mapping.
On their own, FBGs are strain, pressure and temperature sensitive. In temperature sensing, different temperatures would impose axial strain upon the FBG fiber based on coefficient of thermal expansion of the FBG material (which would normally be silica). This would cause a change in the pattern spectrum of the reflected light, resulting in a shift in the reflected wavelength. This shift in wavelength can be calibrated to identify temperature change [15]. Detection of non-physical parameters requires the FBG to be modified by coating the sensitized region with a reversibly reactive material nanostructures that can induce mechanical strain or reaction to the FBG when exposed to a measurand [16]. Generally, it is possible for a FBGs to sense chemical parameters such as salinity concentration [8], chemical gas concentration [17] and relative humidity of the environment [18]. Ease of modification of FBG to suit various environmental sensing applications makes FBG a viable sensing device to be studied and optimized.

Figure 1: Principle of FBG.
2. Methodology
In this study, the behaviour of FBG fiber is simulated with different grating profiles. Different grating profiles can have an effect to the output transmission and reflectivity of the fibers. The behaviour of the FBG as a temperature sensor are simulated in temperature ranges that relates to certain industries. Connection of fibers in a long range fiber setup are also simulated to show the viability of FBG sensor array assembly in a long-range network.
2.1. Overall System Description
FBG sensors typically involve several components to be available for environmental monitoring. The following subsections explain each of the components in Figure 2 that are mandatory for FBG sensor implementation. Table 1 presents the constant parameters used in this study.
Table 1: System Setting.
| Source Spec. | Optical Fibers | FBG Spec. | OSA Spec. |
|
Broadband white light source
Frequency: 193.1 THz
Power: 130 dBM |
Silica SMF
Length: 10 cm |
Grating profile: Uniform
Bragg wavelength: 1550 nm
IM: 0.0002
|
Resolution: 0.001 nm |
2.2. Source
Optical based devices require sources in form of propagated photons. Light source of broad spectrum is preferred when using FBG. Broad spectrum light source examples include white light source, amplified spontaneous emission (ASE) source and broadband light source.

Figure 2: Arrangement of FBG setting.
These sources typically propagate light of wavelength ranges that cover the Bragg’s wavelength of the FBG. Perturbed Bragg gratings in a fiber will show wavelength shifts, therefore for sources that only provide photons at single or very short wavelength may not be affective for use with FBG sensor system. For this system, a default white light source was used with 130 dBm power and it is kept constant throughout the simulation.
2.3. FBG
The FBG component is the main component in the simulation that has variables manipulated. The Bragg grating wavelength chosen is 1550 nm since it is among the commonly used wavelength for FBG sensing. The grating length of fiber is set constant at 10 mm throughout the study. Index modulation is set at 0.0002 for the FBG and is also a controlled parameter. The grating profile will be varied in order to observe the effects of different grating profiles on the transmission and reflectivity spectra in the simulation.
2.4. OSA
Optical spectrum analyser or optical receiver is mandatory for any optical based sensors including FBG as it detects the incoming light propagation. The optical receiver then sends the received light signals to be converted into readable data. In lab-based study, OSA typically combine these functions of receiving and signal conversion into transmission and reflectivity spectrum. The OSA settings used in this simulation is with resolution of 0.001 m. The resolution value allows for more data points to be recorded brings more accurate results.
3. Results and Discussion
3.1. Effect of Grating Profiles
There are many different grating profiles of an FBG. These grating profiles may affect the spectrum of both the transmission and reflectivity. The grating profiles are made different with the periods or arrangement of the grating follows different model. Different phase mask can be used for the imprinting of different grating profiles. In this study, Uniform grating along with several other grating profiles is tested.
3.1.1. Uniform Profile
Uniform grating profiles is the most common imprinted FBG profiles that has seen its use in sensing. The uniform periodicity profile affects light modulation and follows the Braggs equation which is:
![]()
where, λB is the Bragg wavelength, ???? is the refractive index of the propagating light and ΛG is the index modulation periodicity [19]. In this study, light modulation across a uniform profile FBG has been simulated. In Figure 3 transmission and reflectivity of light propagated pass the profiles has been recorded. As predicted, the response have showed that the peak power exists on the 1550 nm wavelength. This is the wavelength at which the grating was imprinted on. Figure 2(a) showed the transmission power trough occurring and on Figure 2(b), reflectivity spectra showed peaks at the same Bragg wavelength. This simulation has demonstrated the regular uniform FBG profiles connected with regular power source. There appears to be minor side lobes occurring on Figure 2(b). These side lobes may not be favourable for FBG sensors that are tailored for high precision sensing. However, the side lobes does not hinder the uniform profiles from entering the market as region or array monitoring system.
3.1.2. Chirped Profile
A different profile than the typical uniform profile of FBG is the chirped FBG. The gratings in a chirped FBG varies in terms of periodicity along the grated regions depending on the chirp pattern on the phase mask. This produces spectrums that are different than the original, uniform and non-apodized FBGs. The wavelength spectrums produced via chirped FBGs are much broader than uniform profiled FBGs which can range between several nanometers or even thousands of nanometers depending on the chirp rate, grating length and phase mask used for writing the FBG in a fiber [20].
Based on Figure 4, chirped FBG with uniform apodization and follows similar Bragg wavelength, index modulation and grating length as table 1, has been simulated. It was seen that both Figure 4(a) and Figure 4(b) showed broader spectrum that uniform FBG. No shifts of transmission peaks and reflectivity troughs was seen which is expected. The breadth of the peaks is observed to be approximately 4 nm. Both transmission power and reflectivity shows no deterioration when chirp profile is applied without altering other parameters. Figure 4 has successfully demonstrated a chirp profile via simulation that satisfy with other studies [21, 22]. While having wider Bragg peaks in both reflectivity and transmission, chirped FBGs can have certain suitable purposes. However, if high accuracy detection is preferred, chirped FBG may not be the best grating profile to be utilised. This is due to small shifts that occur upon detection may not be visible or detected and could lead to misinterpretation at the end signal-to-data conversion.
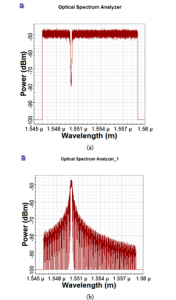
Figure 3: Optical power spectrum of uniform FBG (a) Transmission and (b) Reflectance.

Figure 4: Optical power spectrum of linear chirped FBG (a) Transmission and (b) Reflectivity.

Figure 5: Optical power spectrum of Gaussian apodized FBG (a) Transmission and (b) Reflectivity.
3.1.3. Gaussian Apodized Profile
Another variant of FBG profile other than chirped and uniform are apodized FBGs. These FBGs differ in terms of the way the gratings are imprinted on to the fiber. They are written in a manner that the grating intensities gradually change along the grated region until it becomes similar to the rest of the fiber. Specifically, in gausian apodized FBG, the grating intensity change along the grating length follows Gaussian modelling variant of the original Bragg wavelength equation. The emergence of this type of grating profile serves to reduce side lobes that may appear on uniform grated FBG [8]. Apodized FBG are also known to result in more narrow peaks of both reflectivity and transmission spectra. Besides gaussian model for index modulation and grating intensity determination, other models include Nuttal model and Pi (π) apodized model [23].
In this study, Gaussian apodized profile was simulated based on table 1 properties of the FBG. Figure 5 shows the simulated transmission and reflectivity spectra of the aforementioned FBG. Side lobe reduction occured and is observable on both of the spectra when compared to a uniform FBG. The peaks reflectivity and transmission trough are slightly narrower if compared with uniform profiles. Reflectivity and transmission power however, does suffer loss of ~10 dbm in comparison with uniform profile FBG. With the presence of side lobe reduction and narrow Bragg peak, utilization of apodized FBG is favourable for accurate sensing. Even though Gaussian apodized FBG may have lower side lobe appearance and narrow peaks, the low transmission power may be a hindrance if the FBG system is to take part in longer distances.
3.2. Effect of Temperature with FBG
FBG type sensors are used in wide variety of temperature ranges depending on the type of industries that utilize it. Simulation of FBG in different range of temperatures is shown on Figure 6. When used in oceanography for monitoring ocean temperatures, a sensor should be at least sensitive at temperature ranges of 10˚C [24]. This posed no problem for FBG sensors array as simulated in Figure 6. At higher than ambient temperatures of around 60˚C, A notable shift of the spectrum from its original wavelength of 1550 nm is detectable. At the said temperature, is observed when an FBG sensor is used in conjunction of a surgical tool to ablate cancer cells [25]. Upon higher temperature use for nuclear reactor temperature monitoring, an FBG may require modifications or special temperature proof casing. As mentioned by Mohamed, et al. [26], temperatures can reach up to 1600˚C. When using normal SMF made of silica, melting point of 400C should be taken into account. This limits the use of FBG if it is grated within a standard SMF down to only ~380˚C. While 390-400˚C is still possible to simulate, in reality, engineering constraints have to be considered for safety.

Figure 6: Optical power Spectra of FBG when exposed to various temperatures (a) Transmission and (b) Reflectivity.
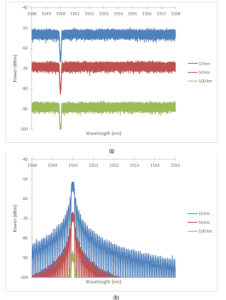
Figure 7: Spectra of FBG utilized within various system distance (a) Transmission spectra. (b) Reflectivity spectra.
3.3. Effect of Transmission Power and Distance
Transmission power is at its ideal value when it is simulated or close to its ideal value when tested within lab scale lengths (<1m). When incorporating FBG within an array where the source is further than 1km in distance, power attenuation will occur. The reason for simulating this is to show that at what distance will the transmission and reflected power will deteriorate. The chosen length was based on different uses in the industry. At a distance of 10 km chosen due to most small and medium industries or premises require this distance of FBG array for environment monitoring [27]. For larger area coverage such as land and oceanic surveying applications, 50 km distance may be favourable therefore it is chosen as one of the simulation parameter for fiber distance [28]. For remote sensing in rural areas where the source and signal receiver has to be far from the area of monitoring due to power source availability, may require fiber length of up to 100 km.
Figure 7 (a) and (b) are the spectra of FBG sensor simulated within an optical circuit over various distances. The FBG used for simulation is a uniform profile variant due to it being the most stable in terms of providing low power loss due to attenuation. Furthermore, uniform FBGs are much easier to mass produce due to uniform phase mask availability. Within 10 km distance, there are hardly any power loss for both reflectivity and transmission spectra as shown on Figure 7 (a) and (b). Reflectivity on Figure 7 (b) shown significant attenuation power loss when distance of FBG optical circuit is extended to distances of 50 km and 100 km. Transmission spectra in Figure 6 (a) shown a minimal and slightly noticeable power loss. This is due to that reflected power may experience loss when reflected by the Bragg gratings due to leakage of evanescent waves occurring on FBG grated regions.
3.4. Sustainable Power Source
In environmental sensing, it is essential for light sources of sensors to have stable power input and output. While access to power may be available in established areas and urban environments, some other areas may not connected to main power grid. To remedy this issue, a light source powered by sustainable and renewable energy is favoured. A good candidate for powering light source can be a vibrational sensor which rely on the continuous minute vibration of the earth’s crust [1]. In powering light source for optical sensing applications, at least 25 – 50 mW power is required. Vibrational sensors that can resonate with frequencies of <10 Hz at acceleration level (g) by <1.0 can supply enough power to FBG sensors [1]. To achieve this, vibrational sensor proposed within our previous paper [1] was equipped with rectangular clamp-free cantilever beams with attached magnet at the tips. The magnets will vibrate at the low acceleration level causing change in magnetic flux and inducing voltage in the coil. This in turn can produce electrical DC power which can be use with various low power consumption devices. By having a renewable energy source powering the FBG sensors, environmental condition mapping in remote locations is possible.
4. Conclusion and Recommendation
Several forms of FBG grating profiles has been reported via simulation of its transmission and reflectivity spectra. Temperature sensing of FBG has been simulated at various temperatures that are used in different industries ranging from as low as 10˚C to as high as 400˚C. Higher temperatures of >400˚C may require modifications that protects the FBG thermally and mechanically for certain rough applications such as monitoring greater nuclear reactor or volcanic core. When used within a high distance optical circuit, reflectivity was seen to suffer greatly with increasing distance and nearly not usable at distances spanning >100 km. Therefore, it is advisable to rely on remote optical source that is powered by renewable energy source within a FBG sensing system or array that spans greater distances. Multiple FBG of 50 km length should be optimal for use with one remote optical source. For greater coverage, multiple system of FBG and power source each with only 50 km distances between each other may be required for monitoring over a very large area. Furthermore, when an independent and self-powering optical broadband source is used, more remote areas can be monitored such as in vast open seas or subterranean regions. It has been demonstrated that FBG sensor can is capable to operate in power as low as 130 dBm but still maintains proper functions as shown in the obtained results. Although power loss due attenuation was apparent, it does not limit the sensing capability of the FBG to other environmental parameters such as temperature to some extent. This paper provided performance evaluation for FBG of various grating profiles and satisfied the theory of each grating performance.
Conflict of Interest
The authors declare no conflict of interest.
Acknowledgement
The funding provider of this study is the Ministry of Higher Education Malaysia under the Fundamental Research Grant Scheme (FRGS), No. FRGS/1/2018/TK10/HWUM/02/2.
- M. A. Riza, F. M. Foong, Y. I. Go, C. K. Thein, “Development of Sustainable FBG Sensor for Environmental Monitoring Through Vibration Energy Harvesting,” in 2019 IEEE International Conference on Sensors and Nanotechnology,1-4,2019,doi: 10.1109/SENSORSNANO44414.2019.8940082.
- M. Amanzadeh, S. M. Aminossadati, M. S. Kizil, A. D. Rakić, “Recent developments in fibre optic shape sensing,” Measurement, 128, 119-137, 2018, doi: 10.1016/j.measurement.2018.06.034.
- H. Ahmad, M. T. Rahman, S. N. A. Sakeh, M. Z. A. Razak, M. Z. Zulkifli, “Humidity sensor based on microfiber resonator with reduced graphene oxide,” Optik, 127(5), 3158-3161, 2016, doi: 10.1016/j.ijleo.2015.11.184.
- X. Jin, S. Yuan, J. Chen, “On crack propagation monitoring by using reflection spectra of AFBG and UFBG sensors,” Sensors and Actuators A: Physical, 285, 491-500, 2019,doi: 10.1016/j.sna.2018.11.052.
- C. B. Williams, R. B. Yates, “Analysis Of A Micro-electric Generator For Microsystems,” in Proceedings of the International Solid-State Sensors and Actuators Conference – TRANSDUCERS ’95, 1, 369-372, 1995, doi: 10.1109/SENSOR.1995.717207.
- M. Rhimi, N. Lajnef, “Tunable Energy Harvesting from Ambient Vibrations in Civil Structures,” Journal of Energy Engineering, 138, 185-193, 2012, doi: 10.1061/(ASCE)EY.1943-7897.0000077.
- A. N. Anoshkin, V. Y. Zuiko, K. A. Pelenev, P. V. Pisarev, G. S. Shipunov, “Numerical simulation for development of methodology of stress-strain state control of composite bulkhead for aviation application with the usage of FBG sensors”, PNRPU Mechanics Bulletin, 4, 47-57, 2018, doi: 10.15593/perm.mech/2018.4.04.
- N. A. Mohammed, T. A. Ali, M. H. Aly, “Performance optimization of apodized FBG-based temperature sensors in single and quasi-distributed DWDM systems with new and different apodization profiles,” AIP Advances, 3(12), 122125, 2013, doi: 10.1063/1.4859115.
- P. Xia, L.-H. Zhang, Y. Lin, “Simulation Study of Dispersion Compensation in Optical Communication Systems Based on Optisystem,” Journal of Physics: Conference Series, 1187(4), 042011, 2019, doi: 10.1088/1742-6596/1187/4/042011.
- G. Dastgeer, M. F. Khan, G. Nazir, A. M. Afzal, S. Aftab, B. A. Naqvi, J. Cha, K. A. Min, Y. Jamil, J. Jung, S. Hong, J. Eom, “Temperature-Dependent and Gate-Tunable Rectification in a Black Phosphorus/WS2 van der Waals Heterojunction Diode,” ACS Applied Materials & Interfaces, 10(15), 13150-13157, 2018, doi: 10.1021/acsami.8b00058.
- C. C. Wu, W. Y. Chuang, C. D. Wu, Y. C. Su, Y. Y. Huang, Y. J. Huang, S. Y. Peng, S. A. Yu, C. T. Lin, S. S. Lu, “A Self-Sustained Wireless Multi-Sensor Platform Integrated with Printable Organic Sensors for Indoor Environmental Monitoring,” Sensors, 17, 715, 2017, doi: 10.3390/s17040715.
- S. F. H. Correia, P. Antunes, E. Pecoraro, P. P. Lima, H. Varum, L. D. Carlos, R. A. S. Ferreira, and P. S. André, “Optical Fiber Relative Humidity Sensor Based on a FBG with a Di-Ureasil Coating,” Sensors, 12(7) 8847-8860, 2012 doi: 10.3390/s120708847.
- D. Luo, J. Ma, Z. Ibrahim, Z. Ismail, “Etched FBG coated with polyimide for simultaneous detection the salinity and temperature,” Optics Communications, 392, 218-222, 2017, doi: 10.1016/j.optcom.2016.12.068.
- V. G. Annamdas, “Review on Developments in Fiber Optical Sensors and Applications”, International Journal of Materials Engineering, 1(1), 2166-5389, 2012, doi: 10.5923/j.ijme.20110101.01.
- A. Boersma, R. Cremers, R. Jansen, “Fiber Bragg Grating Distributed Chemical Sensors,” Procedia Engineering, 168, 1245-1248, 2016, doi: https://doi.org/10.1016/j.proeng.2016.11.435.
- Z. L. Poole, P. R. Ohodnicki, A. Yan, Y. Lin, K. P. Chen, “Potential to Detect Hydrogen Concentration Gradients with Palladium Infused Mesoporous-Titania on D-Shaped Optical Fiber,” ACS Sensors, 2(1), 87-91, 2017, doi: 10.1021/acssensors.6b00583.
- S. J. Mihailov, “Fiber Bragg Grating Sensors for Harsh Environments,” Sensors,12(2), 1898-1918, 2012, doi: 10.3390/s120201898.
- T. L. Yeo, T. Sun, K. T. V. Grattan, “Fibre-optic sensor technologies for humidity and moisture measurement,” Sensors and Actuators A: Physical, 144(2), 280-295, 2008, doi: 10.1016/j.sna.2008.01.017.
- K. O. Hill, Y. Fujii, D. C. Johnson, B. S. Kawasaki, “Photosensitivity in optical fiber waveguides: Application to reflection filter fabrication,” Applied Physics Letters, 32(10), 647-649, 1978, doi: 10.1063/1.89881.
- D. Tosi, “Review of Chirped Fiber Bragg Grating (CFBG) Fiber-Optic Sensors and Their Applications,” Sensors, 18(7), 2147, 2018, doi: 10.3390/s18072147.
- E. Vorathin, Z. M. Hafizi, A. M. Aizzuddin, M. K. A. Zaini, K. S. Lim, “Temperature-independent chirped FBG pressure transducer with high sensitivity,” Optics and Lasers in Engineering, 117, 49-56, 2019, doi: 10.1016/j.optlaseng.2019.01.012.
- D. M. Wang, L. S. Wang, Y. Y. Guo, Y. C. Wang, A. B. Wang, “Key space enhancement of optical chaos secure communication: chirped FBG feedback semiconductor laser,” Optics Express, 27(3), 3065-3073, 2019, doi: 10.1364/OE.27.003065.
- M. A. Riza, Y. I. Go, S. W. Harun, R. R. J. Maier, “FBG Sensors for Environmental and Biochemical Applications—A Review,” IEEE Sensors Journal, 20(14), 7614-7627, 2020, doi: 10.1109/JSEN.2020.2982446.
- L. Wang, Y. Wang, J. Wang, F. Li, “A High Spatial Resolution FBG Sensor Array for Measuring Ocean Temperature and Depth,” Photonic Sensors, 10, 57-66, 2020, doi: 10.1007/s13320-019-0550-0.
- M. Jelbuldina, A. Korobeinyk, S. Korganbayev, D. Tosi, K. Dukenbayev, V. J. Inglezakis, “Real-Time Temperature Monitoring in Liver During Magnetite Nanoparticle-Enhanced Microwave Ablation With Fiber Bragg Grating Sensors: Ex Vivo Analysis,” IEEE Sensors Journal, 18(19), 8005-8011, 2018, doi: 10.1109/JSEN.2018.2865100.
- A. E. N. A. Mohamed, A. N. Zaki Rashed, M. Z. Elsiefy, M. M. Zaky, A. I. Elsaket, “Characterization of Fiber Bragg Grating for applications in Nuclear Research Reactors,” The Egyptian International Journal of Engineering Sciences & Technology, 27, 2019, doi: 10.21608/eijest.2019.97276.
- J. Nedoma, M. Fajkus, R. Martinek, “Fiber-Optic Breath Sensors: A Comparison Study,” Journal of Biomimetics, Biomaterials and Biomedical Engineering,40,56-63,2019, doi: 10.4028/www.scientific.net/JBBBE.40.56.
- C. R. U. Kumari, D. Samiappan, K. R, and T. Sudhakar, “Fiber optic sensors in ocean observation: A comprehensive review,” Optik, 179, 351-360, 2019 doi: 10.1016/j.ijleo.2018.10.186.