
Business Intelligence for Generating Comprehensive Report in Electronic Completion and Handover
Volume 5, Issue 6, Page No 45-51, 2020
Author’s Name: Fadhillah Moulita Andiani, Faizal Abid, Hendri, Abba Suganda Girsanga)
View Affiliations
Computer Science Department, BINUS Graduate Program – Master of Computer Science, Bina Nusantara University, Jakarta 11480, Indonesia
a)Author to whom correspondence should be addressed. E-mail: agirsang@binus.edu
Adv. Sci. Technol. Eng. Syst. J. 5(6), 45-51 (2020); ![]() DOI: 10.25046/aj050606
DOI: 10.25046/aj050606
Keywords: Data Warehouse, Business Intelligence, Project Completion, Project Management System, Tree Model Structure

Export Citations
Project completion is a common and best practice for oil and gas and construction industry. It provides a comprehensive completion approach and gives total confidence to asset owner to operate the facility handed over by construction contractors. While the nature variation of asset hierarchy is unique from one type of asset to another, a project completion software must have prominent ability to adapt wide range of variations with unlimited level of hierarchy. One of the approaches to overcome this is implementing a tree-model concept to accommodate flexible hierarchy. Unfortunately, the package is loaded with complexity to retrieve data and takes longer join operation. This paper proposes a business intelligence approach to analyze and make an optimum reporting retrieval using data warehouse. This is implemented in 4 steps following Kimball methods. The objective of this paper is to generate model by using data warehouse starting the extract, transform and load process on the flexible tree model hierarchy. It can be used to generate report and comprehensive dashboard especially progress report of project and work schedule as needed in the oil and gas and construction industry.
Received: 05 June 2020, Accepted: 08 October 2020, Published Online: 08 November 2020
1. Introduction
Project completion or commonly known as commission are one of critical activities for heavy industrial construction project. It gives total confidence for handing over the full facility from contractor to the operator or owner [1] . To support this activity, a project completion software is implemented. It is used to help the contractor’s construction team to ensure that the facility is physically complete and made ready for handover to the commissioning team. Using the construction check sheets agreed by both parties (construction and commissioning), project management team can track, report and control all inspection and testing of workmanship and materials [2].
The barcoded, scanned documentation stored in the system helps to prove the complete and correct execution of all fabrication and installation work in accordance with the project specifications and design drawings. The phase of construction to Commissioning, eventually is continued to Commissioning to Operation provided that each phase requirements are fulfilled, completed, and verified by all related parties
The initial activity with respects to the system completions process is the installation and commissioning of the Electronic Completion and Handover (ECHO) as shown Figure1. An implementation plan should be produced to schedule all key activities necessary to deliver a commissioned PCMS.
The next process is to define the type of equipment or tag type deployed on the project, examples of tag types are: Compressor, Pump, Turbine, Filter, Heat Ex-changer, etc. When a Tagged Item is defined, check sheets can be allocated and generated in a form of Tag Type Matrix. Lead Discipline Engineers and Commissioning Engineers review the project’s Piping and Instrument Diagram (P&ID)s and drawings to define by Discipline and assigned to the related folder, subsystem and eventually by system.
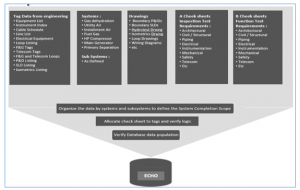
Figure 1: System Setup
P & IDs structure are then represented in the ECHO system as shown Figure 2. Due to wide variety of both facilities and assets, ECHO is required to be flexible to adapt its level of hierarchy with no limitation, one project can consist of three (3) levels of hierarchy, another can be ten (10) levels as shown Figure 3. Most companies focuses in analysing its business mostly on structured data, and use a relational database [3]-[5]. To generate one report from that flexible hierarchy is such a tedious task, since the Structure Query Language (SQL) joint operation can be as many as required. One example of tree concept is illustrated as in Figure 4. ETL process is also used in some companies for processing data warehouse, ETL processes extract data from various sources, transform the data to fit analytical needs and then load it into the database [6]. ETL Process as a part of the Data Warehouse implementation maybe a perfect solution for this and boost the performance of information retrieval of the ECHO system. An ETL tools can be used to extract data and uses business rules to transform the data into new formats [7]. It helps many companies to monitor its performance [8], [9].
This paper implements data warehouse system to the current system and propose a data warehouse model that can be used to make an online analytical processing through an interactive dashboard that can be drilled down, up and across [10]. The goals are to monitor the trend of the project completion and to get insight of the construction inter dependency between systems, disciplines and data-driven coordination among the contractors. It also can be used to obtain the strategy information for decision makers.
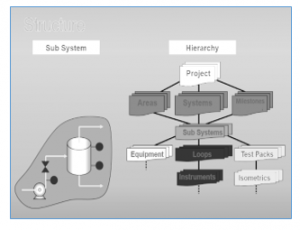
Figure 2: P&ID Structure in ECHO
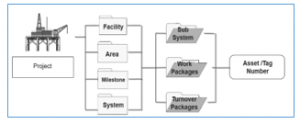
Figure 3: Project’s level of hierarchy

Figure 4: System and Subsystem Tree Structure
2. Literature Review
Since the amount of stored data is growing faster continuously, and the data processing brings many complications, the analytical databases (OLAP) based on the data warehouses rapidly gain popularity in analytical data processing [11]. The research of data warehouse is currently also developed by combining machine learning [12], [13]. The data warehouse is a preformatted data repository that consists of data collection from various format and structure in a particular way to expedite the information retrieval for analytical purposes [14] . Data warehouse is then loaded into a Business Intelligence (BI) platform which is then utilized as decision support technologies that aim to assist in a quick and data-driven decision making [15].

Figure 5: Completion of the check sheets

Figure 6: Star Scheme
3. Proposed Method
As our guideline to develop a complete data warehouse system for ECHO, we are referring to industry widely known as Kimball four-step dimensional design process. Kimball presents a different vision of data warehouses. Kimball considers that the data warehouse be a set of consistent data marts and based on shared conformed dimensions.
Select the Business Process. The first step is to identify the business process. A business process is defined as a major operational process in an organization. Process in business is defined as a natural business activity in an organization supported by legacy source data-collection system (in this project database is used as data-collection). The business processes of this research are: 1. adding completion check sheet based on equipment’s discipline into the project’s scope of work and 2. Technician assigned to the project completes the work and turn the status of its check sheet to complete as shown Figure 5
Declare the Grain. The next step is to declare the grain. The goal of this step is to define the lowest detail on the fact table. The type of the fact table for this research is factless fact table which provide the status of one check sheet assigned to a tag or equipment in a project hierarchy, system-wise and discipline-wise. It also shows the addition and its completion by technician from various contractors.
Identity the Dimension. With the business process selected and the declaration of the grain, we then observe and analyze the supporting information within the granularity of the data, which is called by a dimension, by defining it is a classification tables in original database that have correlation to each other into one table dimension. All the table in original database must be analyzed can classified into dimension tables. We observed that eight dimensions are identified, they are: dim_system, dim_checksheet, dim_technician, dim_date_add, dim_date_complete, dim_status, dim_date, dim_technican, dim_folder and dim_tag.
Identity the Fact. The last step is identifying the fact tables, the fact table normally store the transaction data, and it holds something that measurable. In our case, the fact table is indeed stores transaction data, the transaction of adding a completion check sheet into a project, and completing its work by assigned technician, by definition: A factless fact table is a fact table that does not have any measures. It is essentially an intersection of dimensions (it contains nothing but dimensional keys). There are two types of factless tables: One is for capturing an event, and one is for describing conditions, according to the definition above, we can conclude that the type of our fact table is factless. Figure6 shows the star scheme of the project completion progress where;
- system_key referred to DIM_SYSTEM,
- status_key referred to DIM_STATUS,
- date_add_key referred to DIM_DATE_ADD,
- checksheet_key referred to DIM_CHECKSHEET,
- technician_key referred to DIM_TECHNICIAN,
- date_complete_key referred to DIM_DATE_COMPLETE,
- folder_key referred to DIM_FOLDER,
- tag_key referred to DIM_SYSTEM,
They are respectively assigned into fact_progress as foreign keys.
4. Result and Discussion
In this section, we explain the ETL process for dimensions and for OLAP analysis. In brief, the process is getting data from csv exported from ECHO System, transformed as required then load them into dimensions and fact table, the transformation process is done by Pentaho Data Integration. ETL process consists converting some dimensions and fact process. It can be detailed as follows.
Dimension Add Date. This dimension is to store the addition check sheet date to the project as shown Table 1.
Table 1: Table structure of DIM_DATE_ADD
| Field Name | Type | Description |
| DATE_ADD_KEY | INT | This is a surrogate key in a sequential number |
| DATE_FULL | DATE | Date with format: “dd-mm-yyyy” |
| MONTH | INT | Month index, i.e: 1,2,3,..12 |
| YEAR | INT | Year value, i.e: 2015, 2016, … 2019 |
| DATE_VALUE | INT | Date index in a month, i.e: 1,2,…30 |
| MONTH_NAME | VARCHAR(20) | Month Name, i.e January, February, .. December |
| QUARTER_NAME | VARCHAR(2) | Quarter name, with the concatenation of Q and the number of Quarter, i.e: Q1, Q2, .. Q4 |
Dimension Complete Date. This dimension is to store the complete date of check sheet to the project as shown Table 2.
Table 2: Table structure of DIM_DATE_COMPLETE
| Field Name | Type | Description |
| DATE_COMPLETE_KEY | INT | This is a surrogate key in a sequential number |
| DATE_FULL | DATE | Date with format: “dd-mm-yyyy” |
| MONTH | INT | Month index, i.e: 1,2,3,..12 |
| YEAR | INT | Year value, i.e: 2015, 2016, … 2019 |
| DATE_VALUE | INT | Date index in a month, i.e: 1,2,…30 |
| MONTH_NAME | VARCHAR(20) | Month Name, i.e January, February, .. December |
| QUARTER_NAME | VARCHAR(2) | Quarter name, with the concatenation of Q and the number of Quarter, i.e: Q1, Q2, .. Q4 |
The ETL process of Dim_Complete_data can be shown as shown in Figure 7.

Figure 7: Dimension Complete Date
Dimension Check Sheet. This dimension is to store the dimension of check sheet to the project as shown Table 3.
Table 3: Table structure of DIM_CHECKSHEET
| Field Name | Type | Description |
| CHECKSHEET_KEY | INT | This is a surrogate key in a sequential number |
| DISCIPLINE | VARCHAR(20) | Code discipline of check sheet |
| CHECKSHEET | VARCHAR(95) | Description of discipline check sheet |
The ETL process of Dim_CheckSheet can be shown as shown in Figure 8.

Figure 8: Dimension Check Sheet
Dimension Status. This dimension is to store list of status in the project as shown in Table 4
Table 4: Table structure of DIM_STATUS
| Field Name | Type | Description |
| STATUS_KEY | INT | This is a surrogate key in a sequential number |
| STATUS | VARCHAR(20) | Detail of status, i.e: Outstanding, Completed, Accepted, etc. |
The ETL process of Dim_Status can be shown as shown in Figure 9.
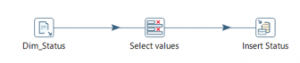
Figure 9: Dimension Status
Dimension Tag. This dimension is to store the information tag in the project as shown Table 5
Table 5: Table structure of DIM_TAG
| Field Name | Type | Description |
| TAG_KEY | INT | This is a surrogate key in a sequential number |
| TAG_CATEGORY | VARCHAR (20) | Consist of category tag, i.e: Building, Electrical cables, etc. |
| TAG | VARCHAR (100) | Detail of tag category, i.e: 1 phase transformer, AC Ups, etc. |
The ETL process of Dim_Complete_data can be shown as shown in Figure 10.
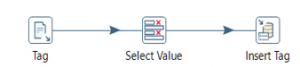
Figure 10: Dimension Tag
Dimension Technician. This dimension is to store the information of technician and contractor in the project. It consists of:
Table 6: Table structure of DIM_TECHNICIAN
| Field Name | Type | Description |
| TECHNICIAN_KEY | INT | This is a surrogate key in a sequential number |
| TECHNICIAN | VARCHAR (50) | Full name of technician |
| CONTRACTOR | VARCHAR (50) | Name of contractor |
The ETL process of Dim_Technician can be shown as shown in Figure 11.
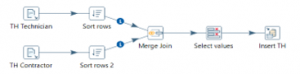
Figure 11: Dimension Technician
Dimension System. This dimension is to store the information of detail system in the project as shown Table 7.
Table 7: Table structure of DIM_SYSTEM
| Field Name | Type | Description |
| SYSTEM_KEY | INT | This is a surrogate key in a sequential number |
| SYSTEM |
VARCHAR (20) |
Description of system key, i.e: Water Spray System, Mooring Equipment |
| SUB_SYSTEM | VARCHAR (20) | Key of subsystem |
|
SUBSYSTEM_ DESC |
VARCHAR (100) | Description of subsystem key, i.e : Mooring Equipment for Marine Terminal Control Shelter |
| TARGET_DATE | DATE | Target date with format: “dd-mm-yyyy” |
The detail of Fact progress can be seen in Table 8.
Table 8: Table structure of FACT_PROGRESS
| Field Name | Type | Description |
| CHECKSHEET_KEY | INT | cheecksheet_key is a key from dim_checksheet |
| TECHNICIAN_KEY | INT | technician_key is a key from dim_techncian |
| SYSTEM_KEY | INT | system_key is a key from dim_system |
| DATE_ADD_KEY | INT | date_add_key is a key from dim_date_add |
| DATE_COMPLETE_KEY | INT | date_complete_key is a key from dim_date_complete |
| STATUS_KEY | INT | status_key is a key from dim_status |
| FOLDER_KEY | INT | folder_key is a key from dim_folder |
| TAG_KEY | INT | tag_key is a key from dim_tag |

Figure 12: Dashboard Example
Report Generation. Once the star schema and its ETL Processes are defined, we then generate the report based on the new transformed table structure. One of the critical information required by the project is figuring the total number of check sheets required to be completed based on the project’s system. We use Pentaho Report Generator as it is a dynamic and easy to use tool to generate dynamically from the database.
We can conclude in the project, that most of the work is in the Civil Onshore system which covered more than fifty percent, sixty six percent to be precise, and followed by the Dehydration System. Setting up the Dashboard. Beside report, dashboard can also be generated from tables in database. For data visualization and interactive dashboard, Tableau is used. Tableau’s main products offered by Tableau are Tableau Desktop, Tableau Public, and Tableau Online, all offer Data Visual Creation and choice depends upon the type of work [16].
Figure 12 is an example dashboard that can be generated from all table in database. Bar chart shows how many folders that have been used. Bottom left is treemap, to select tenant name. And next to it is pie chart that shows which protocol is used. By clicking one of the charts, it will change the whole dashboard information based on the clicked condition. For example, if February is clicked tree map of tenant name will adjust which tenant sent bytes in February. The pie chart will do the same thing, it will show the protocol that is used in February.
From interactive dashboard, we instantly see the proportion of contractors assigned to a system as shown Figure 13. In this way we can see the interdependency between integrated project team with the contractors who are supporting the team on delivering their scope of work in an ordered manner.
5. Conclusion
By implementing data warehouse, ECHO with the dynamic tree table structure improves significantly to provide progress report and helps to provide informed decision making in managing the project completion by prioritizing on the work schedule and chasing the deadline by analyzing the best resource allocations.
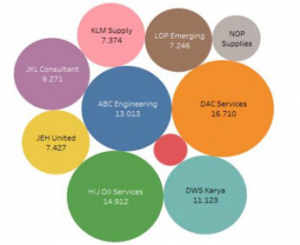
Figure 13: Progress Contractor Dashboard
For future research, the data warehouse then can be used to be analyzed with another method like projection on for another business process such as trend prediction, certificate completion, decision making on the resource allocation etc.
- Facilities Systems Completion Planning and Execution, American Petroleum Institute, 1, 2013.
- S. Andriole, “Unstructured Data: The Other Side of Analytics,” Forbes.[Online]. Available: Http://Www. Forbes. Com/Sites/Steveandriole/2015/03/05/the-Otherside-of-Analytics, 2015.
- N. Mali, S. Bojewar, “A Survey of ETL Tools,” International Journal of Computer Techniques, 2(5), 20–27, 2015.
- O. Andersen, C. Thomsen, K. Torp, “SimpleETL: ETL Processing by Simple Specifications.,” in DOLAP, 2018.
- S. Kozielski, R. Wrembel, New trends in data warehousing and data analysis, Springer, 2009. https://doi.org/10.1007/978-0-387-87431-9
- H. Santos, V. Dantas, V. Furtado, P. Pinheiro, D.L. McGuinness, “From data to city indicators: A knowledge graph for supporting automatic generation of dashboards,” in European Semantic Web Conference, Springer: 94–108, 2017, https://doi.org/10.1007/978-3-319-58451-5_7
- M. Breslin, “Data warehousing battle of the giants,” Business Intelligence Journal, 7, 6–20, 2004.
- R. Thiagarajan, J. Khuntia, A. Kathuria, T.J. V Saldanha, “An Integrated Model of Business Intelligence & Analytics Capabilities and Organizational Performance,” Communications of the Association for Information Systems, 46(1), 31, 2020. https://doi.org/10.17705/1CAIS.04631
- C. Sivamathi, S. Vijayarani, “A utility-based approach for business intelligence to discover beneficial itemsets with or without negative profit in retail business industry,” International Journal of Business Intelligence and Data Mining, 16(3), 361–380, 2020, https://doi.org/10.1504/ijbidm.2020.106136
- L. Yessad, A. Labiod, “Comparative study of data warehouses modeling approaches: Inmon, Kimball and Data Vault,” in 2016 International Conference on System Reliability and Science (ICSRS), IEEE: 95–99, 2016, https://doi.org/10.1109/icsrs.2016.7815845
- R. Kimball, M. Ross, The data warehouse toolkit: the complete guide to dimensional modeling, John Wiley & Sons, 2011.
- M.A. Khan, S. Saqib, T. Alyas, A.U. Rehman, Y. Saeed, A. Zeb, M. Zareei, E.M. Mohamed, “Effective Demand Forecasting Model Using Business Intelligence Empowered With Machine Learning,” IEEE Access, 8, 116013–116023, 2020 https://doi.org/10.1109/access.2020.3003790
- W. Basri, “Examining the Impact of Artificial Intelligence (AI)-Assisted Social Media Marketing on the Performance of Small and Medium Enterprises: Toward Effective Business Management in the Saudi Arabian Context,” International Journal of Computational Intelligence Systems, 13(1), 142–152, 2020. https://doi.org/10.2991/ijcis.d.200127.002
- R. Kimball, “Factless fact tables,” DBMS, 9(10), 16–18, 1996.
- J.M. Villamarín-García, “Contributions from organisational collaboration to business intelligence solutions success,” International Journal of Business Information Systems, 33(1), 103–131, 2020. https://doi.org/10.1504/ijbis.2020.10012991
- M. Mussa, S. Souza, E. Freire, R. Cordeiro, H. Hora, “Business Intelligence in Education: An Application of Pentaho Software,” Revista Produção e Desenvolvimento, 4(3), 29–41, 2018.