
Analysis of Green Building Effect on Micro grid Based on Potential Energy Savings and BIM
Volume 5, Issue 6, Page No 30-35, 2020
Author’s Name: Ihsan Mizher Baht1,a), Petre Marian Nicolae1, Ileana Diana2, Nameer Baht3
View Affiliations
1Department of Electrical engineering, Craiova University, Craiova, 200396, Romania
2Department of Computer Science and IT, Craiova University, Craiova, 200396, Romania
3Department of Computer Science, Universities west of Timisoara, Timisoara, 300088, Romania
a)Author to whom correspondence should be addressed. E-mail: imb121378@yahoo.com
Adv. Sci. Technol. Eng. Syst. J. 5(6), 30-35 (2020); ![]() DOI: 10.25046/aj050604
DOI: 10.25046/aj050604
Keywords: Energy Management Systems, Micro Grids, Green Buildings, Optimization Software

Export Citations
In this paper we are demonstrating the importance of building and achieving a renewable electrical power system that works in synchronization with the grid. The average of consumption, generation and the negative environmental effect of generating power were analyzed. This paper is divided into three parts, one was analyzed with Green Building Studio software and the other with Building Information software. Using BIM software, the levels of energy consumption were analyzed for a building in Baghdad – Iraq and in Craiova _ Romania, alongside pollution levels produced, and the possibility of energy generation utilizing PV cells and wind, the output power that can be achieved in respect to temperature and irradiance levels. Using Green Building software, energy consumption system was analyzed in the level of green building.
Received: 28 August 2020, Accepted: 08 October 2020, Published Online: 08 November 2020
1. Introduction
The concept of power and energy management refers to the use of highly effective and reliable blueprints of managing the available power and energy in such a way that the outcomes are optimized while also preventing wastage. Despite the fact that there are many factors and issues that cause power and energy loss, the absence of an effective management blueprint is one of the main contributors [1]. When an effective blueprint is absence, it then follows that the framework of power loss is heighted. Following is an evaluation of the distinctive factors and issues affecting the management of power and energy. It is vitally important to accentuate the fact that there are numerous issues and factors that impact the management of power and energy. While some of the factors are preventable in the short-term, others can only be addressed in the long-term. Unless these factors are identified in the first place, the blueprint for management of power and energy cannot be enhanced. Over the years, many problems have characterized power and energy systems in different parts of the world because such systems were not aligned towards an effective management blueprint [2]. There is thus the need to identify the distinctive issues and factors that play a direct role in the framework of power and energy management.
2. Factors Effecting Power and Energy Management
As far as the factors affecting the management of power and energy are concerned, one of the most important issues of emphasis pertains to location. Depending on the location, a given blueprint for management of power and energy can either be effective or ineffective [3]. In line with this attribute, there is always the need to ensure that the process of management of power and energy is strongly aligned towards the specific needs and priorities of a given location. Such an approach is essential towards the prevention of potential problems such as power and energy loss. The factors affecting the framework of management of power and energy also encompass the source of power. Different sources of power are characterized by distinctive attributes and issues. It then follows that the specific source must be determined in order to develop a framework of management of power and energy that is effective in the short-term as well as in the long-term [4]. A notable way in which the source of power impacts the framework of management of power and energy is that it determines whether a given management strategy can help in the reduction of energy wastage or not. This goes a long way towards determining the quality of outcomes in the long-term as well as in the short-term.
Competence of personnel is a major issue that determines the approach used within the context of management of power and energy. For instance, the competence of staff members in a power grid determines the manner in which they approach decision making processes concerning power management [5]. Additionally, it is also notable that the competence of personnel goes a long way towards determining whether they understand the technical elements of management of power and energy or not.
As far as the factors influencing the blueprint of management of power and energy are concerned, another notable aspect of emphasis pertains to the availability of resources. In some instances, the scarcity of resources can compromise the extent to which the management of power and energy is aligned towards the intended goals. This is because there are extensive resource requirements at any stage of managing energy and power. It is also vitally important to highlight the fact that the availability of resources impacts the manner in which planning is actualized into the blueprint for management of power and energy [6]. In view of these stipulations, it is hence evident that the availability of resources is always a notable aspect of emphasis that determines the manner in which the blueprint for management of power and energy is actualized. The engineering vision of analyzing and constructing green buildings is a foundation for energy management such as to guarantee the achieving of great economic benefits [7, 8].
3. Building Performance Analysis (BPA) and Optimization Energy (OE) in Green Building Studio (GBS)
The Green building studio (GBS) which powers the energy analysis through (cloud-based service), the GBS with Insight 360 Revit Autodesk is able to test daily and weekly then make review, comparing with the previous results, there are two types of testing in green building studio (GBS):
Service side: energy results from GBS compare against the baseline. Analytics: written the energy results as simulation and compared with the baseline. The green building studio analyze the performance of the building as total annual energy consumption (electrical, fuel, CO2), total annual cost and potential energy savings.
The GBS analyzes automatically 37 separate energy simulations that can run in the cloud through the weather data station (in Baghdad use for analyzing the weather station GBS_06M12_12_002295).
The performance factors of analysis are:
- Light efficiency (from 0.7w/sf-1.9w/sf)
- Plug load efficiency (from 0.6w/sf-2.6w/sf)
- Building orientation (0 degree, 135 degree….etc.)
- Operations schedule (24/7, 12/7, 12/5 ….etc.).
- Daylighting occupancy and non-control.
- Infiltration load.
- Other (civil and mechanical parameters).
3.1. Green Building Analysis Based On Bulding Orientation
The first effective factor before creating the green building, the Building orientations, selects the optimum degree to the building construction to provide the best energy use intensity, total annual cost and total annual energy. Table 1 represents the orientation of a green building in Baghdad city.
Table 1: The Total Annual Energy Cost (Building Orientations)
| Degree |
EUI MJ/M2 /YE. |
Total annual cost $ | ||
| Electrical | Fuel | Energy | ||
| 0 | 1030 | 7233 | 120 | 7354 |
| 135 | 1054 | 7201 | 130 | 7332 |
| 180 | 1026 | 6752 | 136 | 6889 |
| 225 | 985 | 6401 | 134 | 6535 |
| 270 | 1024 | 6976 | 127 | 7104 |
| 315 | 1016 | 7057 | 121 | 7178 |
| 45 | 1012 | 6982 | 123 | 7106 |
| 90 | 1060 | 7346 | 127 | 7473 |
From the Table 1 at 225 degree building orientation, the energy use intensity (EUI) 985 MJ/m2 /year, total annual cost electric 6401 and the energy cost for one year 6535. The solar irradiance, temperature, flow air, infiltrations etc. at 225 degree is the optimum point for construction of green building to save the cost of energy and fuel.
Table 2 represents the annual energy consumptions at a green building with the different degree orientation at the same location. At 225 degree the total annual energy consumption in kWh 46.590(minimum consumptions), and at 90-degree orientation 53.465(maximum consumptions)
Table 2: The Total Annual Energy Consumptions (Building Orientations)
| Degree | Total annual energy | |
| Electrical kWh |
Fuel MJ |
|
| 0 | 52.649 | 87.929 |
| 135 | 52.416 | 95.127 |
| 180 | 49.146 | 99.485 |
| 225 | 46.590 | 97.616 |
| 270 | 50.777 | 93.077 |
| 315 | 51.362 | 88.650 |
| 45 | 50.822 | 89.573 |
| 90 | 53.465 | 92.914 |
From the results (Table 1, Table 2) the minimum energy consumption, minimum EUI, and minimum energy fuel cost is at the 225 degree. Green Building Studio (GBS), Insight 360 is able to analyze the weather effect on the building to provide the best benefit from the environment and the effects of climate, wind …etc.
The parameters analysis extensions a scope of possibilities to find very active building as a green building, for example the climate can determine the type and capacity of the lighting installation depending on the degree of the building orientations.
Figure 1 and Figure 2 Represent the total annual energy consumption MJ and total annual electrical consumption. The Y- axis total energy (MJ), X-axis time (year) for example in Jan the red bar shows the space heat ,yellow bar area light, blue bar space cooling.

Figure 1: The Total Annual Energy Consumption (Mj)
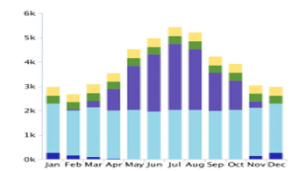
Figure 2: The Total Annual Electrical Consumption (Kwh)
3.2. Green Building Analysis Based On Daylighting
The second factor effect on the energy consumption in green building is daylighting analysis, the daylighting analysis is divided into four parts:
- Daylighting and occupancy control daylighting & occupancy control.
- Daylighting and occupancy control daylighting control.
- Daylighting and occupancy control none.
- Daylighting and occupancy control & occupancy control.
Table 3 presents the amount of total annual cost and total energy consumption for the four parts of daylights control regarding to GBS weather station (cloud-based service).
Table 3: The Amount of Total Annual Cost and Total Energy Consumption
|
Total Annual Cost $ |
Total Annual Consumptions Energy | |||||
| Day Light |
Eui Mj/M2/Y |
Ele.
|
Fue. | Ener. |
Elec. Kwh |
Fuel Mj |
| 1 | 1016 | 7.020 | 123 | 7.143 | 51.04 | 89.58 |
| 2 | 1021 | 7.105 | 122 | 7.227 | 51.710 | 88.89 |
| 3 | 1030 | 7.233 | 120 | 7.354 | 52.649 | 87.92 |
| 4 | 1023 | 7128 | 121 | 7250 | 51.883 | 88.74 |
From the Table 3 the green building studio analysis improves the maximum energy potential savings in Daylighting and occupancy control daylighting & occupancy control.
Figure. 3 and Figure. 4 represent the total energy (MJ), electrical consumption kwh for Daylighting and occupancy control daylighting & occupancy control for the one-year period.

Figure. 3: The Total Energy (Mj)

Figure 4: Electrical Consumption (Kwh)
3.3. Green Building Analysis Based On potantial energy (cost)savings
For the design of a green building and an existing building analysis, the reduce of the energy used is one of the main targets of the GBS, potential energy savings (PES) analyze all buildings energy performance (more than 37 separate energy simulations).
For the photovoltaics analysis (in Baghdad, weather station GBS_06M12_12_002295) at 225-degree orientation building, installed on the roof of the building, the panel type single crystalline -13.8 efficiency, installed panel cost 8$ per watt, applied electric cost 0.14$, the maximum payback period 50 years, installed panel cost 162.266$, installed panel area 147m2, the annual energy production 36 kWh.
Table 4 presents the potential cost saving and annual energy with payback per surface per year, the annual energy produced depends on two factors, the panel area and solar exposure %, for example at the annual energy produce of 984(kWh), the panel area 4 m2, solar exposure 69.9%.
Table 4: Potential Cost Saving and Annual Energy with Payback Per Surface Per Year
| Potential cost savings $ | |||
|
Annual energy kWh |
Per year/m2 | Per year | payback per surface per years |
| 984 | 36.04 | 133 | 23.9 |
| 2914 | 36.04 | 408 | 23.9 |
| 364 | 36.04 | 51 | 23.9 |
| 447 | 36.04 | 63 | 23.9 |
| 16.703 | 32.23 | 2.338 | 26.1 |
| 3.251 | 32.14 | 455 | 26.2 |
| 3.207 | 31.80 | 499 | 26.3 |
| 3.563 | 31.8 | 499 | 26.3 |
| 2.767 | 31.80 | 387 | 26.3 |
3.4. Implications of Power and energy management
In view of the various factors and issues affecting the process of management of power and energy, there is also the need to identify the distinctive implications of management of power and energy [9]. These implications re essential in that they influence the planning process especially when it comes to decision making as well as allocation of resources [10]. Additionally, clarity of the implications helps in determining the best possible strategy to apply within the confines of management of power and energy.
The specific implications of management of power and energy also encompass sustainability. This refers to the use of energy resources in such a way that the needs of the future generations are considered even while scarce resources are being utilized by current generations [11]. Despite the fact that there are many factors and issues that contribute towards the sustainable use of power, the framework of management is always important. Additionally, the fact that the process enhances the extent to which energy and power is is optimized is also indicative of the manner in which the blueprint for management of power and energy enhances suitability.
3.5. Evaluation of CO2 emissions when only fuel is used for power generation
One of the most important criteria for creating a system that depends on improving the environmental levels is the effect of CO2 gas that is a by-product of electrical energy production.
Figure 5. Depicts the effect of energy production. Fuel consumption in Baghdad – Iraq is up to 6 tons [12] [13].
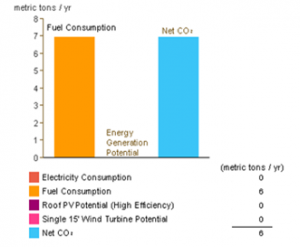
Figure 5: Energy and CO2 Consumptions (Baghdad)
Figure 6 depicts that fuel consumption is 4 tons in the city of Craiova – Romania. The generation system above was analyzed using BIM software for the same area, utilization and population. But the average effect in Craiova is less than Baghdad [12] [13].

Figure 6: Energy and CO2 Consumptions (Craiova).
The table 5 below states the expected average electrical power generation if renewable energy (PV) is utilized, where these data were analyzed and average temperature and irradiance were calculated for both cities of Baghdad and Craiova for several types of solar panels and also for wind turbine. The average production in Baghdad is higher than that in Craiova because of the nature of weather and intervals of sun energy availability and higher levels of irradiance [12] [13].
Table 5: Estimations energy produce by Pv cells And Wind
| Energy Estimation | BGW(kwh/yer) | CRA. (kwh/yer) |
| PV cells (low efficiency) | 12,377 | 9,009 |
| PV cells (medium efficiency) | 24,755 | 18,017 |
| PV cells (high efficiency) | 36,132 | 27,026 |
| wind turbine Single 15’ | 1,956 | 691 |
4. Analysis by using BIM software
BIM software functions through analyzing of buildings and stating the effects of civil and mechanical works on the electrical power consumption. BIM software includes several criteria, in total 26 factors which improve grid performance and decrease consumption. Figure 7 illustrates the average annual energy consumption of the buildings taking into consideration building utilization, for example as a school, hospital or residence.
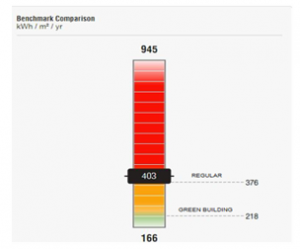
Figure 7: Energy Consumption
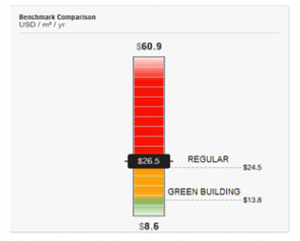
Figure 8: Costs Analysis
We can observe that average energy consumption reaches 376 kW, while when using BIM software analysis system consumption may be 218 kW/m3 at the same efficiency. Estimated cost changes also from $24.5 to $13.6 (Figure. 8).
Figure 9 represents a comparison in analysis of a building in Baghdad where average consumption is highest through normal analysis, but when Green Building software is utilized as represented in yellow color which reaches a consumption of 310kwh/m3, and green color when analyzed using BIM software with an annual consumption of up to 120kwh/m3 [12], [13].
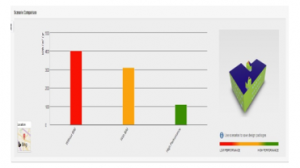
Figure 9: Analysis Performance
5. Conclusions
In this paper, the work was divided into three parts, first part analyzes a building and the effect of weather using Insight software. In the second part an analysis is done via Green Building, where a total cost was calculated to build a solar energy generation system to reduce electrical power consumption, and utilization of building angle which serves to better usage of weather. Third part is an analysis of the systems above. And depicting the economic value that BIM software provides to building efficiency, decrement of consumption, and decrement of costs
- A. Gulagi , Dmitrii Bogdanov & Christian Breyer, “A Cost Optimized Fully Sustainable Power System for Southeast Asia and the Pacific Rim,” Energies, MDPI, Open Access Journal, 10(5), 1-25, April 2017, doi:10.3390/en10050583. 2017. 10.583
- T. Dragicevic, J. Guerrero, J.Vasquez, and D. Skrlec, “Supervisory control of an adaptive-droop regulated dc microgrid with battery management capability,” IEEE Trans. on Power Electron., 29(2), 695–706, 2014. doi: 10.1109/TPEL.2013.2257857.
- H. Yousefi, M. Ghodusinejad, ” Feasibility Study of a Hybrid Energy System for Emergency Off-grid Operating Conditions. Majlesi Journal Of Electrical Engineering”, 11(3), 7-14 ,2017.
- A. Wentland,”Imagining and enacting the future of the German energy transition: electric vehicles as grid infrastructure. Innovation” The European Journal Of Social Sciences, 29(3), 285-302,2016, doi:org/10.1080/13511610.2016.1159946 .
- E. Ganesan., “Modeling, control, and power management for a grid-integrated photo voltaic, fuel cell, and wind hybrid system”, Turkish Journal Of Electrical Engineering & Computer Sciences, 24(6), 4804-4823, 2016 , doi: 10.3906/elk-1404-409.2016.
- N. Çetinkaya, “Improving of renewable energy support policy and a performance analysis of a grid-connected 1 mwp pv power plant in Konya Selcuk University” , Journal Of Engineering, Science & Technology / Selçuk Üniversitesi Mühendislik, Bilim Ve Teknoloji Dergisi, 5(3), 251-261, 2017,doi:10.1273/tused.10159.2016
- T. Dragicevic, J. Guerrero, J.Vasquez, and D. Skrlec, “Supervisory control of an adaptive-droop regulated dc microgrid with battery management capability,” IEEE Trans. on Power Electron., 29(2), 695–706 , 2, doi: 10.1109/TPEL.2013.2257857,2014.
- F. Zhang, T. Zhang, R. Wang, “Optimizing Hierarchical Power Distribution of Multiple Local Energy Network Systems in GridConnected Mode”, Polish Journal of EnvironmentalStudies, 26(5), 1981-2000, doi:org/10.15244/pjoes/69440.2017.
- A. Al Ameri , Aouchenni Ounissa , Cristian Nichita & Aouzellag Djamal, “Power Loss Analysis for Wind Power Grid Integration Based on Weibull Distribution,” Energies, MDPI, Open Access Journal, 10(4), 1-16, April, 2017, doi:org/10.3390/en10040463.2017.
- A. Lösch, & C. Schneider,”Transforming power/knowledge apparatuses: the smart grid in the German energy transition. Innovation”. The European Journal Of Social Sciences, 29(3), 262-284, 2016, doi:org/10.1080/13511610.2016.1154783.2016.
- M. Serraji, El Amine D. O., & Boumhidi J., “Multi swarm optimization based adaptive fuzzy multi agent system for microgrid multi-objective energy management”,International Journal of Knowledge-based and Intelligent Engineering Systems, 20(4), 229-243, 2016, doi: 10.3233/KES-160350.2016.
- I. M. Baht, P.M. Nicolae, M. Ş. Nicolae, and Ileana Diana Nicolae, Analysis of Load Demand and Economic Assessment Based on Weather Forecasting in Green Buildings, Annals of the University of Craiova, Electrical Engineering series, 43(1), 147-152, 2019 .
- I.M. Baht, P.M. Nicolae and M. Ş. Nicolae, “Impact of Weather Forecasts and Green Building on Micro Grid Energy Management System”, Proceedings of SIELMEN 2019, Chişinău, Oct , POCU380/6/13/123990. 2019.