Student’s Belief Detection and Segmentation for Real-Time: A Case Study of Indian University
Volume 5, Issue 5, Page No 742-749, 2020
Author’s Name: Chaman Verma1,a), Zoltan Illes1, Veronika Stoffova2
View Affiliations
1Department of Media and Educational Informatics, Faculty of Informatics, Eotvos Lorand University, Budapest, 1117, Hungary
2Department of Mathematics and Computer Science, Faculty of Education, Trnava University, Trnava, 91843, Slovakia
a)Author to whom correspondence should be addressed. E-mail: chaman@inf.elte.hu
Adv. Sci. Technol. Eng. Syst. J. 5(5), 742-749 (2020); ![]() DOI: 10.25046/aj050590
DOI: 10.25046/aj050590
Keywords: ANOVA, Belief, Clustering, Real-Time, Squared Euclidean Distance, Technology

Export Citations
This paper has explored the technology beliefs of university students considering four parameters. We have proposed an automatic belief identification system for academic institutions. For this, we used two different clustering algorithms to segment the student group with different beliefs about the technology. In the Hierarchical Clustering (HC), the Agglomerative approach was followed. The beliefs were segmented with Ward’s method and Squared Euclidean Distance (SED). The HC method recommended a maximum of three and a minimum of two optimal clusters. Later, we applied K-Means clustering on 37 features to validate the initial cluster solution. Based on ANOVA’s results, we select 20 significant features that contributed most to detect dissimilarity in students’ beliefs. The findings of the paper proved that suggested features stabilized clustering as compared to all features. The novel features provided three clusters: cluster 1 with 27.61%; cluster 2 with 34.36%; cluster 3 with 38.04% students with similar beliefs about the technology. Based on the results provided, we found the high (mean>3.5), undecided (mean:1.73-3.63), and hybrid (mean:1.34-4.68) beliefs towards the technology available at university. We also recommended the selected features to be used as predictors for the online belief detection system. The university administration needs to cure students belonged to undecided groups.
Received: 05 August 2020, Accepted: 06 September 2020, Published Online: 12 October 2020
1. Introduction
Nowadays, artificial intelligence is most prevalent in every sector of our life. Not even the education domain stays untouched. To explore the hidden data patterns, the use of machine learning techniques play a vital role [1]. For this, two major types (supervised and unsupervised) of machine learning algorithms were used to solve various problems. The supervised machine learning classifiers are used appropriately in the education domain [2].
In the unsupervised machine learning algorithms, a variety of clustering algorithms are available. Cluster Analysis (CA) is an exploratory approach to organize raw data into a significant segment based on combinations. To structured vast amounts of data into the same type of similar groups is called CA, and these groups are also called clusters [3]. It is a mathematical tool in data mining to realize the hidden structure or specific patterns in a data set [4]. The CA’s main objective is to scatter a finite set of N items into C clusters to explore the homogeneity within items in a single cluster. It also ensures the heterogeneity among the cluster relationships [4],
[5]. According [6], the general mathematical notation of clustering
shown in equation(1).
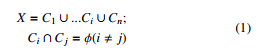
where X denotes the original data set, Ci, j are clusters of X, and n is the number of clusters [7].
This paper used unsupervised machine learning algorithm i.e. HC methods having no idea of input. But we can have determined the output with the results provided. It makes an initial cluster solution to give a rough idea to decide the number of clusters. We used the agglomerative algorithm (Bottom-up) appropriate for small data samples. It has the complexity of O(n3) [4], and the applied agglomerative HC algorithm is well described.
The K-Means cluster algorithms have been using in the academic domain to analyzes the samples from different aspects. It has been used to select a thesis topic for students as a decision support system [8]. It also helped in the management of ideological and political education in the academic institutions [9], [10]. The academic performance of students was also segmented using it [11]. Several
significant factors explored that affected the student’s enrollment in Indian institutions [12]. An online programming error detection system was also proposed based on three factors [13]. With the filtered content, the undergraduate thesis report clustered based on the theme [14]. A social network system was presented to connect newcomer students at college for coordination and support [15]. The automatic segmentation of test questions was proposed based on the correctness, incorrectness, modified times, and the difficulty level [16]. The reading behavior of university students was segmented using library loan records [17].
2. Research Contribution
The studied literature shown that the clustering algorithms had supported appropriate in the research for education informatics. Further, we did not find any technology beliefs segmentation with feature selection technique research. This paper applied unsupervised learning algorithms (clustering) on real-data. We have identified the likeness, and disagreement of students towards the technology provided, which is most important to focused object. Firstly, we implement the HC approach that provided initial cluster solution, and thereafter same three cluster solution implemented and validated with K-Means clustering inclusive ANOVA method. Using the combined approach, we have proposed 20 significant technology features that contributed most to detect dissimilarity in students beliefs. Further, the technology belief detection system could be helpful the university administration to analyze the likes and dislikes of students towards the technical facility provided. Therefore, this paper encourage the future researcher, and web developer to make automate real-time belief identification system that may helpful to the institute, and for the student himself or herself.
3. Research Organization
The rest of the paper is structured into five sections. Section 4 elaborates on the research methodology in detail. Section 5 about the experiments 6 concludes the paper with major findings. Section 7 enlightens the shortcomings of the paper. Section 8 discusses the future scope with recommendations.
4. Research Method
4.1. Purpose of the Study
The present study is a preliminary investigation to propose the new features identifying homogeneity and heterogeneity of technology beliefs among university students. Besides, students’ responses need to be determined based on their perceptions. Assumed it as the main objective, the present study implemented two clustering algorithms with a feature selection approach.
4.2. Research Design
Figure1 displays the conceptual view of the present paper. We conducted a technology awareness survey to divide a group of students having similar nature using the segmentation. Firstly, a hierarchical clustering is applied to obtain initial cluster solution. In this, the agglomerative cluster formation algorithm is used with the SED cluster interval approach. The results of initial clusters displayed with agglomeration schedule, membership, dendrogram, and scatter plots, etc.,
Secondly, we applied non hierarchical clustering K-Means with ANOVA as a feature selection approach. The results are displayed with ANOVA table, membership of cluster, final cluster centre, final clusters, graphs, and scatter plots.
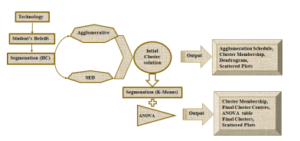
Figure 1: Technology Belief Detection and Segmentation.
4.3. Dataset Preprocessing
This paper used 163 primary data samples from one of A+ grade private institutions (Chandigarh University) in north India. Using the google form, We asked technology-based questions to the bachelor and master students of the university. The survey response rate was 100%. Samples were collected from 137 male students and 26 female students. Four major Features (F) of the Google Form was: Development-Availability (DA) with 16 questions; Usability (U) with 06 questions; Attitude (AT) with 06 questions; and Educational Benefit (EB) with 09 questions. We also calculated the mean score of recorded instances for these attributes. Dut to hybrid data metrics, all instances re-scaled on 0-1. Excellent reliability of 163 samples calculated 0.857 with Cronbach’s Alpha method using equation(2).
![]()
where N is the number of F. c¯ is the average covariance between F-pairs, and ¯v is the average variance.
4.4. Feature Selection
The analysis of variance with F statistics is appropriate to select the best contributors in clustering and has been used to compare the efficiency of supervised learners [18]. R.A. Fisher founded the ANOVA in 1920, and Snedecor founds F-distribution. We used both to select the most prominent features that participated significantly in the segmentation of beliefs. It provides vital features that contributed the most to the cluster solution.
![]()
The equation(3) calculated the total sum of square (TSS) using correlation factor C
![]()
The equation(4) shows the way to estimate the Degree of Freedom
(DF), where K is number of cluster groups, and N is total number of cases in clusters.
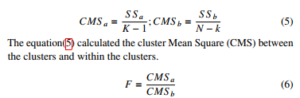
The equation(6) calculated the F value based on the mean square of cluster values. Where CMS used for between (a) and within (b) cluster variances. The F statistic calculated with dividing CMS a by CMS b.
Table 1: Feature selection using ANOVA.
| F1 | 3.1 | 0.5 | 6.6 | 0.002 |
| F2 | 29.7 | 0.7 | 41.4 | 0.000 |
| F3 | 30.8 | 0.6 | 51.3 | 0.000 |
| F4 | 30.4 | 0.7 | 43.2 | 0.000 |
| F5 | 44.4 | 0.6 | 71.3 | 0.000 |
| F6 | 44.7 | 0.7 | 65.9 | 0.000 |
| F7 | 9.3 | 0.9 | 10.5 | 0.000 |
| F8 | 34.1 | 0.8 | 42.4 | 0.000 |
| F9 | 25.2 | 1.2 | 21.7 | 0.000 |
| F10 | 40.4 | 0.8 | 21.3 | 0.000 |
| F11 | 17.1 | 0.81 | 21.3 | 0.000 |
| F12 | 41.5 | 0.5 | 88.0 | 0.000 |
| F13 | 30.0 | 0.41 | 73.0 | 0.000 |
| F14 | 26.0 | 0.4 | 64.0 | 0.000 |
| F15 | 29.3 | 0.5 | 55.6 | 0.000 |
| F16 | 22.1 | 0.5 | 46.5 | 0.000 |
| F17 | 34.7 | 0.3 | 107.1 | 0.000 |
| F18 | 27.8 | 0.5 | 61.4 | 0.000 |
| F19 | 29.9 | 0.4 | 74.2 | 0.000 |
| F20 | 25.8 | 0.4 | 59.4 | 0.000 |
Table 1 displays the results of the ANOVA table with Feature Code (FC). We selected 20 significant features (F1-F20) having significant P value less than 0.05 with CMS, Error Mean Square
(EMS) corresponding F, and P. We found that all features have large F values for providing the greatest separation between clusters.
5. Experiment, Results and Discussion
This section discusses the experimental results provided with the HC method, and K-Means.
5.1. Hierarchical clustering
We used the HC technique to ensure the initial clusters of students’ beliefs towards technology. We used the Agglomerative, also called the bottom-up structure of cluster formation in the IBM SPSS Statistics 25. The solution range minimum value is 2, and the maximum value is 4 during the HC clustering. Each observation starts in its cluster, and pairs of clusters merged as one moves up the hierarchy. In this, we applied Ward’s method [19] to form the cluster [20] and interval estimated with the SED approach that is deriving the Euclidean distance (d) between two data points involves computing
the square root of the sum of the squares of the differences between corresponding values.
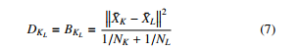
Above equation(7) shows the applied ward’s method having distance between two clusters (D and B). Manhattan distances used to generalized Ward’s method [21]
In equation(10), d is SED estimated between the data points x, and y.

Figure2 visualizes the total number of cluster stages on the x-axis calculated by the HC and the estimated standardized Coefficient across the y-axis. We see no significant difference among the stages up to 31. A considerable minor difference observed between stage 31 to 161 stages. The drastic updates (red vertical bar) noted in the HC coefficients after stage 161 spotted with a vertical reference line, and the value of the coefficient is 12.3. The green reference line as an x-axis reference proved the maximum standardized coefficient value is 15.4.
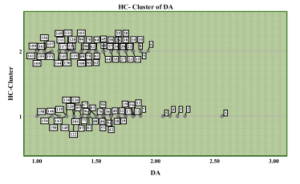
Figure 3: Development-Availability Belief Segmentation.
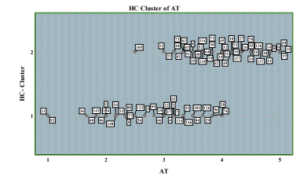
Figure4 shows the different two clusters with heterogeneous beliefs of students towards the attitude variable. We observed 45 students’ beliefs firmer than the mean value of 3, and it proved that these students have a positive attitude towards technology. Only two students (11, 92) found negative only, which is near to mean 1. We also found 34 students are near to the mean values 2 to 4. Therefore, the majority of students’ beliefs towards the agreement statements.
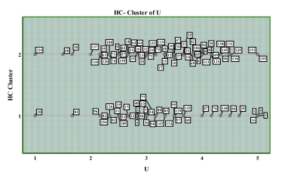
Figure5 demonstrates the cluster related to the use of technology at the university campus. The density of beliefs bowed towards a mean score 3 to 5 that depicted the agreement about the usability of technology. Therefore, they are using technology at university campus often or every time. Only 4 students strongly agreed at mean value 5 in cluster 1, and 2 agreed in cluster 2 who are using technology all the time.
5.2. K-Means Clustering
To classify the student’s beliefs towards the technology, we applied the K-Means cluster analysis algorithm in the IBM SPSS statistics tool. It assigns the cases to a fixed number of groups (clusters) whose characteristics are not yet known but are based on a set of specified variables. This paper used the K-Means algorithm [22], [23], where k=3, n=37, and t=10. This algorithm is very easy to use and implement. It’s time complexity is O(nKt) K<=n, t<=n [10].
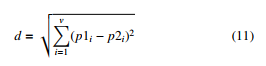
Addition, the Euclidean distance [13] (d) in equation(11) applied to estimate the closest point to the centroid that they helped to check the homogeneity among beliefs. where v is variable, and p is individual belief score.
Algorithm 1: Algorithm:K-MEANS
Input: The number of cluster k, no. of features n, no. of iteration t.
Output: A set of k clusters that minimizes the squared-error criteria.
initialization;
- arbitrarily choose features as the initial clustercenters repeat
- re-assign each feature to the cluster to which thefeature is the most similar;
- based on the mean value of the features in the cluster;
- update the cluster means, i.e., calculate the meanvalue of the features for each cluster;
until no change;
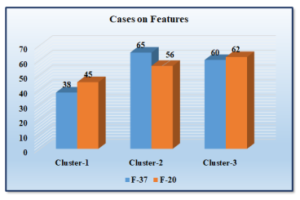
Figure7 displays a segmented count of beliefs that belonged to the respective cluster. With all features (F-37), cluster-1 has 38, cluster-2 has 65, and cluster-3 has 62. After the reduction of features, we see all three clusters segmented stable.
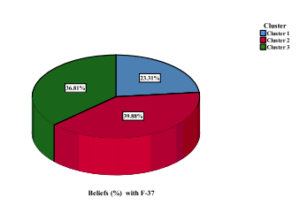
Figure 8: Student’s Beliefs clustered with F-37.
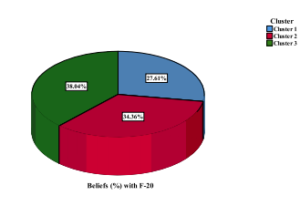
Figure 9: Student’s Beliefs clustered with F-20.
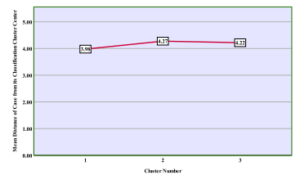
Figure 10: Mean Distance of individual case from centre with F-37.
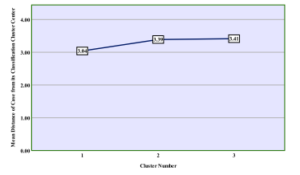
Figure 11: Mean Distance of individual case from centre with F-20
Figure10 shows the individual case mean distance from the clus
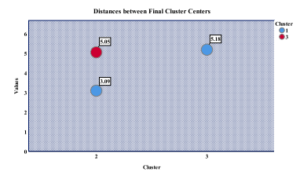
Figure12 visualize the distance between the final cluster centers.
The distance of cluster 1 from cluster 3 is measured by 5.05. We can see the lowest distance of cluster 1 from cluster 2. On this basis, We identified the beliefs in clusters 1 and 2 are mostly positive and high. Further, the beliefs belong to cluster 1, and cluster 2 are heterogeneous type.

Figure 13: Individual cases under cluster.
Figure13 shows the individual case belong to the respective cluster. It is transparent that cluster 3 holds the highest number of instances 61. The cluster 2 holds the 58 cases, and the cluster 1 stores the minimum cases of 47. Thus, no significant difference was observed in the segmentation process.
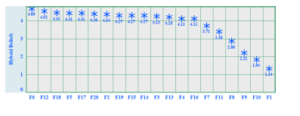
Figure 15: Detection of Hybrid Student’s Belief.
Figure15 visualizes the mixed type of student’s beliefs comes under the mean range of 1.34 to 4.68. For the five features (F1, F8, F9, F10, F11), the mean values are less than 3.5. Therefore, we entitled it a hybrid belief cluster.
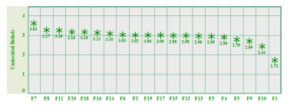
Figure 16: Detection of Undecided Student’s Belief.
Figure.16, displays the beliefs within the mean range of 1.73 to 3.6. All the selected features (F1-F20) have the mean values of less than 3.5. Thus, we named the undecided beliefs cluster.
6. Conclusion
This study used the HC analysis to apply the segmentation of the similar beliefs of Indian students towards the technology. Using the HC approach, we observed two clusters with 100% covered observations. The paper’s results proved that the 50% observations from samples are covering while framing 3 clusters. From the Agglomeration schedule, a drastic change was seen in the HC coefficients after stage 161. We observed almost of students’ agreed towards the available technology at university and found the rapid development in the latest technology. Further, one group of students uses technology appropriately, and the second group uses technology moderate. One group thinks the technology highly benefiting his or her education, and other group remain unsure or opposite the benefits.
Further, few more experiments were performed with the Kmeans algorithm to explore student’s beliefs about the technology. Firstly, it considered all features (F-37) for the clustering and provided acceptable cluster groups. Later, we used significant features (F-20) based on the ANOVA in Table 1. The significance of used features shown with the validation statement (df=162,P<0.05). These features provided three stable dissimilar belief clusters. Based on these clusters, we scattered beliefs in high, hybrid, and undecided clusters.
7. Shortcomings
This paper used a small number of data samples from a specific university. The selected institution was private. The present research approach is confined to the HC analysis with the specific Wards’ method and SED clustering distance measures. We used only the Agglomerative hierarchical procedure. Further, only ANOVA was used as a feature selection method with the K-Means analysis.
8. Future Suggestions
Future work recommended testing the HC algorithm with various cluster formation methods such as Between Group Linkage, Nearest Neighbour, Centroid, and Median.
Future recommendations are provided to apply more feature filter methods such as gain ratio, info gain, correspondence analysis principal components, info-gain [24]. The proposed approach could also be feasible to the public universities with sample enhancement. The results of the paper suggested the target university to focus more on the students who came under the undecided cluster in Fig. 16. Additionally, the target university can also automate this beliefs detection system [1] [2].
Also, We planned to compare the similarity of Indian and Hungarian students’ beliefs towards the latest technology provided using hierarchical and non-hierarchical CA approaches. We also give a significant suggestion to develop real-time automation of homogeneity and heterogeneity in the responses.
Conflict of Interest
The authors declare no conflict of interest.
Acknowledgment
The work of Chaman Verma and Zoltan Ill´ es´ was sponsored by the Hungarian Government and Co-financed by the European Social Fund under the project “Talent Management in Autonomous Vehicle Control Technologies (EFOP-3.6.3-VEKOP16-2017-00001)
- C. Verma, V. Stoffova´, Z. Ille´s, S. Tanwar, N. Kumar, “Machine Learning- based Student’s Native Place Identification for Real-Time,” IEEE Access, 8, 130840–130854, 2020, doi:10.1109/ACCESS.2020.3008830.
- C. Verma, Z. Ille´s, V. Stoffova´, V. Bakonyi, “Opinion Prediction of Hungar- ian Students for Real-Time E-Learning Systems: A Futuristic Sustainable Technology-Based Solution,” Sustainability, 1–16, doi:10.3390/su12166321.
- S. Patel, S. Sihmar, A. Jatain, “A study of hierarchical clustering algo- rithms,” in 2015 2nd International Conference on Computing for Sustain- able Global Development (IEEE-INDIACom), 537–541, 2015, doi:https://ieeexplore.ieee.org/document/7100308.
- K. Sasirekha, P. Baby, “Agglomerative Hierarchical Clustering Algorithm-A Review,” International Journal of Scientific and Research Publications, 1–3, doi:http://www.ijsrp.org/research-paper-0313.php?rp=P15831.
- M. Yang, “A Survey of hierarchical clustering,” International Journal of Scien- tific and Research Publications, 1–16.
- R. Abe, S. Miyamoto, Y. Endo, Y. Hamasuna, “Hierarchical clustering algo- rithms with automatic estimation of the number of clusters,” in 2017 Joint 17th World Congress of International Fuzzy Systems Association and 9th Interna- tional Conference on Soft Computing and Intelligent Systems (IFSA-SCIS), 1–5, 2017, doi:10.1109/IFSA-SCIS.2017.8023241.
- M. K. Rafsanjani, Z. A. Varzaneh, N. E. Chukanlo, “A survey of hierarchical clustering algorithms,” The Journal of Mathematics and Computer Science, 229–240, doi:10.22436/jmcs.05.03.11.
- E. Daniati, “Decision Support System to Deciding Thesis Topic,” in 2017 Inter- national Seminar on Application for Technology of Information and Communi- cation (iSemantic), 52–57, 2017, doi:10.1109/ISEMANTIC.2017.8251843.
- L. Huang, “Teaching Management Data Clustering Analysis and Implemen- tation on Ideological and Political Education of College Students,” in 2016 International Conference on Smart Grid and Electrical Automation, 308–311, 2016, doi:10.1109/ICSGEA.2016.61.
- L. Jing, “Ideological and Political Education Management Research based on Improved K-means Clustering,” in 2016 International Conference on Robots & Intelligent System, 213–216, 2016, doi:10.1109/ICRIS.2016.114.
- J. Jamesmanoharan, S. H. Ganesh, M. L. P. Felciah, A. K. Shafreenbanu, “Ide- ological and Political Education Management Research based on Improved K-means Clustering,” in 2014 World Congress on Computing and Communica- tion Technologies, 200–202, 2014, doi:10.1109/WCCCT.2014.75.
- R. Ahlawat, S. Sahay, S. Sabitha, A. Bansal, “Analysis of factors affecting enrollment pattern in Indian universities using k-means clustering,” in 2014 World Congress on Computing and Communication Technologies, 321–326, 2016, doi:10.1109/INCITE.2016.7857639.
- M. Cao, Q. Zhang, “A Empirical Study of Programming Behaviours on Large Scale Online Learning,” in 2019 14th International Conference on Computer Science & Education (ICCSE), 889–894, 2019, doi:10.1109/INCITE.2016. 7857639.
- R. Saptono, H. Setiadi, T. Sulistyoningrum, E. Suryani, “Examiners Rec- ommendation System at Proposal Seminar of Undergraduate Thesis by Us- ing Content-based Filtering,” in 2018 International Conference on Advanced Computer Science and Information Systems (ICACSIS), 265–269, 2018, doi: 10.1109/ICACSIS.2018.8618224.
- G. Shidhaganti, A. Patil, “Unsupervised Techniques to Develop a Social Net- working Platform in an Educational Institute,” in 2019 IEEE Tenth Interna- tional Conference on Technology for Education (T4E), 246–247, 2019, doi: 10.1109/T4E.2019.00057.
- H. Sun, Z. Shao, “Research on the Application of Students’Answered Record Analyze Model and Question Automatic Classify Based on K-Means Clustering Algorithm,” in 2019 10th International Conference on Informa- tion Technology in Medicine and Education (ITME), 494–497, 2020, doi: 10.1109/ITME.2019.00116.
- Y. Zhu, S. Gao, “A Study of the Reading Behavior of University Students,” in 2018 9th International Conference on Information Technology in Medicine and Education (ITME), 357–361, 2018, doi:10.1109/ITME.2018.00086.
- C. Verma, V. Stoffova´, Z. Ille´s, “Prediction of students’ awareness level towards ICT and mobile technology in Indian and Hungarian University for the real- time: preliminary results,” Heliyon, 1–9, doi:10.1016/j.heliyon.2019.e01806.
- G. Ward, J. J. H., “Hierarchical Grouping to Optimize an Objective Function,” Journal of the American Statistical Association, 236–244, doi:10.22436/jmcs. 05.03.11.
- “SAS, url = https://v8doc.sas.com/sashtml/stat/chap23/sect12.htm, urldate =2020-07-21, year = 2020,” .
- T. Strauss, M. J. von Maltitz, “Generalising Ward’s Method for Use with Manhattan Distances,” PLOS ONE, 1–21, doi:10.1371/journal.pone.0168288.
- L. Ye, C. Qiu-ru, X. Hai-xu, L. Yi-jun, Y. Zhi-min, “Telecom Customer Segmentation with K-means Clustering,” in The 7th International Confer- ence on Computer Science & Education (ICCSE 2012), 648–651, 2012, doi: 10.1109/ICCSE.2012.6295158.
- H. Jia-wei, M. Kamber, Data mining-concepts and techniques, Higher educa- tion press, 2001.
- C. Verma, V. Stoffova´, Z. Ille´s, “Prediction of residence country of student towards information, communication and mobile technology for real-time: pre- liminary results,” Procedia Computer Science, 224–234, doi:10.1016/j.procs.
Citations by Dimensions
Citations by PlumX
Google Scholar
Scopus
Crossref Citations
No. of Downloads Per Month
No. of Downloads Per Country