Finding Association Patterns of Disease Co-occurrence by using Closed Association Rule Generation

Adv. Sci. Technol. Eng. Syst. J. 5(5), 645–651 (2020);
 DOI: 10.25046/aj050579
This paper proposes a closed association rule generation technique to investigate the association patterns of diseases that are frequent co-occurrence. Diseases records of 5,000 patients are studied to find the association patterns of disease co-occurrence. The CHARM algorithm is adapted to find frequent diseases that can cover all-important patterns with a small number. Then the association patterns of disease co-occurrence are created in a form of association rules from the frequent diseases. The rules represent diseases associated with other diseases. Accuracy and prediction ratio are defined to evaluate the generated association patterns. From the experimental results, the generated association patterns give 79.76% of accuracy and 84.03% of prediction ratio although the number of generated association patterns is small. Moreover, the top-10 association patterns of disease co-occurrence are investigated. Besides, the 5 most frequent diseases are found to deeply study the other related diseases of them. From the investigation, we found that diabetes mellitus, metabolic disorders, and renal failure are highly related to hypertensive diseases with 88.81% of confidence. In addition, we found that influenza and pneumonia, plastic and other anemias are highly related to metabolic disorders.
1. Introduction
The death of people is mostly caused by diseases. Diseases are social and economic problems in the world. A lot of money is paid for treating diseases. If a disease is early detected, people can prevent themselves from the disease. Detecting a disease can be found from other related diseases. Finding association patterns among these diseases is very challenging work in the domains of biology and medicine. The study of the association of diseases not only helps people to understand the relation of diseases but also leads to improvement in clinical manifestation, etiology, pharmacology, and epidemiology. Many techniques were proposed to study the association of diseases, such as network techniques, graph theory, network science, statistical methods, and mathematical modeling. They are studied based on microbes, disease-related genes, microRNAs (miRNA), disease-related metabolic reactions, and electronic medical records. [1].
Association rule mining is a technique that has been widely used in the clinical domain. It is applied to find association patterns of diseases, such as finding the relation of metabolic syndrome and other diseases [2], finding the relation of the disease and medicines [3], and finding the relation of factors and disease [4].
Unlike the previous works, we propose to investigate association patterns of disease co-occurrence based on closed association rule mining that will generate a small number of patterns with coverage of all-important patterns. The association patterns of disease co-occurrence are investigated from electronic medical records in Thailand. First, frequent diseases are generated based on closed itemset mining. Then they are used to generate closed association rules for representing association patterns of disease co-occurrence. Moreover, the sorting method is presented to select the top-k association patterns of disease co-occurrence for investigating diseases that are highly related to each other. Also, the most frequent diseases are found and explored other diseases that are related to them.
The rest of this paper is organized as follows: Section 2 mentions to related works. Section 3 gives the concept of closed association rule mining. Section 4 explains the overall proposed methodology. Section 5 gives the details of the experimental setup and experimental results. Finally, the conclusion is provided in Section 6.
2. Related Work
Finding the association of diseases has been widely studied in the domains of biology and medicine. It is investigated with different datasets and different techniques, such as network techniques, graph theory, network science, statistical methods, and mathematical modeling. For example, in [5] proposed a microbe-based human disease network based on the text mining process. The network is constructed from the microbe-disease association dataset. It is investigated to find relationships between microbes and disease genes, symptoms, chemical fragments, and drugs. Cosine similarity is employed to identify the similarity between two diseases. In [6] proposed a disease-related gene mining method based on a weekly supervised learning model. The method consists of two parts, First, the differentially expressed gene set is screen based on the weakly supervised learning model. Second, a support vector machine is adopted to predict the disease-related genes in the differentially expressed gene set. The method verified the validity and accuracy of the method. In [7] proposed similarity computations to predict the associations between miRNAs and diseases. The similarity among miRNAs is computed based on the sequence and function information of miRNAs. The similarity among diseases is computed based on the semantic and function information of disease. Then the data sources are integrated by using the kernelized Bayesian matrix factorization method to infer potential miRNA-disease associations. The unknown miRNA-disease associations were effectively predicted from the method.
Association rule mining is a popular technique that was exploited in the medical domain. For example, in [2] adopted association rule mining to study metabolic syndrome that is related to other diseases and to understand the strength of association between diabetes mellitus, hypertension, and hyperlipidemia on patient’s records in Taiwan. From the study, it was found that diabetes mellitus is related to oral diseases and blear eyes. Patients with metabolic syndrome have a higher connection with liver diseases than patients with diabetes mellitus. In [3] analyzed patient prescriptions to identify the relationship between the disease and medicines that are used to treat the patient’s illness. The patient prescription datasets in 2015 and 2016 from two hospitals are collected to find the relationship. First, the top 10 diseases are clustered by the K-means algorithm. Next, the Apriori algorithm is applied to find the relationship between diseases and medicines. In [4] applied association rule mining to detect factors that contribute to heart disease for males and females on the UCI Cleveland dataset. Three algorithms, Apriori, Predictive Apriori, and Tertius, are investigated to identify the factors. From the investigation, females are at higher risk than males to be heart disease.
From previous works, association patterns of diseases are studied based on numerous factors such as genetics, metabolites, microbes, and miRNAs. In the real world, those factors are hard to understand and to access for people who are not in the domains of biology and medicine. Finding association patterns of diseases from a disease dataset is an easy way. The disease dataset can find out from the electronic medical records of patients. Besides, studying association patterns from medical records of patients in each area may get different knowledge. In this paper, association patterns of disease co-occurrence are investigated on a disease dataset that is retrieved from electronic medical records in Thailand. A closed association rule generation technique is proposed to investigate the association patterns of disease co-occurrence.
3. Closed Association Rule Mining
Association rule mining is a popular technique in data mining and has been widely used in many applications with several domains. It discovers the relationship between items in a large dataset. The basic definition of association rule mining can be explained as follows.
Let I = {i1, i2, …, im} be a finite set of items in a database and D = {d1, d2, …, dm} be a set of transactions in the database, where each transaction represents a set of items. X and Y are itemsets, where X, Y Í I. The support of X is the number of transactions containing X, denoted as supp(X). The length of X is the number of items in X. An association rule r: X®Y is a relationship between itemset X and Y, where XÇY=Æ. X is called the antecedent of rule and Y is called the consequent of rule. The support of association rule r is defined as supp(XÈY). The confidence of association rule r is defined as conf(r) = supp(XÈY)/supp(X). The problem of association rule mining is to find all association rules passing minimum support threshold (min_supp) and minimum confidence threshold (min_conf).
The process for mining association rules consists of two main steps. The first step is to mine frequent itemsets having support no less than the minimum support threshold. The second step is the generation of association rules. Association rules are generated from frequent itemsets having length≥2. Frequent itemset X having length l will be possibly generated 2l-2 rules that is the number of subsets of X. For example, X = (ACF). The length of X is 3 and the set of subsets of X is {A, C, F, AC, AF, CF}. Therefore, the number of association rules is 23 – 2 = 6. They are A®CF, C®AF, F®AC, AC®F, AF®C, and CF®A. The confidence value of each rule will be calculated and a rule having confidence no less than the minimum confidence threshold will be selected as an interesting rule.
The important step of association rule mining is frequent itemset mining. Many algorithms were proposed for finding frequent itemsets, such as Apriori [8], FP-Growth [9], Ecat [10], DFIN [11], NegFIN [12]. However, a large number of frequent itemsets may be generated if a low minimum support threshold is given or a large dataset is mined. Then a large number of association rules are also generated. Closed itemset mining was proposed to reduce the number of frequent itemsets. It mines frequent itemset having no superset with the same support. Closed frequent itemsets are sufficient to mine association rules. All non-redundant association rules will be found from closed itemsets and cover the rules generated from frequent itemsets [13]. Thus, many redundant rules can be eliminated. The concept of closed itemset is based on the two following functions f and g as defined in Eq. (1) and Eq. (2).
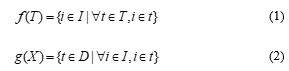
Function f returns the set of itemsets included in all the transactions in T, where , while function g returns the set of transactions supporting a given itemset X. X is called closed itemset if The set of closed itemsets is defined as Eq. (3), where FI is a set of frequent itemsets.
![]()
For example, if a set of frequent itemset is FI = {(D):2, (FD):2, (B):2, (F):3, (AF):2, (CF):2, (ACF):2, (C):3, (AC):3, (A):3}. The set of closed itemset is CI = {(FD):2, (B):2, (F):3, (ACF):2, (AC):3} because (D):2 is subset of (FD):2 with the same support, so it is not a closed itemset. (AF):2 and (CF):2 are subsets of (ACF):2 with the same support, so they are not closed itemsets. (C):3 and (A):3 are subsets of (AC):3 with the same support, so they are not closed itemsets. In conclusion, closed itemsets are non-redundant patterns and cover all important patterns. Many algorithms were proposed to find closed itemsets, such as CHARM [14], DCI_CLOSED [15], and LCM [16].
4. Proposed Methodology
4.1. Data Collection and Preparation
The dataset is collected from a hospital database, Thailand. It is retrieved from disease records of patients who are over 30 years olds. The dataset consists of ICD-10 codes of 5,000 patients. Each transaction is ICD-10 codes of a patient. To reduce various ICD-10 codes, ICD-10 codes are grouped [17] and represented by numbers according to Table 1. For example, A00-A09 are grouped in the same category and represented as 1. The dataset is represented as number format because it is easily cleaned and computed for finding association patterns. The dataset is cleaned by removing duplicated numbers of each transaction. After the cleaning process, each transaction contains unique numbers that represent the disease occurrence of a patient. Finally, the characteristic of the dataset is shown in Table 2. An example dataset is shown in Figure 1.
Table 1: ICD-10 Category
| ID | ICD-10 | Meaning |
| 1 | A00-A09 | Intestinal infectious diseases |
| 2 | A15-A19 | Tuberculosis |
| 3 | A20-A28 | Certain zoonotic bacterial diseases |
| 4 | A30-A49 | Other bacterial diseases |
| 5 | A50-A64 | Infections with a predominantly sexual mode of transmission |
| 6 | A65-A69 | Other spirochetal diseases |
| … | … | … |
| 222 | Y90-Y98 | Supplementary factors related to causes of morbidity classified elsewhere |
Table 2: The Characteristic of the Dataset
| Characteristic | Count |
| The total number of diseases | 202 |
| The total number of patients | 5,000 |
| The maximal number of diseases that occurs in a patient | 56 |
| The minimal number of diseases that occurs in a patient | 6 |
| The average number of diseases that occurs in a patient | 11 |
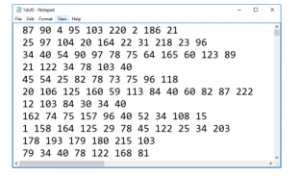
Figure 1: An Example Dataset
4.2. Finding Frequent Diseases
Closed itemset mining is adopted to find frequent diseases because it can generate non-redundant diseases with long disease co-occurrence and coverage of all-important patterns. The diseases with a certain frequency will be selected. The minimum support threshold is used as a filter to select interesting patterns of disease co-occurrence. A disease is considered as an item. All frequent diseases are found based on the CHARM algorithm [14] because CHARM can generate non-redundant frequent diseases with effective of computation time. It uses both itemsets and transaction ids to reduce the search space. Moreover, diffsets and a hash-based approaches are quickly exploited to remove redundant frequent diseases.
The CHARM algorithm firstly constructs an IT-tree that each node is represented by a pair of an itemset and a set of transaction ids. Then it performs a bottom-up depth-first search on the tree to find frequent itemsets. As soon as a frequent itemset X is generated, a set of transaction ids of X is compared with those of other itemsets having the same parent. If the set of transaction ids of X includes the set of transaction ids of the other itemsets, X and the other itemsets are merged to be closed itemsets because they are the same equivalence class. The idea for generating closed itemsets and eliminating non-closed itemsets is based on the following properties.
- If This property implies that X can be replaced by and Y is removed from further consideration.
- If This property implies that very occurrence of X can be replaced by but Y cannot be removed because it will generate a different closed itemset.
- If This property implies that very occurrence of Y can be replaced by but X cannot be removed because it will generate a different closed itemset.
- If X and Y are not the same equivalence class so that they will be considered to generate closed itemsets.
4.3. Finding Association Patterns of Disease co-occurrence
After finding all frequent diseases, frequent diseases having length no less than two will be used to find the association patters of disease co-occurrence. An association pattern of disease co-occurrence is in form rule X®Y, where X and Y are frequent diseases. The minimum confidence threshold is used to filter interesting association patterns. The association patterns of disease co-occurrence are discovered based on the Faster algorithm [8]. The idea of the Faster algorithm is trying to avoid the generation of rules that do not meet the minimum confidence threshold. If a rule (I – X) ® X passes the minimum confidence threshold then all rules (I – Y) ® Y will also pass the minimum confidence threshold, where Y Ì X. If a rule (I – Y) ® Y does not pass the minimum confidence threshold, the rule (I – X) ® X will not pass the minimum confidence threshold. This is because supp(I – X) ≥ supp(I – Y) and then the confidence of (I – X) ® X is not more than the confidence of (I – Y) ® Y. For example, AC®F does not pass the minimum confidence threshold. A®CF and C®AF will not pass the minimum support threshold because of FÌCF and FÌAF. Therefore, A®CF and C®AF do not need to generate and compute their confidence.
4.4. Finding Top-k Association Patterns of Disease co-occurrence
After finding all association patterns that pass the minimum confidence threshold, the association patterns will be sorted and selected the top-k association patterns of disease co-occurrence. Given two association patterns, ri and rj, ri has higher precedence than rj if the following conditions hold:
- or
- if but ; or
- if but , i.e., length of antecedent of ri is larger than rj.
The confidence value is considered as the first priority because it shows how much diseases are related to other diseases. High confidence shows that disease(s) Y is strongly related to disease(s) X. The support value is considered as the second priority because it shows how many patients occur an association pattern of disease co-occurrence. High support shows diseases that occur together in many patients. Next, the length of association pattern is considered as the third priority. The long pattern gives more information than the short one.
4.5. Evaluation Matrix
This paper aims to find association patterns of disease co-occurrence. To evaluate association patterns generated from the proposed method, the dataset is divided into a training set and a testing set by using the 10-fold cross-validation. For each fold, the training set is used to create a predictor that consists of association patterns, represented as rules. The consequent of the rule is considered as predicted diseases. The testing set is used to evaluate the predictor. Two matrixes, prediction ratio and accuracy, are defined to evaluate the effectiveness of the generated association patterns.
A prediction ratio is defined as Predict = |P|/|A|, where |P| is the number of predicted diseases correctly and |A| is the total number of the antecedent of rules appears in the testing set. Accuracy is defined as Accuracy = |C|/|T|, where |C| the number of matching rules in the testing set and |T| is the number of transactions in the testing set.
5. Performance Evaluation
5.1. Experiment Setup
To investigate the association patterns of disease co-occurrences on electronic medical records, four experiments are conducted. All experiments are implemented by JAVA and use the library in SPMF[18]. The details of the experiments are explained as follows.
The first experiment is conducted to compare the performance of CHARM with a well-known algorithm, call FP-Growth, when generating frequent diseases on the whole dataset with different minimum support thresholds. The minimum support thresholds are set from 1% to 10%. Both algorithms are evaluated by using the number of frequent diseases and computation time.
The second experiment is conducted to investigate the number of association patterns, accuracy, and prediction ratio when using different minimum support thresholds and different minimum confidence thresholds. To reliable results in the medical domain, the minimum support thresholds are set to 10%, 20%, 30%, and the minimum confidence thresholds are set to 60%, 70%, 80%, 90%. The dataset is divided into a training set and a testing set by using the 10-fold cross-validation. The number of association patterns, accuracy, and prediction ratio are reported on average.
The third experiment is conducted to discover the top-10 association patterns of disease co-occurrences from the whole dataset. The minimum support threshold is set to 10%. Then the top-10 association patterns of disease co-occurrences are selected by using the sorting method as explained in section 4.4. The fourth experiment is conducted to find the 5 most frequent diseases in the whole dataset. Then top-3 association patterns are selected to investigate other related diseases of the 5 most frequent diseases.
5.2. Experimental Results
Table 3 reports the number of frequent diseases that are generated on the dataset by using CHARM and FP-Growth. It shows that CHARM gives a smaller number of frequent diseases than FP-Growth when minimum support is set to 1%. Both algorithms generate the same frequent diseases when the minimum support threshold is more than 1%. However, the computation time of CHARM outperforms FP-Growth and almost steady although the minimum support threshold is small as shown in Figure 2. Therefore, the CHARM algorithm is selected for finding frequent diseases in our work.
Table 3: Comparing the Number of Frequent Diseases
| min_supp(%) | The number of frequent diseases | |
| CHARM | FP-Growth | |
| 1 | 7,015 | 7,025 |
| 2 | 1,885 | 1,885 |
| 3 | 861 | 861 |
| 4 | 502 | 502 |
| 5 | 327 | 327 |
| 6 | 216 | 216 |
| 7 | 158 | 158 |
| 8 | 128 | 128 |
| 9 | 105 | 105 |
| 10 | 81 | 81 |
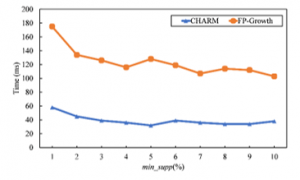
Figure 2: Computation Time of CHARM and FP-Growth
In Table 4, it reports the number of association patterns when different minimum support thresholds and different minimum confidence thresholds are given. The number of association patterns is reduced when the minimum support thresholds and the minimum confidence thresholds are increased. No association pattern is found when minimum confidence threshold is set to 90% so the accuracy and prediction ratio are not evaluated with 90% of minimum support threshold. Table 5 reports the accuracies. It shows that the highest accuracy is 79.76% when minimum support threshold and minimum confidence threshold are set to 10% and 60%, respectively. When minimum support threshold and minimum confidence threshold are increased, the accuracies will be reduced because the number of association patterns is also reduced and then the number of matching patterns in the testing set is small. In Table 6, the most prediction ratios are high although the number of association patterns is very small because the association patterns are created from the most frequent diseases that are strongly related together.
Table 4: The Number of Association Patterns of Disease Co-occurrence
| min_conf(%)
min_supp(%) |
60 | 70 | 80 | 90 |
| 10 | 59
|
38 | 19 | 0 |
| 20 | 12 | 9 | 3 | 0 |
| 30 | 4 | 3 | 1 | 0 |
Table 5: Accuracy (%)
| min_conf(%)
min_supp(%) |
60 | 70 | 80 |
| 10 | 79.76 | 74.32 | 56.82 |
| 20 | 71.42 | 71.20 | 41.26 |
| 30 | 59.23 | 58.08 | 34.03 |
Table 6: Prediction Ratio (%)
| min_conf(%)
min_supp(%) |
60 | 70 | 80 |
| 10 | 81.04 | 80.03 | 82.56 |
| 20 | 77.53 | 82.77 | 79.30 |
| 30 | 69.70 | 84.03 | 80.58 |
Table 7: Top-10 Association Patterns of Disease Co-occurrence
| Rank | Association pattern | No. of patients | Confidence (%) |
| 1 | Diabetes mellitus, Metabolic disorders, Renal failure ==> Hypertensive diseases | 683 | 88.81 |
| 2 | Diabetes mellitus, Renal failure ==> Hypertensive diseases | 800 | 87.62 |
| 3 | Hypertensive diseases, Influenza and pneumonia ==> Metabolic disorders | 526 | 86.22 |
| 4 | Diabetes mellitus, Hypertensive diseases, Renal failure ==> Metabolic disorders | 683 | 85.37 |
| 5 | Aplastic and other anemias, Diabetes mellitus ==> Metabolic disorders | 584
|
85.25 |
| 6 | Aplastic and other anemias, Hypertensive diseases, Renal failure ==> Metabolic disorders | 504 | 85.13 |
| 7 | Aplastic and other anemias, Renal failure ==> Metabolic disorders | 640 | 84.76 |
| 8 | Diabetes mellitus, Renal failure ==> Metabolic disorders | 769 | 84.22 |
| 9 | Diabetes mellitus, General symptoms and signs ==> Metabolic disorders | 555 | 84.09 |
| 10 | Aplastic and other anemias, Diabetes mellitus ==> Hypertensive diseases | 574 | 83.79 |
Table 8: The 5 Most Frequent Diseases and Related Diseases
| Disease | No. of patients | Association pattern |
| Metabolic disorders | 3,288 | 1. Hypertensive diseases, Influenza and pneumonia ==> Metabolic disorders
(support = 526, confidence = 86.22%) 2. Diabetes mellitus, Hypertensive diseases, Renal failure ==> Metabolic disorders (support = 683, confidence = 85.37%) 3. Aplastic and other anemias, Diabetes mellitus ==> Metabolic disorders (support = 584, confidence = 85.25%) |
| Hypertensive diseases | 2,599 | 1. Diabetes mellitus, Metabolic disorders, Renal failure ==> Hypertensive diseases
(support = 683, confidence = 88.81%) 2. Diabetes mellitus, Renal failure ==> Hypertensive diseases (support = 800, confidence = 87.62%) 3. Aplastic and other anemias, Diabetes mellitus ==> Hypertensive diseases (support = 574, confidence = 83.79%) |
| Diabetes mellitus | 1,953 | 1. Metabolic disorders, Hypertensive diseases, Renal failure ==> Diabetes mellitus
(support = 683, confidence = 74.72%) 2. Hypertensive diseases, Renal failure ==> Diabetes mellitus (support = 800, confidence = 71.49%) 3. Metabolic disorders, Renal failure ==> Diabetes mellitus (support = 769, confidence = 63.92%) |
| General symptoms and signs | 1,734 | 1. Other diseases of the respiratory system ==> General symptoms and signs
(support = 321, confidence =55.15%) 2. Metabolic disorders, Other diseases of the respiratory system ==> General symptoms and signs (support = 274, confidence =57.44%) 3. Influenza and pneumonia, Renal failure ==> General symptoms and signs (support = 252, confidence = 52.39%) |
| Renal failure | 1,500 | 1. Aplastic and other anemias, Metabolic disorders, Hypertensive diseases ==> Renal failure
(support = 504, confidence = 71.59%) 2. Aplastic and other anemias, Hypertensive diseases ==> Renal failure (support = 592, confidence = 68.91% 3. Metabolic disorders ==> Renal failure (support = 640, confidence = 60.09%) |
Table 7 shows the top-10 association patterns of disease co-occurrence. From the top-10 association patterns of disease co-occurrence, most of top-10 association patterns are similar. For example, the first rank shows that if a patient has diabetes mellitus, metabolic disorders, and renal failure, then the patient has a chance to be hypertensive diseases with 88.81% of confidence. The second rank shows that if a patient has diabetes mellitus and renal failure, then the patient has a chance to be hypertensive diseases with 87.62% of confidence. We can conclude that diabetes mellitus, metabolic disorders, renal failure and hypertensive diseases are highly related together. In addition, we found that influenza and pneumonia, plastic and other anemias are highly related to metabolic disorders.
Table 8 shows the 5 most frequent diseases and other related diseases that are represented in association patterns. The 5 most frequent diseases are metabolic disorders, hypertensive diseases, diabetes mellitus, general symptoms and signs, and renal failure. The most frequent disease is metabolic disorders. 3,288 patients or 65.76% of the dataset have metabolic disorders. Hypertensive diseases, influenza and pneumonia, diabetes mellitus, renal failure, and aplastic and other anemias are highly related to metabolic disorders with more than 85% of confidence.
6. Conclusion
In this paper, we proposed a technique to find the association patterns of disease co-occurrence based on closed association rule mining. Closed itemset mining is applied to find frequent diseases. Then the frequent diseases are used to create association patterns of disease co-occurrence. The association patterns are sorted to select top-10 association patterns of co-occurrence. Moreover, the 5 most frequent diseases and other related diseases are discovered. From experiment results, they show that the association patterns of disease co-occurrence give high accuracy if the number of association patterns is large. The prediction ratio is high although the number of association patterns is very small because the association patterns are created from the most frequent diseases that are metabolic disorders, hypertensive diseases, diabetes mellitus, and renal failure. From the investigation of association patterns, we found that diabetes mellitus, metabolic disorders, and renal failure and hypertensive diseases are highly related together. Moreover, influenza and pneumonia, plastic and other anemias are highly related to metabolic disorders.
Acknowledgment
This research project was financially supported by Faculty of Informatics, Mahasarakham University 2020. We would like to thank Mahasarakham hospital for the dataset.
- Z. Batool, M. Usman, K. Saleem, M. Abdullah-Al-Wadud, F.-e. Amin, and A. Al-Eliwi, “Disease–disease association using network modeling: challenges and opportunities,” Journal of Medical Imaging and Health Informatics, Vol. 8, 627-638, 2018. https://doi.org/10.1166/jmihi.2018.2342
- C. Chan, C. Chen, and B. Liu, “Discovery of association rules in metabolic syndrome related diseases.”, in IEEE International Joint Conference on Neural Networks (IEEE World Congress on Computational Intelligence), 856-862, 1-8 June 2008. https://doi.org/10.1109/IJCNN.2008.4633898
- M. Harahap, A. M. Husein, S. Aisyah, F. R. Lubis, and B. A. Wijaya, “Mining association rule based on the diseases population for recommendation of medicine need,” Journal of Physics: Conference Series, Vol. 1007, 1-11, 2018. https://doi.org/10.1088/1742-6596/1007/1/012017
- I. T. T. K. S. Nahar Jesmin, and Y.-P. Phoebe Chen, “Association rule mining to detect factors which contribute to heart disease in males and females,” Expert Systems with Applications, Vol.40, No. 4, 1086 – 1093, 2013. https://doi.org/10.1016/j.eswa.2012.08.028
- W. Ma, L. Zhang, P. Zeng, C. Huang, J. Li, B. Geng, J. Yang, W. Kong, X. Zhou, and Q. Cui, “An analysis of human microbe-disease associations,” Briefings in bioinformatics, Vol. 18, 85-97, 2017. https://doi.org/10.1093/bib/ bbw005
- H. Zhang, X. Huo, X. Guo, X. Su, X. Quan, and C. Jin, “A disease-related gene mining method based on weakly supervised learning model,”, BMC Bioinformatics , Vol. 20, 169-174, 2019. https://doi.org/10.1186/s12859-019-3078-9
- W. Lan, J. Wang, M. Li, J. Liu, F. Wu, and Y. Pan, “Predicting microRNA-disease associations based on improved microRNA and disease similarities,” IEEE/ACM Transactions on Computational Biology and Bioinformatics, Vol. 15, No. 6, 1774-1782, 2018. https://doi.org/10.1109/TCBB.2016.2586190
- R. Agrawal, and R. Srikant, “Fast algorithms for mining association rules,” in 20th International Conference Very Large Data Bases VLDB, Vol. 1215, 487-489, 2000. https://doi.org/10.1007/BF0294884
- J. Han, J. Pei, Y. Yin, and R. Mao, “Mining frequent patterns without candidate generation: a frequent-pattern tree approach,” Data Mining and Knowledge Discovery, Vol. 8, No. 1, pp. 53-87, 2004. https://doi.org/ 10.1023/B:DAMI.0000005258.31418.83
- M. J. Zaki, “Scalable algorithms for association mining,” IEEE Transactions on Knowledge and Data Engineering, Vol. 12, No. 3, 372-390, 2000. https://doi.org/10.1109/69.846291
- Z.-H. Deng, “DiffNodesets: An efficient structure for fast mining frequent itemsets,” Applied Soft Computing, Vol. 41, 214-223, 2016. https://doi.org/ 10.1016/j.asoc.2016.01.010
- N. Aryabarzan, B. Minaei-Bidgoli, and M. Teshnehlab, “negFIN: An efficient algorithm for fast mining frequent itemsets,” Expert Systems with Applications, Vol. 105, 129-143, 2018. https://doi.org/10.1016/ j.eswa.2018.03.041
- M. Zaki, “Closed itemset mining and non-redundant association rule mining,” Encyclopedia of Database Systems, 365-368, 2009. https://doi.org/10.1007/ 978-0-387-39940-9_66
- M. Zaki, and C.-J. Hsiao, “CHARM: An efficient algorithm for Closed Itemset Mining,” in the 2002 SIAM International Conference on Data Mining, 457-473, 2002. https://doi.org/10.1137/1.9781611972726.27
- C. Lucchese, S. Orlando and R. Perego, “Fast and memory efficient mining of frequent closed itemsets,” IEEE Transactions on Knowledge and Data Engineering, Vol. 18, No. 1, 21-36, 2006. https://doi.org/10.1109/ TKDE.2006.10
- T. Uno, M. Kiyomi, and H. Arimura, “LCM ver. 2: Efficient mining algorithms for frequent/closed/maximal itemsets,” in Proceeding of IEEE ICDM Workshop on Frequent Itemset Mining Implementations, Brighton, UK, November 1, 1-11, 2004. https://doi.org/10.1.1.108.155
- W. H. Organization, “ICD-10 Version:2019,” International Statistical Classification of Diseases and Related Health Problems, 2019.
- P. Fournier-Viger, J. C.-W. Lin, A. Gomariz, T. Gueniche, A. Soltani, Z. Deng, and H. T. Lam, “The SPMF Open-Source Data Mining Library Version 2,” Machine Learning and Knowledge Discovery in Databases, Lecture Notes in Computer Science, vol. 9853, 36-40, 2016. https://doi.org/10.1007/978-3-319-46131-1_8
No related articles were found.