A Typological Study of Portuguese Mortality from Non-communicable Diseases
 , Cristina Prudêncio 2, Mónica Vieira 3, Rui Pimenta 4, Helena Bacelar-Nicolau 5
Adv. Sci. Technol. Eng. Syst. J. 5(5), 613–619 (2020);
 DOI: 10.25046/aj050575
The most common non-communicable diseases, such as cardiovascular diseases and cancer, are a problem in global and national growth. The World Health Organization considers it a priority to study the specific causes of these diseases for trend monitoring. The aim of this paper is to identify a hierarchy of clusters of Portuguese mortality by non-communicable diseases using the agglomerative hierarchical cluster analysis. The Euclidean distance with complete linkage and average linkage criteria are used. These methods identify six clusters with both criteria, indicating some order of disease severity in the way clusters joint together. Special attention should be given to diseases in the last two clusters, where the last one is formed by ischemic heart disease, cerebrovascular diseases and larynx / trachea / bronchi and lung malignant tumor, all for males. In fact, these clustering results show that male gender seems to be a risk factor for at least two groups of the non-communicable diseases. Other suggested risk factors and / or pathophysiological mechanisms that in a direct or indirect way may enhance the common development of the pathologies found in the clusters arising from this study should also be an object of priority study.
1. Introduction
An important challenge of Public Health in Portugal is to decrease the number of deaths from Non-communicable diseases. In order to generate additional information in this domain, this paper is an extension of work originally presented in 14th Iberian Conference on Information Systems and Technologies [1].
According to the World Health Organization (WHO), the number of people who will suffer from the most common non-communicable diseases, including cardiovascular disease, cancer, or chronic respiratory diseases, will increase [2]. Non-communicable diseases are a worldwide and national problem and Public Health concerns [2], [3]. The study of non-communicable diseases is a matter of major importance in the world and in particular in Portugal [4], [5]. According to the Directorate General for Health (DGS) cardiovascular diseases and major cancers are mostly responsible for the lost years of life in the Portuguese population aged 35 and over [6]. The mortality rates of lung tumor malignant and rectal tumor malignant are increasing in Portugal [6]. Decreasing mortality from cancer is the biggest challenge for the next generations because cancer is the leading cause of early mortality [7]. The decrease in early mortality is relevant due to its individual and social impact [2]. Thus, according to WHO, it is of great importance to generate additional knowledge on the specific causes of these diseases, in order to monitor their trends [4]. Therefore, different studies are fundamental to analyze diseases evolution that might help to formulate hypotheses about risk factors and / or common pathophysiological mechanisms that, directly or indirectly, may enhance the common development of pathologies found in clusters, resulting from the hierarchy of non-communicable disease partitions, as this may be a working tool in health [8][9]. Unsupervised data analysis, namely cluster analysis, then can be useful to raise hypotheses about clusters of non-communicable diseases to be studied.
The development of the clustering analysis methodology is truly interdisciplinary. Taxonomists, social scientists, health scientists, psychologists, biologists, statisticians, mathematicians, engineers, medical researchers, computer scientists and others all contribute to the development of this methodology [10], [11]. Clustering analysis is a set of exploratory multivariate data analysis methods for identifying natural clusters in the data, based on a coefficient of similarity or dissimilarity between individuals or between variables, or more generally between statistical units of data [12]-[14]. This methodology aims to find homogeneous groups of statistical units in the data, where similarities between statistical units belonging to the same group are high and similarities between statistical units belonging to distinct groups are low [10], [12]-[14]. Hierarchical cluster analysis algorithms, both agglomerative and divisive, provide a hierarchy of partitions. Agglomerative hierarchical classification analysis methods are the most used [14][15]. These methods usually start with all statistical units separated into single-element groups (unit set – singletons), forming a cluster partition where the number of clusters is equal to the number of statistical units, and successively grouping together the most similar groups (according to the measure of similarity or dissimilarity between statistical units and the criterion of aggregation between groups) in the same cluster, until it forms a partition of a single cluster. It is recognized that agglomerative hierarchical cluster analysis can give different results for the same data, depending on the choice of the measure of comparison between statistical units and the aggregation criterion between groups [13], [16], [17]. One of the most used measures between individuals is the Euclidean distance. Moreover, the most commonly used aggregation algorithms are the farthest neighbor (or complete linkage) and the nearest neighbor (or single linkage) ones [10][12]. The complete linkage algorithm produces compact clusters, but is sensitive to outliers [16]-[18]. The single linkage algorithm is censored because it may disregard the structure of clusters, and it has the tendency to construct hierarchical partitions with chain effect [13], [16]-[18]. The average linkage method produces more balanced hierarchies, with no chain effect. This algorithm is an intermediate method between the two previously mentioned, and furthermore uses more data information [13], [16]-[18]. Therefore, the three aggregation criteria are often used over the same data sets, with the aim of knowing about clustering results robustness. Each agglomerative hierarchical cluster analysis is usually based on information concerning some “relative best partitions” of the hierarchy, namely immediately preceding relative maximum levels of increase / decrease in cluster dissimilarities [13], [19]. Moreover, by choosing a cut-off where there is the largest increase / decrease in cluster dissimilarities [13], it allows us to find an “absolute best partition”. This suggests that, at the stage where the greatest increase / decrease occurs, the joining clusters are comparatively far apart. Therefore, the best number of groups in the data should be the number of groups present in the immediately preceding step [13], [16], [17].
Goal: The aim of this study is to obtain a hierarchy of cluster partitions of Portuguese mortality from non-communicable diseases, using agglomerative hierarchical cluster analysis, in order to identify clusters of diseases associated to different degrees of severity as well as clusters of diseases explicitly associated with gender. Clustering results might help either to identifying or to searching for common causes or risk factors to improve preventive medicine.
2. Materials and Methods
2.1. Data
The classification of diseases in this paper is according to the Tenth Revision International Classification of Diseases (ICD-10). This classification makes it possible for countries compile comparable national mortality [20].
Table 1: Non-communicable diseases (ICD-10)
| Non-communicable diseases | Code |
| Lip/mouth and pharynx malignant tumor for males | 1 |
| Esophageal malignant tumor for males | 2 |
| Stomach malignant tumor for males | 3 |
| Colon malignant tumor for males | 4 |
| Rectal and anus malignant tumor for males | 5 |
| Liver / biliary / intrahepatic malignant tumor for males | 6 |
| Pancreatic malignant tumor for males | 7 |
| Larynx / trachea / bronchi and lung malignant tumor for males | 8 |
| Skin malignant tumor for males | 9 |
| Breast malignant tumor for males | 10 |
| Kidney malignant tumor for males | 11 |
| Bladder malignant tumor for males | 12 |
| Lymphatic tissue malignant tumor for males | 13 |
| Ischemic heart disease for males | 14 |
| Other heart diseases (I30-I33) for males | 15 |
| Other heart diseases (I39-I52) for males | 16 |
| Cerebrovascular diseases for males | 17 |
| Pneumonia for males | 18 |
| Chronic lower respiratory diseases for males | 19 |
| Asthma for males | 20 |
| Lip/mouth and pharynx malignant tumor for females | 21 |
| Esophageal malignant tumor for females | 22 |
| Stomach malignant tumor for females | 23 |
| Colon malignant tumor for females | 24 |
| Rectal and anus malignant tumor for females | 25 |
| Liver / biliary / intrahepatic malignant tumor for females | 26 |
| Pancreatic malignant tumor for females | 27 |
| Larynx / trachea / bronchi and lung malignant tumor for females | 28 |
| Skin malignant tumor for females | 29 |
| Breast malignant tumor for females | 30 |
| Kidney malignant tumor for females | 31 |
| Bladder malignant tumor for females | 32 |
| Lymphatic tissue malignant tumor for females | 33 |
| Ischemic heart disease for females | 34 |
| Other heart diseases (I30-I33) for females | 35 |
| Other heart diseases (I39-I52) for females | 36 |
| Cerebrovascular diseases for females | 37 |
| Pneumonia for females | 38 |
| Chronic lower respiratory diseases for females | 39 |
| Asthma for females | 40 |
The non-communicable diseases used here are listed in Table 1. In this paper, it is presented an evolution of a previous work presented at [1]. In fact, a results analysis is performed considering diseases separated by gender. Table 2 displays the shorts names of the diseases, where M represents male gender and F represents female gender.
Table 2: Short names of non-communicable diseases
| Short names of non-communicable diseases | Code |
| Lip_M | 1 |
| Esophageal_M | 2 |
| Stomac_M | 3 |
| Colón | 4 |
| Rectal_M | 5 |
| Liver_M | 6 |
| Pancreatic_M | 7 |
| Lung_M | 8 |
| Skin_M | 9 |
| Breast_M | 10 |
| Kidney_M | 11 |
| Bladder_M | 12 |
| Lymphatic_M | 13 |
| Ischemic_M | 14 |
| I30-I33_M | 15 |
| I39-I52_M | 16 |
| Cerebrovascular_M | 17 |
| Pneumonia_M | 18 |
| Chr.lowerrespiratory_M | 19 |
| Asthma_M | 20 |
| Lip_F | 21 |
| Esophageal_F | 22 |
| Stomac_F | 23 |
| Colon_F | 24 |
| Rectal_F | 25 |
| Liver_F | 26 |
| Pancreatic_F | 27 |
| Lung_F | 28 |
| Skin_F | 29 |
| Breast_F | 30 |
| Kidney_F | 31 |
| Bladder_F | 32 |
| Lymphatic_F | 33 |
| Ischemic_F | 34 |
| I30-I33_F | 35 |
| I39-I52_F | 36 |
| Cerebrovascular_F | 37 |
| Pneumonia_F | 38 |
| Chr.lowerrespiratory_F | 39 |
| Asthma_F | 40 |
Data were requested from Statistics Portugal. Non-communicable diseases separate by gender are considered as individuals and annual age-standardized mortality rates in Portugal from 1994 to 2012 for non-communicable diseases are considered as variables. Annual age-standardized mortality rates are given by the ratio of the total number of deaths expected in the specific region for a given gender for a given disease over a year and the number of standard populations per 100 000 inhabitants. In theory any standard population could be used but frequently are used the Segi world, the European or the WHO world standard populations. Here it is used the European standard population. Age-standardized mortality rates enable comparisons to be made between populations that have different age structures. More details on methods of standardizing mortality rates can be found in [21], [22]. The mortality rates considered are based on individuals up to 65 years of age.
2.2. Methodology
In this paper agglomerative hierarchical cluster analysis of non-communicable diseases is applied. The age-standardized mortality rates for each of the years from 1994 to 2012 are used as variables to perform the analysis and the non-communicable diseases separated by gender are used as individuals. Since annual standardized mortality rates are quantitative variables, the Euclidean distance to measure disease dissimilarity is used. Euclidean distance depends less from the magnitude of values than the quadratic Euclidean distance, used in [1]. As aggregation criteria the three methods mentioned above were used. The clustering results were very similar, so in this presentation are only considered the average linkage and the complete linkage criteria.
3. Results
For all diseases listed in Table 1 in the case of male gender are presented in Table 3 the mean, standard deviation, minimum and maximum of annual age-standardized mortality rates between 1994 and 2012.
Table 3: Statistics summary of annual age- standardized mortality rates between 1994 a 2012 given by non-communicable diseases for males
| Diseases | Mean | Standard
Deviation |
Min. | Max. |
| Lip_M | 7.06 | 0.57 | 6.00 | 8.20 |
| Esophageal-M | 4.83 | 0.41 | 4.20 | 5.60 |
| Stomac_M | 10.48 | 1.49 | 8.50 | 12.90 |
| Colon_M | 6.33 | 0.34 | 5.50 | 6.80 |
| Rectal_M | 3.17 | 0.25 | 2.60 | 3.60 |
| Liver_M | 3.74 | 0.62 | 2.80 | 5.10 |
| Pancreatic_M | 3.84 | 0.37 | 3.30 | 4.60 |
| Lung_M | 25.21 | 0.91 | 23.60 | 27.60 |
| Skin_M | 0.86 | 0.21 | 0.50 | 1.20 |
| Breast_M | 0.15 | 0.05 | 0.10 | 0.20 |
| Kidney_M | 1.36 | 0.19 | 1.10 | 1.70 |
| Bladder_M | 1.81 | 0.26 | 1.40 | 2.30 |
| Lymphatic_M | 6.85 | 0.70 | 5.60 | 8.10 |
| Ischemic_M | 24.62 | 6.91 | 13.80 | 33.60 |
| I30I33_M | 0.44 | 0.11 | 0.30 | 0.60 |
| I39I52_M | 6.44 | 1.77 | 4.10 | 8.90 |
| Cerebrovascular_M | 20.54 | 6.55 | 12.10 | 30.30 |
| Pneumonia_M | 6.04 | 1.55 | 4.00 | 9.00 |
| Chr.lowerrespiratory_M | 4.22 | 1.42 | 2.40 | 6.80 |
| Asthma_M | 0.49 | 0.32 | 0.20 | 1.30 |
As shown in Table 3 the individuals of male gender died more by larynx / trachea / bronchi and lung malignant tumor, ischemic heart disease and cerebrovascular diseases in Portugal between 1994 and 2012. Note that the standard deviation of annual age-specific standardized mortality rates in the case of larynx / trachea / bronchi and lung malignant tumor is very low so the mean is well representative of the mortality rates over the years. The standard deviation of annual age-specific standardized mortality rates in the cases of ischemic heart disease and cerebrovascular diseases is bigger than in all other cases. In fact, the mortality rates in these cases presented a decrease over the years while in the case of larynx / trachea / bronchi and lung malignant tumor the mortality rates are very similar. It can also be seen that in every other disease the standard deviation is low, so that does not exist a great difference between the mortality rates over the years. Table 4 presents the statistics summary in case of female gender.
Table 4: Summary statistics of annual age-standardized mortality rates between 1994 a 2012 given by non-communicable diseases for females
| Diseases | Mean | Standard
Deviation |
Min. | Max. |
| Lip_F | 0.64 | 0.14 | 0.40 | 0.90 |
| Esophageal_F | 0.34 | 0.12 | 0.10 | 0.50 |
| Stomac_F | 4.72 | 0.76 | 3.60 | 6.20 |
| Colon_F | 4.11 | 0.26 | 3.80 | 4.70 |
| Rectal_F | 1.74 | 0.15 | 1.40 | 2.00 |
| Liver_F | 0.95 | 0.15 | 0.70 | 1.20 |
| Pancreatic_F | 1.70 | 0.21 | 1.40 | 2.30 |
| Lung_F | 4.13 | 0.70 | 3.00 | 5.60 |
| Skin_F | 0.68 | 0.12 | 0.60 | 1.00 |
| Breast_F | 13.78 | 1.74 | 11.60 | 17.30 |
| Kidney_F | 0.48 | 0.08 | 0.40 | 0.70 |
| Bladder_F | 0.32 | 0.10 | 0.10 | 0.50 |
| Lymphatic_F | 4.56 | 0.58 | 3.60 | 5.50 |
| Ischemic_F | 6.13 | 2.05 | 3.00 | 9.40 |
| I30I33_F | 0.17 | 0.07 | 0.10 | 0.30 |
| I39I52_F | 2.82 | 1.08 | 1.40 | 4.40 |
| Cerebrovascular_F | 10.39 | 3.83 | 5.40 | 16.00 |
| Pneumonia_F | 2.18 | 0.59 | 1.30 | 3.40 |
| Chr.lowerrespiratory_F | 1.38 | 0.57 | 0.70 | 2.40 |
| Asthma_F | 0.32 | 0.20 | 0.00 | 0.80 |
As shown in Table 4, female gender individuals died more by breast malignant tumor, cerebrovascular diseases and ischemic heart disease in Portugal between 1994 and 2012. Note that the annual age-specific standardized mortality rates in the case of breast malignant tumor presents a decrease until 2004 while their values are very similar after that year. In the case of cerebrovascular diseases the mortality rates present a decrease until 2006 and are very similar after. For ischemic heart disease the mortality rates decrease over the years, nevertheless cerebrovascular diseases and ischemic heart disease seem to have a much higher mortaly rate in male than in female. In other cases the standard deviation of annual age-specific standardized mortality rates is very low, showing stability of mortality rates.
From the application of the agglomerative hierarchical cluster algorithms, the following results were obtained.
3.1. Agglomerative hierarchical cluster analysis with Euclidean distance and average linkage criterion
Table 5 contains the aggregation order matrix from the application of the agglomerative hierarchical cluster analysis with the Euclidean distance and average linkage aggregation criterion between groups. In Table 5 the columns Cluster 1 and Cluster 2 indicate the disease groups aggregating at each stage. The aggregation coefficient value in each step is noted by “Aggr. Coef.” and the increasing aggregation coefficient between successive steps is noted by “Dif.”.
Table 5: Aggregation order matrix of the cluster analysis with the Euclidean distance and average linkage aggregation criterion
| Stage | Cluster1 | Cluster2 | Aggr. Coef. | Dif. |
| 1 | 10 | 35 | ,332 | ——- |
| 2 | 15 | 31 | ,592 | 0,260 |
| 3 | 22 | 32 | ,721 | 0,129 |
| 4 | 21 | 29 | ,775 | 0,54 |
| 5 | 15 | 22 | ,797 | 0,22 |
| 6 | 15 | 40 | ,901 | 0,104 |
| 7 | 10 | 15 | 1,124 | 0,223 |
| 8 | 25 | 27 | 1,140 | 0,016 |
| 9 | 12 | 25 | 1,289 | 0,149 |
| 10 | 9 | 21 | 1,334 | 0,045 |
| 11 | 10 | 20 | 1,490 | 0,156 |
| 12 | 9 | 26 | 1,499 | 0,009 |
| 13 | 23 | 33 | 1,982 | 0,483 |
| 14 | 11 | 12 | 2,011 | 0,029 |
| 15 | 9 | 10 | 2,220 | 0,209 |
| 16 | 7 | 24 | 2,486 | 0,266 |
| 17 | 6 | 28 | 2,516 | 0,03 |
| 18 | 16 | 34 | 3,013 | 0,497 |
| 19 | 11 | 39 | 3,081 | 0,068 |
| 20 | 6 | 7 | 3,204 | 0,123 |
| 21 | 11 | 38 | 3,838 | 0,634 |
| 22 | 1 | 4 | 3,878 | 0,04 |
| 23 | 2 | 23 | 4,184 | 0,306 |
| 24 | 5 | 6 | 4,196 | 0,012 |
| 25 | 1 | 13 | 4,553 | 0,357 |
| 26 | 2 | 5 | 5,439 | 0,886 |
| 27 | 9 | 11 | 5,542 | 0,103 |
| 28 | 16 | 18 | 5,854 | 0,312 |
| 29 | 19 | 36 | 6,519 | 0,665 |
| 30 | 2 | 19 | 7,273 | 0,754 |
| 31 | 1 | 16 | 8,281 | 1,008 |
| 32 | 3 | 37 | 10,544 | 2,263 |
| 33 | 1 | 2 | 12,334 | 1,79 |
| 34 | 3 | 30 | 16,129 | 3,795 |
| 35 | 1 | 9 | 18,145 | 2,016 |
| 36 | 14 | 17 | 19,928 | 1,783 |
| 37 | 8 | 14 | 32,412 | 13,132 |
| 38 | 1 | 3 | 39,753 | 7,341 |
| 39 | 1 | 8 | 89,941 | 50,188 |
Figure 1 presents the dendrogram associated to Euclidean distance and average linkage aggregation criteria.
From Table 5 and Figure 1 it may be observed the dendrogram has 39 levels. Reading the tree from top to bottom we find six well separated groups of diseases. The first group includes breast malignant tumor for males, other heart diseases (I30-I33) for females and males, kidney malignant tumor, esophageal malignant tumor, bladder malignant tumor and asthma for females, asthma for males, lip/mouth and pharynx malignant tumor, as well as skin malignant tumor for females, skin malignant tumor for males and liver / biliary / intrahepatic malignant tumor for females. Thus the first group includes a mixture of diseases, where some paired diseases for females and males appear.
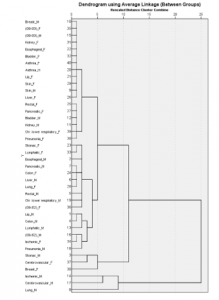
Figure 1: Dendrogram with Euclidean distance and average linkage aggregation criterion
The second cluster comprises: rectal and anus malignant tumor as well as pancreatic malignant tumor for females, bladder malignant tumor and kidney malignant tumor for males and chronic lower respiratory diseases and pneumonia for females. Note that the large cluster resulting from the union of these two groups mainly consists of diseases for females. The third group contains: stomach malignant tumor and lymphatic tissue malignant tumor for females, esophageal malignant tumor and pancreatic malignant tumor for males, colon malignant tumor for females, liver / biliary / intrahepatic malignant tumor for males, larynx / trachea / bronchi and lung malignant tumor for females, chronic lower respiratory diseases for males, other heart diseases (I39-I52) for females and rectal and anus malignant tumor for males. The fourth group contains: lip/mouth and pharynx malignant tumor, colon malignant tumor, lymphatic tissue malignant tumor, other heart diseases (I39-I52) and pneumonia, all for males and ischemic heart disease for females. Thus, this group is mainly constituted by diseases in male individuals. The fifth group contains: stomach malignant tumor for males, cerebrovascular diseases and breast malignant tumor for females. Finally, the sixth group includes: ischemic heart disease, cerebrovascular diseases and larynx / trachea / bronchi and lung malignant tumor, all for males.
3.2. Agglomerative hierarchical cluster analysis with Euclidean distance and complete linkage criterion
Figure 2 presents the dendrogram associated to Euclidean distance and complete linkage aggregation criterion.
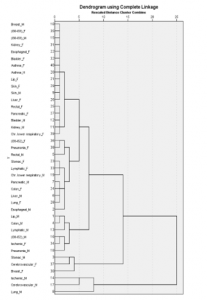
Figure 2: Dendrogram with the Euclidean distance and complete linkage aggregation criterion
As we point out above, the aggregation complete linkage and average linkage criteria gave very similar clustering results over our data. Comparing Figure 1 and Figure 2, it can be seen they both display dendrograms with 39 levels, showing six well separated clusters of diseases, grouped following a similar order in the hierarchy. Moreover, reading the tree from top to bottom in Figure 2, and comparing each cluster to the corresponding cluster in Figure 1, we find that: the first group is the same obtained with the average linkage aggregation criterion; the second group differs from the corresponding in average linkage criterion only because it doesn’t include the pneumonia for females; the third group contains all the diseases included in the third cluster of average linkage criterion plus the pneumonia for females; the last three groups are the same obtained with the average linkage criterion.
4. Discussion
Let’s point out again that for analyzing and understanding clustering results obtained from hierarchical agglomerative methods based on Euclidean distance applied to diseases, it is expected that: 1- diseases in the same cluster will have similar mortality rates and similar behavior of the mortality rates over the years; 2- clusters of diseases indicate that the order of magnitude of mortality rates and the behavior over the years of mortality rates show larger differences between diseases in different clusters than diseases inside each cluster. Both aggregation criteria produce similar hierarchies with six well separated clusters (differing only by the classification of pneumonia for females), joining in same way. If one refers to the average linkage aggregation criterion the first group is formed at level 15, the second one at level 21, the third one at level 30, the fourth group at level 31 the fifth at level 34, and the six group at level 37, corresponding to some kind of chain effect in the dendrogram, indicating some order of disease severity in the way clusters joint together. The cut-off occurs at level 38, where the sixth cluster is separated from the cluster of every other diseases. Reading the tree from top to bottom, the first three groups include diseases with lower mortality rates and the last three put together the diseases with highest mortality rates. Then the diseases that seem to need more attention are the diseases in clusters four to six. Looking at Figures 1 and 2 it is clear that groups formed by diseases with lower mortality mainly occur for females while groups formed by diseases with higher mortality tend to be associated to male gender, so male gender appears to be a risk factor in many of listed diseases. The fourth cluster reveals that lip/mouth and pharynx malignant tumor, colon malignant tumor, lymphatic tissue malignant tumor, other heart diseases (I39-I52) in male gender, ischemic heart disease for females, and pneumonia for males need the same attention by health organizations in Portugal since they are in the same cluster. This suggests that may be there are common causes for these diseases that affect more the male gender than female gender. Looking again at Figure 1 and Figure 2, it can be seen that the diseases that cause more deaths are found in fifth and sixth clusters. In the case of breast malignant tumor and stomach malignant tumor, mortality rates have been decreasing [6], possibly due to preventive measures; however, it can be seen in the fifth cluster that the stomach malignant tumor for males provoke so many deaths like cerebrovascular diseases and breast malignant tumor for females and they come together with high values of mortality rate. Note that in the case of breast malignant tumor being woman is a risk factor. Diet and obesity possibly being risk factors for the diseases in the fifth cluster more preventive measures are necessary in that direction. The sixth cluster, very well separated from all the other clusters, includes ischemic heart disease, cerebrovascular diseases and larynx / trachea / bronchi and lung malignant tumor for male gender, diseases which present the largest mortality rates, showing that they deserve special attention. This cluster also appears very well separated from all the other clusters in previous work [1]. The results shown in the present work, point that the male gender may be a risk factor for some clusters of diseases. One explanation may be habits more associated to the male gender as smoking. Additionally, the role of hormonal and metabolic characteristics of the male versus female gender is yet to understand. The results confirm that mortality rates of the respiratory tract malignant tumors and cerebrovascular diseases are the highest and it is necessary to reinforce preventive measures in case of these diseases even that Portugal is significantly better than the mean of the high-middle Socio-Demographic Index group for ischemic heart disease and lung cancer [6]. The fact that ischemic heart diseases and cerebral vascular diseases are in the same cluster it is expected. In both pathologies there are common underlying causes such as the formation of atheromatous plaques and their relationship with obesity and hypercholesterolemia. The similarity of these pathologies to malignant tumors of the respiratory tract is may be related with the known increase of thromboembolic events secondary to tumors but this requires further studies to understand and elucidate this result. However, risk factors such as smoking are common to the three pathologies which may further relate those pathologies [23].
5. Conclusion
Public Health as a science for studying and preventing diseases, prolonging life and improving quality of life through organized efforts and informed choices needs to analyze the factors of health of a population [24]. Unsupervised data analysis can introduce new knowledge allowing organizations to take measures to provide the best health warranties of the general population.
The aim of this study was to search for an agglomerative hierarchical cluster analysis of Portuguese mortality from non-communicable diseases, in order to first of all identify clusters of diseases associated to different degrees of severity as well as clusters of diseases explicitly correlated with gender.
The obtained hierarchy provides six main clusters of diseases. Moving up the hierarchy it is found that these clusters are sequentially formed, some increasing order of disease severity appearing correspond to the increasing order of levels. The first groups include diseases with lower mortality rates while the last ones put together diseases with higher mortality rates.
Special attention should be given to the last three clusters since they contain diseases showing high degrees of mortality rates compared with other clusters. Moreover, the fourth cluster mainly includes diseases in male individuals and the sixth one, grouping the highest severe diseases, refers only to males. Thus, male gender seems to be a risk factor for these two clusters of diseases. Other suggested risk factors and / or pathophysiological mechanisms that in a direct or indirect way may enhance the common development of the pathologies found in the clusters arising from this study should also be an object of priority study.
Note that taking gender in account in the present study clearly improve results obtained in previous work [1]. Clustering results might help either to identifying or to searching for common causes or risk factors to improve preventive medicine.
One limitation of this work is the fact that the time period for study does not include data from recent years yet. It happens the work is included in a larger project and it is important to get these results. In future, recent data will be added, as well as countries comparison and other multivariate data analysis (e. g., factor analysis and other cluster analysis methods, like fuzzy hierarchy techniques). Data collection is in process.
Conflict of Interest
The authors declare no conflict of interest.
Acknowledgment
Authors would like to thank Professor J. Pereira Miguel for introducing us to the analysis of these data, highlighting the importance of its study in preventive medicine and public health. The authors would also like to acknowledge Professor Brígida Mónica Faria for her comments and suggestions that greatly valued this work.
Authors would like to acknowledge Escola Superior de Saúde – P.Porto and Centro de Investigação em Saúde e Ambiente da Escola Superior de Saúde do Instituto Politécnico do Porto (CISA).
- A.P. Nascimento, C. Prudêncio, M. Vieira, R. Pimenta, H. Bacelar-Nicolau, “Cluster analysis of noncommunicable diseases in Portugal,” in Iberian Conference on Information Systems and Technologies, CISTI, 2019, doi:10.23919/CISTI.2019.8760798.
- WHO, World Health Statistics 2012, 2012.
- R. Beaglehole, R. Bonita, R. Horton, C. Adams, G. Alleyne, P. Asaria, V. Baugh, H. Bekedam, N. Billo, S. Casswell, M. Cecchini, R. Colagiuri, S. Colagiuri, T. Collins, S. Ebrahim, M. Engelgau, G. Galea, T. Gaziano, R. Geneau, A. Haines, J. Hospedales, P. Jha, A. Keeling, S. Leeder, P. Lincoln, M. McKee, J. Mackay, R. Magnusson, R. Moodie, et al., “Priority actions for the non-communicable disease crisis,” The Lancet, 377(9775), 1438–1447, 2011, doi:https://doi.org/10.1016/S0140-6736(11)60393-0.
- A. Alwan, T. Armstrong, M. Cowan, et al, Noncommunicable Diseases Country Profiles 2011, 2011.
- WHO, Noncommunicable Diseases Country Profiles 2014, 2014.
- Direção-Geral de Saúde, Portugal: The Nation’s Health 1990 – 2016. An overview of the Global Burden of Disease Study 2016 Results, Seatle, WA, 2018.
- Direção-Geral de Saúde, A Saúde dos Portugueses 2016, 2017, doi:ISSN: 2183-5888.
- T.N. Haregu, F.M. Wekesah, S.F. Mohamed, M.K. Mutua, G. Asiki, C. Kyobutungi, “Patterns of non-communicable disease and injury risk factors in Kenyan adult population: A cluster analysis,” BMC Public Health, 18(Suppl 3), 2018, doi:10.1186/s12889-018-6056-7.
- G. Pistolla, P. Prastacos, N. Tzanakis, A. Philalithis, “Clustering of mortality rates in Greeces prefectures,” Scientific Research and Essays, 7(45), 3860–3876, 2012, doi:10.5897/SRE11.1754.
- A.K. Jain, “Data clustering: 50 years beyond K-means,” Pattern Recognition Letters, 31(8), 651–666, 2010, doi:10.1016/j.patrec.2009.09.011.
- H. Bacelar-Nicolau, F.C. Nicolau, A. Sousa, L. Bacelar-Nicolau, “3rd Stochastic Modeling Techniques and Data Analysis International Conference,” in: Skiadas, C. H., ed., in One Cluster Analysis of Complex and Heterogeneous Data, International Society for the Advancement of Science and Technology (ISAST), Lisboa: 99–108, 2014.
- M.G.H. Omran, A.P. Engelbrecht, A. Salman, “An overview of clustering methods,” Intelligent Data Analysis, 11, 583–605, 2007, doi:10.3233/IDA-2007-11602.
- H. Bacelar-Nicolau, F. Nicolau, Á. Sousa, L. Bacelar-Nicolau, “Measuring similarity of complex and heterogeneous data in clustering of large data sets,” Biocybernetics and Biomedical Engineering, 29(2), 9–18, 2009.
- H. Bacelar-Nicolau, F.C. Nicolau, Á. Sousa, L. Bacelar-Nicolau, “Clustering of variables with a three-way approach for health sciences,” TPM – Testing, Psychometrics, Methodology in Applied Psychology, 21(4), 435–447, 2014, doi:10.4473/TPM21.4.5.
- F. Murtagh, P. Contreras, “Algorithms for hierarchical clustering: An overview,” Wiley Interdisciplinary Reviews: Data Mining and Knowledge Discovery, 0, 86–97, 2011, doi:10.1002/widm.53.
- C. Chatfield, A.J. Collins, Introduction to Multivariate Analysis, Chapman & Hall/CRC, 2018.
- B.S. Everitt, Cluster Analysis, 5th ed., Wiley, 2011, doi:10.1007/BF00154794.
- F. Murtagh, L. Pierre, “Ward’s Hierarchical Agglomerative Clustering Method: Which Algorithms Implement Ward’s Criterion?,” Journal of Classification, 31, 274–295, 2014, doi:10.1007/s00357.
- O. Silva, A. Sousa, H. Bacelar-Nicolau, F.C. Nicolau, “Encontro Nacional da Sociedade Portuguesa de Matemática, Probabilidades e Estatística,” in: Antunes, N., ed., in Comparação de pares de particões em análise classificatória, Sociedade Portuguesa de Matemática: 175–178, 2012.
- H. Quan, V. Sundararajan, P. Halfon, A. Fong, “Coding algorithms for defining comorbidities in ICD-9-CM and ICD-10 Administrative Data,” Medical Care, 43(11), 2005.
- R. Beaglehole, R. Bonita, T. Kjellstrom, Basic Epidemiology, WHO, Geneva, 1993.
- S.K. Lwanga, C.Y. Tye, O. Ayeni, Teaching health statistics: lesson and seminar outlines, 1999.
- M. Palmer, J. Sutherland, S. Barnard, A. Wynne, E. Rezel, A. Doel, L. Grigsby-Duffy, S. Edwards, S. Russell, E. Hotopf, P. Perel, C. Free, “The effectiveness of smoking cessation, physical activity/diet and alcohol reduction interventions delivered by mobile phones for the prevention of non-communicable diseases: A systematic review of randomised controlled trials,” PLoS ONE, 13(1), 1–18, 2018, doi:10.1371/journal.pone.0189801.
- Elena Andresen, E.D. Bouldin, eds., Public Health Foundations: Concepts and Practices, John & Son, 2010.