CNN-LSTM Based Model for ECG Arrhythmias and Myocardial Infarction Classification

Adv. Sci. Technol. Eng. Syst. J. 5(5), 601–606 (2020);
 DOI: 10.25046/aj050573
ECG analysis is commonly used by medical practitioners and cardiologists for monitoring cardiac health. A high-performance automatic ECG classification system is a challenging area because there is difficulty in detecting and clustering various waveforms in the signal, especially in the manual analysis of electrocardiogram (ECG) signals. In this paper, an accurate (ECG) classification and monitoring system are proposed using the implementation of 1D Convolutional Neural Networks (CNNs) and Long Short Term Memory (LSTM). The learned features are captured from the CNN model, and then fed to the LSTM model. No handcraft features are required for the model for the ECG classification. The result of the CNN-LSTM model has demonstrated superior performance than several state-of-the-arts that cited in the result section. The proposed models are evaluated on MIT-BIH arrhythmia and PTB Diagnostics datasets. Based on the obtained results, the CNN-LSTM method can improve the accuracy rate, such that 98.1 % and 98.66 % on Myocardial Infarction (MI) and arrhythmia classification, respectively.
1. Introduction
One of the most crucial organs in the human body is the heart, and monitoring of the heart has become a necessary diagnosis to the health of the human being. The electrical activity of the heart is well known as ECG, and Abnormality in ECG may cause symptoms of heart disease, such as persistent ventricular tachycardia, low blood pressure, rapid atrial fibrillation, and persistent ventricular tachycardia. These mentioned diseases are dangerous for human life and desire an urgent treatment [1]. The most significant information about the state of the heart can be observed from the ECG analysis, which can be monitored manually and automatically [2]. Due to the fact that there are various morphologies in the ECG signal, manual diagnosis is found difficult. Therefore, an automatic system of the ECG diagnosis has been interested in. Both feature extraction and classification approaches are the critical successes of any automatic ECG classification. There are plenty of applications that ECG analysis and classification involve, such as ischemic heart disease, arrhythmia, and myocardial infarction [3].
Feature extraction process is a viral area in ECG classification, and many approaches have been developed for this purpose as the feature has a significant impact on any machine learning system. Nowadays, there are numerous approaches for extracting features from ECG signals such as Discrete Wavelet Transform (DWT), Wavelet Transform (WT), and Mel Frequency Coefficient Cepstrum (MFCC).The DWT has been widely adopted in ECG classification as an effective feature, for instance, Desai at el. in [4], proposed system-based approach for computer-assisted detection of five classes of ECG arrhythmia beats by adopting DWT as a feature to train Support Vector Machine (SVM). In [5] developed a comprehensive model based on random forest techniques and discrete wavelet for arrhythmia classification. The authors in [6]used the DWT to capture features from the ECG signal based on ST-segment elevation and inverted T wave logic.
The MFCC was used as a handcrafted, which was extracted from the ECG signal directly, then the artificial neural network (ANN) was fed by the MFCC features [7]. The authors in [8] developed a hybrid features, which was merged MFCC and DWT after that the proposed feature was classified by k Nearest Neighbor (kNN). In addition, The WT was conducted to take features out from ECG signal for classifying four cardiac types such as healthy (N), Paced beats (P), right bundle branch block (RBBB), and left bundle branch block (LBBB). Then ANN and SVM were used to classify the extracted features [9].
The handcrafted feature is not always the best candidate feature for the ECG application, as it is a time-consuming and boring task [10]. Therefore, a featureless model like CNN has been interested in classifying the ECG analysis. CNN has been conducted into two forms, such as one dimensional and two-dimensional forms, for instance, Zubair at el. in [11] proposed the raw data fed a model-based 1D-CNN for classifying ECG signals into some classes that were suggested by the Association for Advancement of Medical Instrumentation (AAMI) and the model. Wang in [12] developed a model based on 1D CNN and modified Elman neural network (MENN),which was consisted of the 11-layers neural network, and the non-transform ECG signal also fed the model. While some researchers proposed their CNN model for ECG analysis based on two-dimensional forms, for instance, Zheng at el in [13] converted the one dimensional ECG signal into two-dimensional images and then fed to the CNN model. Yildirim at el. developed a model for detecting a diabetic subject by adopting pre-trained 2D-CNN model with frequency spectrum images, which were obtained from heartbeat signals [14].
In this paper, a hybrid model, which is composed by CNN and LSTM, is developed. No handcrafted feature requires the model as the CNN part is responsible for obtaining the feature. The learned features are given to the LSTM model to learn a deep pattern in the learned feature and classify into healthy and abnormal ECG signals, where the health ECG signal is chosen as the absolute normal ECG pattern template. According to our experimental result, LSTM can improve the classification rate, as shown in the result section. The rest of the paper is organized as follows: Section 2 explained a concise background area of the proposed model, Section 3 methodology. Results and discussion are addressed in Section 4. Finally, the conclusion section is given in Section 5.
2. Background
A representation of the cardiac activity of the heart is known as the ECG signal. The automatic monitoring system of the ECG signal has been focused area as it is related to the human health condition. Feature extraction and classification are the primary processes in any automatic monitoring system. In this paper, the suggested model is a fusion model, which consists of CNN and the LSTM model, as shown in Figure 1. A brief background of CNN and LSTM is addressed in the below section as CNN is used to extract the learned features, and LSTM is conducted to classify the learned features.
2.1 Convolution Neural Networks
The CNNs also known as the feature learner has excellent potential to extract useful features automatically from input raw data. The CNNs are normally comprised of two parts and each part has different function. Feature extractor is the first part of the CNNs and which is normally responsible to extract features automatically. The second part is classifier which is called a fully connected multi-layer perceptron (MLP). The fully connected part performs classification depend on the learned features from the first part. The feature extraction’s part includes some layers namely; convolution layer and pooling layer. Any convolutional layer can take feature maps out from the previous layer. convolutional layer contains several convolution kernels (filters), added by bias, and then put throughout the activation function to generate a feature map for the next layer [15].
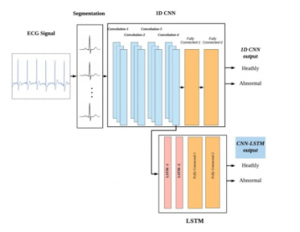
Figure 1: proposed CNN_LSTM scheme.
One of the common sub layers in feature extraction’s part is called pooling layer. There are some types of the pooling layer which are Max, Min and Average pooling. Pooling layer can shrink the resolution of the feature maps. Max-pooling operation is used in the proposed model, which calculates the maximum value in a set of nearby inputs [11].There is difference between the both parts in term of complexity. The feature extraction’s part, which is primary layer, performs more computations including feature extraction and feature selection compare to the fully connection layers [16].
Many similarities can be seen between the CNN structure the ANN with an input, hidden, and output layers. On the other hand, unlike NN, CNN is an enhanced version of the ANN, which is both translational and shift invariant. Typically, the CNNs comprise of various types of layers such as input, convolution, max pooling, average pooling, drop layer, and Softmax layer, etc. and play a specific role in the model [17].
2.2 Long Short-Term Memory
RNN is one of the types of network architectures, which is specifically designed to deal with the sequential problem, and it is commonly used in sequence classification. A well-known improvement of RNN was introduced by Hochreiter and Schmidhuber in 1997 [18], which is called Long Short Term Memory (LSTM). Plenty of applications of LSTM has been published recently [19]–[23]. The LSTM unit comprises a cell; a forget gate, an output gate, and an input gate[19]. The cell unit is in charge of remembering values at every time interval. The rest unit gates manage the flow of information int3o and out of the unit. In the memory block structure, a simple one-layer neural network controls the forget gate. The functionality of this gate is formulated as Eq (1) [24].
![]()
where, is the sequence of input; is the previous LSTM block memory; is the earlier block output; is the bias vector; is the logistic sigmoid function, and W symbolizes separate weight vectors for every input. An input gate is a unit where the new memory is formed by the previous memory block effect and a simple NN with an activation function which is tanh. These operations are calculated by Eq (2) and (3)[25].
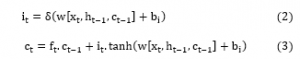
The output gate is an output of the current LSTM block and can be formulated using Eqs (4) and (5) [19].
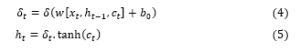
Where, are the outputs of previous memory block;These mentioned units are linked to each other, as illustrated in Figure 2, which permit information to cycle between steps of adjacent time and also construct an inner feedback state which the network to the temporal feature in the given data [26].
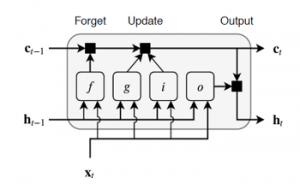
Figure 2: Connection LSTM units, where (i) is Input gate, (g) is Cell candidate, (f) is Forget gate, and (o) is Output gate [26].
3. Methodology
This section is divided into; data description, preprocessing, and experimental design.
3.1 Data description
3.1.1 MIT-BIH Arrhythmia Database
In this study, one of the examined database is a gathering of annotated ECG recordings that achieved by the Arrhythmia Laboratory of Boston’s Beth Israel Hospital, known as the MIT-BIH Arrhythmia Database [27]. It comprises 48 half-hour excerpts of two-channel ambulatory ECG recordings, which were obtained from 47 subjects, and the dataset was recorded in the BIH Arrhythmia Laboratory between 1975 and 1979. The recordings are obtained with a frequency of 360 Hz; this means each record approximately consists of 30 *360 = 10800 samples and contains recordings from two leads: one is ML2, and the other is one of . Two or more cardiologists independently annotated each record for a total of 110,000 annotations covered with the database: it is worth to mention that each annotation is placed in correspondence to the R peak of a single beat so that we have totally solved for this particular case the beat discovery problem. The MIT-BIH Arrhythmia database is split into two classes healthy and abnormal.
3.1.2 The Physionet PTB Diagnostic ECG database
The second examined database, which is used in this paper, was recorded by the Department of Cardiology at Benjamin Franklin University in Berlin, Germany. The dataset consists of 290 subjects and include 549 records (aged 17 to 87, mean 57.2; and 81 women, mean age 61.6 and 209 men, mean age 55.5). One to five records were observed from each subject. The dataset was split into two sections namely, healthy signals and different cardiac diseases such as myocardial infarction, bundle branch block, arrhythmia, cardiomyopathy/heart failure, myocardial hypertrophy, etc. Each record includes 15 simultaneously measured signals: the conventional 12 leads together with the 3 Frank lead ECGs [8].
3.2 Preprocessing
In the MIT-BIH database, the beats are labeled based on the R position. The authors segment each record sample intoa separated beat and take samples from both sides of R waves. Each heartbeat consists of 130 sample points (65 samples before the R-peak and 64 samples after the peak), which is the smallest length ever been used for ECG classification. As showed in Figure. 3, the balanced dataset was created; the number of healthy beats is 86456 and 11230 beats of the abnormal beat.
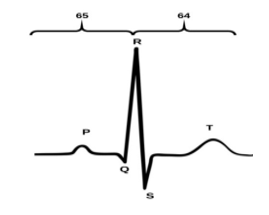
Figure 3: ECG signal.
Feature from the raw signal and eliminate noise from the ECG signals. The LSTM section can deal with the characteristics of ECG related to time series properly and able to predict the future QRS complexes using the previous QRS complexes. The 1D CNN structure contains 19 layers, including four convolution layers, two Dropout layers with half percent drop, and two fully-connected layers.
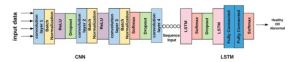
Figure 4: Structure of CNN-LSTM model.
Some parameters of the model such as number of convolution layer, filters and epochs are tuned based on cross validation methods. The description of the CNN-layers,are set out in Table 1.The spatial and local feature map is well extracted from the thirteenth layers of the CNN model, which is the convolutional layer with ten filters. The filters act to identify different features present in an ECG signal like edges, vertical and horizontal lines. Then, the features are fed to the LSTM model. For MIT-BIH Arrhythmia Dataset, the length of the learned features is ten times of the original signal thus the length of the feature is equal to 1300.Then; the learned feature is divided into ten separated beats and later merged them into a cell to be input to the LSTM model. In terms of the PTB Diagnostic ECG Dataset, the length of the ECG signal and the length learned features is 187.
Table 1: Description of 1D CNN model.
| No. layer | Name | Description |
| 1. | Input | Depend on the input with ‘zero center’ normalization |
| 2. | Convolution Layer 1 | 20 7×7 convolutions with stride [1 x 1] and padding “same” |
| 3. | Batch Normalization1 | Batch normalization |
| 4. | Clipped ReLU | Clipped ReLU with ceiling 5 |
| 5. | Dropout | 50% dropout |
| 6. | Convolution Layer 2 | 20 9×9 convolutions with stride [1 x 1] and padding “same” |
| 7. | Batch Normalization2 | Batch normalization 2 |
| 8. | Leaky ReLU | Leaky ReLU with scale 0.01 |
| 9. | Convolution Layer 3 | 30 5×5 convolutions with stride [1 x 1] and padding “same” |
| 10. | Batch Normalization3 | Batch normalization |
| 11. | Softmax | Softmax |
| 12. | Dropout | 50% dropout |
| 13. | Convolution Layer 4 | 10 3×3 convolutions with stride [1 x 1] and padding “same” |
| 14. | Batch Normalization4 | Batch normalization |
| 15. | ReLU | ReLU |
| 16. | Fully Connected1 | 60 fully connected layer |
| 17. | Fully Connected2 | Two fully connected layer |
| 18. | Softmax | Activation function for the last Fully Connected layer |
| 19. | Classification | Output cross-entropy |
3.3 Experimental design
In the current study, a cross-learning method based on deep learning is proposed for automatically classifying healthy and abnormal of the ECG signal. The proposed model is developed by integrating CNN and LSTM, which consists of 19 layers,as illustrated in Figure 4,where the CNN section is responsible for capturing the locally
The implemented LSTM structure contains two lstmlayers, dropout layers, and two fully-Connected layers, as it is shown in Table 2. The output of the proposed model is two classes, which are healthy and abnormal Arrhythmia for MIT-BIH Arrhythmia Database and healthy and Myocardial Infarction for the PTB Diagnostic ECG Database.
Table 2: Description of LSTM model.
| No. layer | Name | Description |
| 1. | Input | Sequence input with input dimensions |
| 2. | LSTM Layer 1 | LSTM with 120 hidden units |
| 3. | Softmax | Softmax |
| 4. | Dropout | 30% dropout |
| 5. | LSTM Layer 2 | LSTM with 120 hidden units |
| 6. | Fully Connected1 | Ten fully connected layer |
| 7. | Fully Connected2 | Two fully connected layer |
| 8. | Softmax | Softmax |
| 9. | Classification | Output cross-entropy |
4. Result and discussion
2.3 MIT-BIH arrhythmia database
Nowadays, machine learning has been adopted for many applications, such as arrhythmia classification. One of the well-known datasets is the MIT-BIH arrhythmia dataset that has been adopted by a mounting number of researchers in ECG research. Table 3 shows the result of the proposed methods and some state of arts who have studied a model for detecting ECG arrhythmias. Inspire of these state of arts, ten-fold cross-validation is utilized to evaluate the proposed model. Although the proposed CNN-LSTM model is fed by the shortest length of the ECG signal ever, the result demonstrates higher classification accuracy than other related studies. However, the result of 1D CNN does not exceed the state of arts. Moreover, the performance of our proposed model exceed the performance of a CNN-LSTM model which was conducted by [28]. However, the structure of their model (11 layers) is simplest than our model (19 layers).
Table 3: Result of arrhythmia classification.
| Study | Number of Classes | Classifier | Signal Length | Accuracy (%) |
| Andersen et al. 2019 [25] | 2 | CNN +RNN | 360 , 250 | 97.80% |
| Wang 2020[12] | 2 | CNN+MENN | 360 | 97.40% |
| Lih Oh[28] | 5 | CNN+LSTM | 1000 | 98.48%, |
|
Proposed method |
2 | CNN | 130 sample | 94.70% |
| 2 | CNN+LSTM | 130 sample | 98.66% |
2.4 MI Classification
Another well-known datasets are the PTB Diagnostics dataset that is used to evaluate the proposed methods. MI classification is an application of using the PTB Diagnostics dataset, and the MI can be treated as two classes’ problem with infracted and non-infracted classes. The length of the signal 14552 samples and divided by 4046 infracted and 10506 non-infracted. Based on relevant researches in the literature, ten-fold cross-validation is adopted to weigh the proposed method. The experimental result in Table 4 shows a significant improvement in the classification accuracy. Moreover, the percentage of precision and recall are improved compared to the existing approaches available in the literature.
Table 4: MI classification result.
| Study | Percentage (%) | ||
| Accuracy |
Precision |
Recall |
|
| Kachuee et al. [29] | 95.90 | 95.20 | 95.10 |
| Achary el al. [30] | 93.5 | 92.80 | 93.70 |
| Safdarian et al.[31] | 94.70 | – | – |
| Scratched 1D-CNN proposed | 97.55 | 96.00 | 97.51 |
| CNN-LSTM proposed | 98.13 | 96.80 | 98.00 |
5. Conclusion
Detecting heart abnormalities using ECG signals is very challenging area. An accurate model to detect the abnormal ECG signals leads to offer correct treatment to the patients in the earlier stage of disease. In this paper, an effective arrhythmias and myocardial classification method that combines 1-D CNN and LSTM model. The proposed CNN-LSTM model is applied to the computerized recognition of abnormal ECG signals. According to our experimental result, the learned features from CNN can be useful features for a time series approach like LSTM.
Moreover, the LSTM can find out a better pattern in the learned feature compare to the fully-connection layer itself. Consequently, the classification result by LSTM has outperformed the states of arts. The authors recommend to use the proposed model to classify multiclass of arrhythmias and myocardial instead of binary class.
Conflict of Interest
The authors declare no conflict of interest.
Acknowledgment
The authors would like to thank assistant professor Mr, Zrar Kh Abdul for his support during the preparation of this work. Many thanks for the reviewers for their valuable comments and suggestions on the manuscript which improve the presentation of the paper.
- E. J. Benjamin et al., Heart Disease and Stroke Statistics—2017 Update, 135(10), 2017.
- S. Saechia, J. Koseeyaporn, and P. Wardkein, “Human identification system based ECG signal,” IEEE Reg. 10 Annu. Int. Conf. Proceedings/TENCON, 2007, 2–5, 2005, doi: 10.1109/TENCON.2005.300986.
- M. A. Serhani, H. T. El Kassabi, H. Ismail, and A. N. Navaz, “ECG Monitoring Systems: Review, Architecture, Processes, and Key Challenges,” Sensors, 2020, doi: 10.3390/s20061796.
- U. Desai, R. J. Martis, C. G. Nayak, K. Sarika, and G. Seshikala, “Machine intelligent diagnosis of ECG for arrhythmia classification using DWT, ICA and SVM techniques,” 12th IEEE Int. Conf. Electron. Energy, Environ. Commun. Comput. Control (E3-C3), INDICON 2015, 2–5, 2016, doi: 10.1109/INDICON.2015.7443220.
- G. Pan, Z. Xin, S. Shi, and D. Jin, “Arrhythmia classification based on wavelet transformation and random forests,” Multimed. Tools Appl., 77(17), 21905–21922, 2018, doi: 10.1007/s11042-017-5225-5.
- P. Kora, C. U. Kumari, K. Swaraja, and K. Meenakshi, “Atrial Fibrillation detection using Discrete Wavelet Transform,” in Proceedings of 2019 3rd IEEE International Conference on Electrical, Computer and Communication Technologies, ICECCT 2019, 1–3, 2019. DOI: 10.1109/ICECCT.2019.8869498.
- M. Boussaa, I. Atouf, M. Atibi, and A. Bennis, “ECG signals classification using MFCC coefficients and ANN classifier,” Proc. 2016 Int. Conf. Electr. Inf. Technol. ICEIT, 2016, 480–484, 2016. DOI: 10.1109/EITech.2016.7519646.
- S. A. A. Yusuf and R. Hidayat, “MFCC feature extraction and KNN classification in ECG signals,” 2019 6th Int. Conf. Inf. Technol. Comput. Electr. Eng. ICITACEE, 2019, 1–5, 2019. DOI: 10.1109/ICITACEE.2019.8904285.
- S. Sahoo, B. Kanungo, S. Behera, and S. Sabut, “Multiresolution wavelet transform based feature extraction and ECG classification to detect cardiac abnormalities Multiresolution wavelet transform based feature extraction and ECG classification to detect cardiac abnormalities,” 55–66, 2017. DOI: 10.1016/j.measurement.2017.05.022.
- Ö. Yıldırım, U. B. Baloglu, and U. R. Acharya, “A deep convolutional neural network model for automated identification of abnormal EEG signals,” Neural Comput. Appl., 10–20, 2018. doi: 10.1007/s00521-018-3889-z.
- M. Zubair, J. Kim, and C. Yoon, “An automated ECG beat classification system using convolutional neural networks,” in 2016 6th International Conference on IT Convergence and Security, ICITCS 2016. doi: 10.1109/ICITCS.2016.7740310.
- J. Wang, “A deep learning approach for atrial fibrillation signals classification based on convolutional and modified Elman neural network,” Futur. Gener. Comput. Syst., 102, 670–679, 2020, doi: 10.1016/j.future.2019.09.012.
- Z. Zheng, Z. Chen, F. Hu, J. Zhu, Q. Tang, and Y. Liang, “An automatic diagnosis of arrhythmias using a combination of CNN and LSTM technology,” Electron., 9(1), 1–15, 2020, doi: 10.3390/electronics9010121.
- O. Yildirim, M. Talo, B. Ay, U. B. Baloglu, G. Aydin, and U. R. Acharya, “Automated detection of diabetic subject using pre-trained 2D-CNN models with frequency spectrum images extracted from heart rate signals,” Comput. Biol. Med., 113, 103387, Oct. 2019, doi: 10.1016/j.compbiomed.2019.103387.
- W. Yin, X. Yang, L. Zhang, and E. Oki, “ECG Monitoring System Integrated with IR-UWB Radar Based on CNN,” IEEE Access, 4, 6344–6351, 2016, doi: 10.1109/ACCESS.2016.2608777.
- J. Li, Y. Si, T. Xu, and S. Jiang, “Deep Convolutional Neural Network Based ECG Classification System Using Information Fusion and One-Hot Encoding Techniques,” Math. Probl. Eng., 2018. doi: 10.1155/2018/7354081.
- U. R. Acharya et al., “Automated identification of shockable and non-shockable life-threatening ventricular arrhythmias using convolutional neural network,” Futur. Gener. Comput. Syst., 79, 952–959, 2018. doi: 10.1016/j.future.2017.08.039.
- S. Hochreiter and J. Urgen Schmidhuber, “Long Shortterm Memory,” Neural Comput., 9(8), p. 17351780, 1997.
- C. Chen, Z. Hua, R. Zhang, G. Liu, and W. Wen, “Automated arrhythmia classification based on a combination network of CNN and LSTM,” Biomed. Signal Process. Control, 57, 101819, 2020, doi: 10.1016/j.bspc.2019.101819.
- X. H. Le, H. V. Ho, G. Lee, and S. Jung, “Application of Long Short-Term Memory (LSTM) neural network for flood forecasting,” Water (Switzerland), 11(7), 2019, doi: 10.3390/w11071387.
- E. Balouji, I. Y. H. Gu, M. H. J. Bollen, A. Bagheri, and M. Nazari, “A LSTM-based deep learning method with application to voltage dip classification,” Proc. Int. Conf. Harmon. Qual. Power, ICHQP, 2018-May, 1–5, 2018, doi: 10.1109/ICHQP.2018.8378893.
- F. Weninger et al., “Speech enhancement with LSTM recurrent neural networks and its application to noise-robust ASR,” Lect. Notes Comput. Sci. (including Subser. Lect. Notes Artif. Intell. Lect. Notes Bioinformatics), 9237, 91–99, 2015, doi: 10.1007/978-3-319-22482-4_11.
- F. Liu et al., “An Attention-based Hybrid LSTM-CNN Model for Arrhythmias Classification,” Proc. Int. Jt. Conf. Neural Networks, 2019-July, 1–8, 2019, doi: 10.1109/IJCNN.2019.8852037.
- Ö. Yildirim, “A novel wavelet sequences based on deep bidirectional LSTM network model for ECG signal classification,” Comput. Biol. Med., 96(March), 189–202, 2018, doi: 10.1016/j.compbiomed.2018.03.016.
- R. S. Andersen, A. Peimankar, and S. Puthusserypady, “A deep learning approach for real-time detection of atrial fibrillation,” Expert Syst. Appl., 115, 465–473, 2019, doi: 10.1016/j.eswa.2018.08.011.
- J. Cheng, L. Dong, and M. Lapata, “Long short-term memory-networks for machine reading,” EMNLP 2016 – Conf. Empir. Methods Nat. Lang. Process. Proc., 551–561, 2016.
- G. B. Moody and R. G. Mark, “The impact of the MIT-BIH arrhythmia database,” IEEE Engineering in Medicine and Biology Magazine, 20(3), 45–50, 2001, doi: 10.1109/51.932724.
- S. L. Oh, E. Y. K. Ng, R. S. Tan, and U. R. Acharya, “Automated diagnosis of arrhythmia using combination of CNN and LSTM techniques with variable length heart beats,” Comput. Biol. Med., 102, 278–287, 2018, doi: 10.1016/j.compbiomed.2018.06.002.
- M. Kachuee, S. Fazeli, and M. Sarrafzadeh, “ECG heartbeat classification: A deep transferable representation,” Proc. – 2018 IEEE Int. Conf. Healthc. Informatics, ICHI 2018, 443–444, 2018, doi: 10.1109/ICHI.2018.00092.
- U. R. Acharya et al., “A deep convolutional neural network model to classify heartbeats,” Comput. Biol. Med., 89, 389–396, 2017, doi: 10.1016/j.compbiomed.2017.08.022.
- N. Safdarian, N. J. Dabanloo, and G. Attarodi, “A New Pattern Recognition Method for Detection and Localization of Myocardial Infarction Using T-Wave Integral and Total Integral as Extracted Features from One Cycle of ECG Signal,” J. Biomed. Sci. Eng., 07(10), 818–824, 2014, doi: 10.4236/jbise.2014.710081.