Butterfly Life Cycle Algorithm for Measuring Company’s Growth Performance based on BSC and SWOT Perspectives
Volume 5, Issue 5, Page No 554-558, 2020
Author’s Name: Kerin Augustin, Natasia, Ditdit Nugeraha Utamaa)
View Affiliations
Computer Science Department, BINUS Graduate Program – Master of Computer ScienceBina Nusantara University, Jakarta, Indonesia 11480
a)Author to whom correspondence should be addressed. E-mail: ditdit.utama@binus.edu
Adv. Sci. Technol. Eng. Syst. J. 5(5), 554-558 (2020); ![]() DOI: 10.25046/aj050568
DOI: 10.25046/aj050568
Keywords: Butterfly life-cycle algorithm, Balanced scorecard, SWOT analysis, Company growth, Strategic planning models

Export Citations
Previous study of butterfly life-cycle algorithms (BLCA) has been done to construct a novel algorithm by impersonating the life-cycle of a real butterfly. The algorithm was tested in measuring the company’s growth performance using a balanced scorecard (BSC) strategic planning model. This paper is proposed to continue the previous study by expanding the concept in measuring company growth, not only using BSC but also SWOT analysis as the strategic planning model and then to develop its application through coding procedure and more focused to code the assessment of BLCA. Then, we build the application using Java programming language. As a result, the model could be applied in companies to measure company’s growth performance by comparing those two strategic planning models.
Received: 29 May 2020, Accepted: 02 September 2020, Published Online: 05 October 2020
1. Introduction
Company is an organization that makes money by producing goods or services. In economics point of view, company growth can be measured in many ways, such as sales, number of employments, and asset growth. In a company, age and size of a company are found to be relevant to a growth determinant. Financial and productivity also found that it could influence the potential of a company’s growth [1]. The importance of knowing company growth may influence the future for a company, which determines their planning decision to improve the quality of their company.
There have been many studies that have conducted research based on natural phenomena. For example, there are ant colony optimization, artificial bee colony, genetic algorithm, particle swarm optimization [2], and butterfly life cycle algorithm (BLCA) [3, 4]. In the previous study of BLCA, butterfly was chosen as one of the objects to be researched because of its perfect metamorphosis. Thus, each life-cycle of this butterfly can represent the growth of a company from start-ups to a mature company. By applying BLCA to a balanced scorecard (BSC) strategic planning model, the model is constructed to measure the company growth performance [3, 4].
By analyzing the butterfly life cycle, various algorithms are constructed. One of those are optimization algorithms for soft computing and localization [5, 6]. There is also a research that creates an algorithm to measure the company’s growth by impersonating butterfly life cycles. Assuming the company as butterfly, the five stages of company (inception, survival, growth, expansion and maturity) are defined as five stages of butterfly life cycle, which are egg, caterpillar, instar, chrysalis, and butterfly [3, 7], where each stages have a different parameter that affects the growth.
While the previous study are using BSC to create the parameters, we conclude that the parameters could be gained from analyzing the company SWOT. SWOT analysis is a strategic planning model to help a company or organization to define their strengths, weaknesses, opportunities, and threats. This model is usually used as a qualitative method to analyze the internal and external environments of an organization. In this paper, we will assume qualitative outcomes of SWOT analysis to define the setting of quantitative targets, so we could measure the company’s growth performance by using the result value of the SWOT analysis model.
Therefore, the contribution of this paper is to continue the previous study by expanding the concept in measuring company growth, not only using BSC but also SWOT analysis as the strategic planning model and then to develop its application through coding procedure and more focused to code the assessment of BLCA. Testing and reviewing the result of BSC and SWOT analysis strategic planning models to measure the company’s growth is also part of this study. This study is composed of four stages including: literature review, algorithm deep analysis, model constructing, and model testing. The details about the stages will be described in the research methodology section.
2. Literature Study
2.1. Related Works
Constructing algorithms based on natural phenomena has been a common thing. Algorithms that have been made are applied to solve real life problems. For example, ant colony optimization (ACO) for finding path, artificial bee colony (ABC) for swarm intelligence [2]. There is also a study about that inspired by the natural phenomenon of chameleon’s safeguarding behavior. By observing chameleon’s nature behavior, the studies produced a novel mechanism to assess a company resilience potency [8]. Also, after observing and studying butterfly life cycle, the study is conducted to create butterfly life-cycle algorithm (BLCA) for performance evaluation [4].
2.2. Butterfly Life Cycle Algorithm (BLCA)
The previous study of BLCA has been done with constructing a novel algorithm by impersonating the life-cycle of a real butterfly. The algorithm was tested in measuring the company’s growth performance, where all indicator parameters of company growth performance were analogized from parameters of the constructed BLCA [3]. BLCA introduces the first 2 steps in butterfly for assessing company performance, where the first step is egg state, which contains three parameters and neutral conditions. Next step is caterpillar and instar stage, containing 4 parameters (with neutral condition) and the quality of egg [4].
In egg state, egg quality is affected by temperature [9, 10], humidity [10, 11], predator [12] and neutral conditions [4], which occur when all parameters are in good condition. The probabilities for positive condition are 0.20, 0.25, 0.25, 0.30 (neutral, temperature, humidity, predator). In negative condition, the probabilities are 0, 0.25, 0.25, 0.50 [4]. By using a roulette wheel, it acquires a value of condition index [13].
The five stages of company growth are inception, survival, growth, expansion and maturity [14]. These stages are analogous to the five stages of the butterfly life cycle (egg, caterpillar, instar, chrysalis, and butterfly) [3].
2.3. Balanced Scorecard (BSC)
BSC is a strategic management system that provides basics of business vision and strategic plan which contains feedback about both internal and external business processes. There are four different perspectives to measure company performance, those are financial, customer, internal business process, and innovation and learning, as in Figure 1.
The financial perspective is used to examine the whole company finance area, customer perspective used to determine sources of the current company’s market position and examines customer satisfaction, the internal business perspective is used to determine the most effective action, and the innovation and learning is used to examine company availability for innovative changes. The goal of BSC is to direct, manage, and change in support of the longer-term strategy in order to manage performance of a company [15].
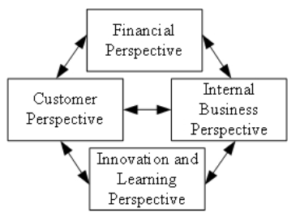
Figure 1: BSC Perspectives [16]
BSC concept found helpful to listing financial and non-financial performance measures [17]. BSC itself is usually used by companies to measure their business strategy, such as: passenger transport companies performing at Polish Market [16] and increase the banks performance in service quality [18].
2.4. SWOT Analysis
SWOT Analysis is a strategic planning model used to help a person or organization identify strengths, weaknesses, opportunities, and threats, as in Figure 2. SWOT analysis is divided into two dimensions of factor: internal factor and external factor. The internal factors are identified by examining the company environment, while external factors are identified by examining the elements outside its environment [19].
In conducting a SWOT analysis, there are several steps that must be carried out, those are: data collection, weight distribution, giving a rating, weight multiplying, score calculation, and analysis [20]. Data collection can be described as a process to search, identify, and determine each internal and external factors of an organization. Weight distribution considered as giving weight of each factor which the more important factor will weigh more. Giving a rating means, positive rating will be given to strengths and opportunities and negative rating will be given to weaknesses and threats. Weight multiplying means multiplying each weight to the given rating. Score calculation will show how an organization should react to certain factors, both internal and external factors. And last is analysis, which is the step to analyzing all the internal and external factors.
The use of SWOT aims to analyze the condition of the company which later with SWOT can provide the best corporate strategy design [21]. SWOT analysis can be considered as a growth strategy that the strategy utilizes the company’s internal strength to get opportunities that exist in the external environment in order to increase the company’s growth.
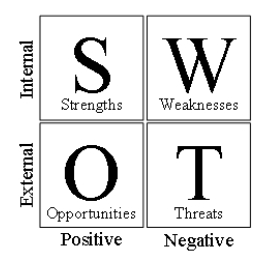
Figure 2: SWOT Analysis Diagram [20]
3. Research Methodology
In Figure 3, it can be shown that there are four stages of study to conduct this research. The basic idea of this research was referring to the butterfly life cycle algorithm (BLCA) [3, 4] that has been made before. Through the first stage, the concept of butterfly is reviewed and several ideas about the method to use is discovered. In the BLCA research [4], a balanced scorecard (BSC) is chosen to be applied as a method to measure company growth. Furthermore, this research will show comparison between the BSC and SWOT analysis method that refers to BLCA to measure the company’s growth.
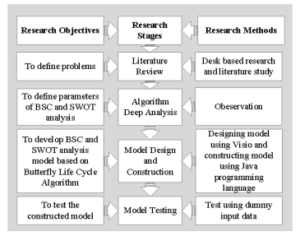
Figure 3: Research Methodology Block Diagram
In the algorithm deep analysis stage, the states are divided into five stages: egg, caterpillar, instar, chrysalis and butterfly [3]. These stages are illustrated as 5 stages of business growth, which are inception, survival, growth, expansion and maturity [14]. By using the BSC and SWOT analysis, the models are formed, where all indicator parameters of company growth performance were analogized from parameters of the BLCA [3, 4].
In the model design and construction stage, we use Microsoft Visio Professional 2016 to create the Unified Modeling Language
(UML). By using that tools, class diagram and component diagram is constructed as the initial stage in constructing the model. Furthermore, the models are developed through coding procedure using Java programming language.
In the testing stage, dummy data will be employed to test the model that has been constructed. The dummy data [4] will be randomized in the system for the testing purpose.
4. Result and Discussion
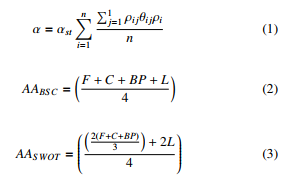
In this part, through four stages of study, the model for the study is constructed. The egg’s quality is determined by using equation (1), where α signifies as egg quality, and αst denotes as egg’s quality standard ρj embodies a roulette-wheel conception for j-th parameter’s effect probability, θj is an occurrence states for j-th parameters and n denotes day summation in egg state (should be 4) [4]. The formula to calculate accumulate average (AA, for both AA for BSC in AABSC and AA for SWOT in AASWOT) are determined using equations (2) and (3) respectively, where equation (2) used to calculate using BSC method and equation (3) for SWOT method (those are one of contributions of this study). In the equations (2) and (3), F symbolized as finance, C presented as customer, BP defined as business process, and L signified as learning. We assume finance, customer and business process as external factors and learning as internal factor.
The weights of internal and external factor are considered as equals value. The internal value in BLCA are defined into one parameter, where external value are defines into three parameters, which detailed in equation (3).
Xn P1 ρijθijρi j=1
The company growth calculation is starting from egg state, where the company’s age is below or equals to four years. The caterpillar state will start when the company’s age is between five and seventeen years inclusively. These phenomenons are analogized from life cycle of butterfly’s metamorphosis [3, 4]. In this paper, we conduct the company growth calculation only until the caterpillar state. The pseudo-code of this code procedure can be seen in Algorithm 1. It is a part of whole algorithm to embed two methods BSC and SWOT into BLCA [3, 4]. It is one of contributions from this study.
Each environment has four components which are inputted and initialized in environment class. The components are normalized into one value by averaging all components. AA of BSC model are detailed in equation (2) and the SWOT model are detailed in equation (3). These equations describe two different models that commonly used to measure the company’s growth, including its economic strength. In SWOT model, the environments are divided into two factors (internal and external) [19].
The external factor is generated randomly based on the selection in the roulette wheel. There are three components which are involved in the egg stage, those are temperature, humidity, and predator. However, the neutral condition is able to occur when all parameters are in good condition. The threshold are detailed in equations (4).
0.00 ≤ ρneu ≤ 0.20
0.20 < ρtemp ≤ 0.45
(4)
0.45 < ρhum ≤ 0.70
0.70 < ρpred ≤ 1.00
Clear design of the application could be seen in the Figure 4 and Figure 5 as it represents the component diagram and class diagram of the constructed algorithm. The interface of input dashboard and output graph of BSC and SWOT analysis calculation result for the company growth performance are shown in Figure 6 and Figure 7.
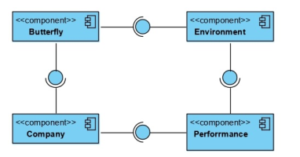
Figure 4: Component diagram of the constructed model
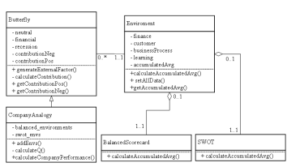
Figure 5: Class diagram of the constructed model
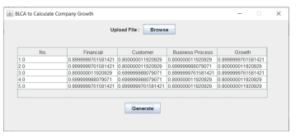
Figure 6: Input Dashboard
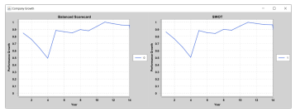
Figure 7: Output Graph
Based on Figure 7, the difference of result using BSC and SWOT analysis may not be noticeable. However the exact value of the result’s average is different. The average result of BSC is 0.8604 and SWOT is 0.8558, which the value difference is 0.0046.
5. Conclusion and Further Works
Through four stages of study, two strategic planning models to measure company growth performance are constructed. Those are BSC and SWOT analysis models which are represented by butterfly life cycle. The model are developed through coding procedure to make an application so users can use it to measure their own company growth. This paper also expands the conception in measuring company growth, not only using BSC but also SWOT analysis where all the parameters are constructed and analogized from butterfly life-cycle. The result shows that there is a slightly different value between the two models that has been constructed. The value difference is 0.0046, which means that BSC and SWOT analysis might result in a similar value when both of parameters that are used are the same.
For the improvement of BLCA, the further study should be performed. For example, analyze the butterfly in the next stage for the growth by reviewing the other references or try making different parameters for the two strategic planning models, so users can really see the company growth’s performance from two different strategic planning models. Furthermore, by developing BLCA into other organizations such as a university’s growth could also be interesting.
- M. Zekic-Susac, N. Sarlija, A. Has, A. Bilandzic, “Predicting company growth using logistic regression and neural networks,” Croatian Operational Research Review, 7(2), 229–248, 2016, doi:10.17535/crorr.2016.0016.
- X.-s. Yang, Nature-Inspired Optimization Algorithms, March, 2014.
- D. N. Utama, A. Mitchell, B. Fieri, H. Richard, “A Simple Butterfly Life- cycle Algorithm for Measuring Company’s Growth Performance,” IOP Con- ference Series: Materials Science and Engineering, 598, 012041, 2019, doi: 10.1088/1757-899x/598/1/012041.
- D. N. Utama, “An Enhanced-BLCA for Assessing Performance of Company ’ s Growth,” 5–8.
- S. Arora, S. Singh, “Butterfly optimization algorithm: a novel approach for global optimization,” Soft Computing, 23(3), 715–734, 2019, doi:10.1007/ s00500-018-3102-4.
- S. Arora, S. Singh, “Node Localization in Wireless Sensor Networks Using But- terfly Optimization Algorithm,” Arabian Journal for Science and Engineering, 42(8), 3325–3335, 2017, doi:10.1007/s13369-017-2471-9.
- D. G. James, D. Nunnallee, “Life histories of Cascadia butterflies,” Life Histo- ries of Cascadia Butterflies, 86(2), 1–447, 2011.
- D. N. Utama, B. K. Noveta, G. P. Warman, J. C. Setyono, N. Wikamulia, R. L. Tatulus, “A Simple Novel Mechanism for Company Resilience Measurement based on Life-Resilience Behavior of Chameleons (LRebeaCh),” (July), 1–5, 2019, doi:10.1109/icts.2019.8850929.
- K. Gotthard, S. Nylin, C. Wiklund, “Individual state controls temperature dependence in a butterfly ( Lasiommata maera ),” Proceedings of the Royal Society of London. Series B: Biological Sciences, 267(1443), 589–593, 2000, doi:10.1098/rspb.2000.1042.
- M. Klockmann, K. Fischer, “Effects of temperature and drought on early life stages in three species of butterflies: Mortality of early life stages as a key determinant of vulnerability to climate change?” Ecology and Evolution, 7(24), 10871–10879, 2017, doi:10.1002/ece3.3588.
- K. Fischer, M. Kirste, “Temperature and humidity acclimation increase desicca- tion resistance in the butterfly Bicyclus anynana,” Entomologia Experimentalis et Applicata, 166(4), 289–297, 2018, doi:10.1111/eea.12662.
- S. Le Hesran, T. Groot, M. Knapp, T. Bukovinszky, J. E. Nugroho, G. Beretta, M. Dicke, “Maternal effect determines drought resistance of eggs in the predatory mite Phytoseiulus persimilis,” Oecologia, 192(1), 29–41, 2020, doi: 10.1007/s00442-019-04556-0.
- A. Lipowski, D. Lipowska, “Roulette-wheel selection via stochastic accep- tance,” Physica A: Statistical Mechanics and its Applications, 391(6), 2193– 2196, 2012, doi:10.1016/j.physa.2011.12.004.
- M. Scott, R. Bruce, “Five stages of growth in small business,” Long Range Planning, 20(3), 45–52, 1987, doi:10.1016/0024-6301(87)90071-9.
- A. Tubis, S. Werbin´ska-Wojciechowska, “Balanced Scorecard use in Passenger Transport Companies Performing at Polish Market,” Procedia Engineering, 187, 538–547, 2017, doi:10.1016/j.proeng.2017.04.412.
- u. Lesa´kova´, K. Dubcova´, “Knowledge and Use of the Balanced Scorecard Method in the Businesses in the Slovak Republic,” Procedia – Social and Be- havioral Sciences, 230(May), 39–48, 2016, doi:10.1016/j.sbspro.2016.09.006.
- H. A. Akkermans, K. E. Van Oorschot, “Relevance assumed: A case study of balanced scorecard development using system dynamics,” Journal of the Operational Research Society, 56(8), 931–941, 2005, doi:10.1057/palgrave. jors.2601923.
- H. Dinc¸er, S. Yu¨ ksel, L. Mart´inez, “Analysis of balanced scorecard-based SERVQUAL criteria based on hesitant decision-making approaches,” Com- puters and Industrial Engineering, 131(March), 1–12, 2019, doi:10.1016/j.cie. 2019.03.026.
- H. Bahari, E. Leksono, E. Ismiyah, “Pendekatan Risk Management & Anal- isis Swot Untuk Mengantisipasi Penurunan Laba Di Ecos Minimart Gresik,” Matrik, XVIII(2), 23–40, 2018, doi:10.350587/Matrik.
- E. Gurel, M. TAT, “SWOT ANALYSIS: A THEORETICAL REVIEW,” The Journal of International Social Research, 10(51), 2017, doi:http://dx.doi.org/10. 17719/jisr.2017.1832.
- S. P. Ramadhan, Qurtubi, M. S. Ragil, W. Sutrisno, “Performance Measurement Analysis Using SWOT and Balanced Scorecard Methods,” Journal of Modern Manufacturing Systems and Technology, 2019, doi:10.1016 .020.
Citations by Dimensions
Citations by PlumX
Google Scholar
Scopus
Crossref Citations
No. of Downloads Per Month
No. of Downloads Per Country