
Growth Models and Age Estimation of Rice using Multitemporal Vegetation Index on Landsat 8 Imagery
Volume 5, Issue 5, Page No 506-511, 2020
Author’s Name: Abdi Sukmonoa), Arief Laila Nugraha, Arsyad Nur Ariwahid, Nida Shabrina
View Affiliations
Department of Geodetic Engineering, Faculty of Engineering, Diponegoro University, Semarang, 50275, Indonesia
a)Author to whom correspondence should be addressed. E-mail: sukmono35@gmail.com
Adv. Sci. Technol. Eng. Syst. J. 5(5), 506-511 (2020); ![]() DOI: 10.25046/aj050563
DOI: 10.25046/aj050563
Keywords: Age of Rice, Growth Model of Rice, Multitemporal EVI

Export Citations
Age and growth are two essential rice biophysics parameters used to determine the health parameters and production rate. The spatial data of both parameters can utilize remote sensing technology, which in turn makes use of several vegetation indices to achieve accurate estimation. However, due to the rapid changes in rice plants’ characteristics, it is essential to study vegetation index utilization using a multitemporal method to improve its accuracy. Therefore, this research uses a multitemporal Enhanced Vegetation Index (EVI) to estimate rice’s age and growth model. The multitemporal EVI patterns were observed to estimate the Time Early Planting (TEP) and the maximum EVI value of rice in an area. The results showed that the maximum EVI value in the rice fields of Demak Regency has a class range of 0.4 to more than 0.9. The highest value is in the class of 0.80 – 0.85 covering 12023.28 ha, followed by 0.75 – 0.80 at 11834.19 ha. Furthermore, the multitemporal EVI method on Landsat 8 images was used to estimate the rice age with accuracy or RMSE of 7.7 days. The result also showed that this value is good enough because the RMSE is still in the same range of paddy growth phases.
Received: 16 July 2020, Accepted: 29 August 2020, Published Online: 24 September 2020
1. Introduction
Rice is the essensial food for about half of the world’s population. It is supply 20 % of the calories consumed worldwide [1]. Almost 90 % the global rice is produced in Asia, Africa and America Latin [2]. Most of country in thats region used rice as the staple food, especiaally in Indonesia. According to Saliem [3], close to 100% of the Indonesian population consume this product, thereby making it a staple food, with significant economic importance. The continuous increase in population leads to a rise in rice demand, therefore, an essential management strategy, such as the rice intensification system, to boost production [4].
The intensification and management of rice cultivation are inseparable from high-tech approaches due to its ability to monitor biophysical parameters such as the growth phase closely. Detailed information on the growing phase is needed to evaluate rice development [5],[6]. Furthermore, the biophysical monitoring of these parameters is valuable for the growth model and prediction of rice production [7], [8]. This growth phase model is also closely related to rice’s age and used to obtain predictable information related to future harvest time.
Spatial data is needed to monitor rice growth and age models for proper distribution and analysis using remote sensing technology. Several approaches are used to estimate the rice-growing phase, such as the Vegetation Index value approach, as stated in a research carried out by [9] and [10]. However, this study utilizes the Normalized Difference Vegetation Index (NDVI) to estimate rice growth. NDVI is a method occasionally used to monitor vegetation growth from space [11], [12]. Furthermore, various vegetation index techniques were developed to improve their accuracy and efficiency. Therefore, rice plants with a fast-changing level of green sensitivity utilized various combinations of techniques. The multitemporal data technique is one of the methods that can provide a solution [13]. Generally, indices such as NDVI show the growth status of green vegetation, therefore plant monitoring can be realized using remote sensing with time series or multitemporal data [14].
The utilization of this technique was carried out by [15] to detect rice biological parameters with NDWI and multitemporal EVI on Modis imagery, which is good for growth monitoring because of its daily temporal resolution. However, this method has a low spatial resolution, therefore it is only intended for regional plant growth studies. NDVI also affects soil and atmospheric reflection [16]. This tends to affect rice plants that have background soil types and diverse vegetation densities. [17] carried out a research to modify modified NDVI and ensure the canopy background and atmospheric noise are minimized to Enhanced vegetation Index (EVI). Therefore, this study aims to utilize multitemporal Enhanced vegetation Index (EVI) techniques on Landsat 8, which has a moderate spatial resolution that is sufficiently resolved to natural change from local to global scale [18]. Landsat 8 imagery needs to be assessed to determine its use in monitoring growth models and estimating the rice age due to its efficiency, medium spatial resolution, and freedom of usage. Therefore, this study’s results can be used to estimate the growth model and age of rice in a cheap, efficient, and accurate method.
2. Method
2.1. Description of Study Area
This study was conducted in all rice fields in Demak Regency, Central Java province, Indonesia. This region is the second-largest rice producing region in Central Java Province. In 2019, rice fields were 106 629.56 hectares (ha) with the production of 666 141, 30 Metric Ton (MT) of dry grain [19]. Demak is located adjacent to the Capital of Central Java Province, making it the major food supplier to Semarang City. The rice fields in this province have similar characteristics in terms of shape, function, and varieties. The paddy has a large plot above 100 m x 100 m, thereby making it suitable for analysis using pixel-based satellite image data, where the pixel size of the Landsat image is 30 m x 30 m. The majority of the Paddy fields in Demak are irrigated and dominated by Ciherang and Mekongga rice types, with some comprising of IR 64 during the dry season. When the same rice varieties varieties are planted, it allows for a fairly balanced analysis to estimate its growth model. The study areas in this study are shown in Figure 1.

Figure 1: Location of Study Area
Paddy in Demak Regency is planted twice a year, namely season 1 (March – June) and season 2 (September-December). This study was conducted from March –June 2019, also known as planting season 1.
2.2. Preparation and Preprocessing Data
Data were obtained from Landsat 8 OLI multi-temporal acquisition images on March 4, 2019, March 20, 2019, April 5, 2019, April 21, 2019, May 8, 2019, May 24, 2019, June 9, 2019, and June 25, 2019. Therefore, the acquisition images were obtained for 4 months with a range of 16 days. Furthermore, supporting data was also prepared, using the Indonesian Topographic Map in Demak Regency for geometric tests and rice field map for cropping images at a scale of 1: 25,000.
Image preprocessing was carried out to determine the quality of images from geometric, radiometric, and atmospheric errors. In this study, Landsat 8 OLI imagery was tested for geometric accuracy using the image to map method. This test used 20 test points (Independent Control Points) extracted from Topographic Map data on a scale of 1: 25,000 and distributed in the study area. This study’s geometric accuracy-test requirements need to meet Circular Error 90 (CE 90) using a map accuracy of 1: 25,000. This was followed by determining the geometrical quality and radiometric calibration process. The result of accuracy test of geometric has the RMSE 24.9 m. So it meets the requairement of the map accuracy 1 : 25.000. This research also converted the pixel value of DN (Digital Number) and image data to the BoA (Bottom of Atmospheric) reflected value. This was carried out using the second simulation of a satellite signal in the solar spectrum-vector (6SV) algorithm. Furthermore, it also utilized the sun’s azimuth angle at the time of image recording. The final image preprocessing stage was used to carry out the cloud removal by the BQA (Band Quality Assessment) method before the image is cropped with the Rice Field Area of Interest in Demak Regency for effective and efficient processing.
2.3. Growth of Rice Modelling Method
Rice growth models were obtained using multitemporal vegetation index values at 30 sampling points to obtain a chart value. The rice growth pattern in the graph is polynomial and shows the level of the greenness of plants from one time to another. Healthy plants have a high maximum vegetation index value on the graph.
This study utilized the EVI (Enhanced Vegetation Index), which is an improvement from the previous algorithm, known as NDVI (Normalized Difference Vegetation Index). This Algorithm is sensitive to the “red” band channel that absorbs the canopy, with lower optical penetration depth, thereby, enabling it to absorb more quickly in high biomass areas. EVI is becoming increasingly sensitive to NIR bands on moderate to high amounts of vegetation with greater optical depth penetration into the canopy. Therefore, it is better to describe variations in biophysical canopies’ structure and fails to absorb in areas with high biomass [20], [21].
EVI is derived from the soil-adjusted vegetation index (SAVI) and atmosphere-resistant vegetation index. It is an optimized combination of blue, red, and NIR channels, based on Beer’s law of canopy radiation transfer, designed to extract its greenness, regardless of soil background and atmospheric aerosol variations [21] as shown in equation 1.
![]()
Where L value is a calibration factor of the canopy and soil effect, G is a scale factor, with the EVI value in the range between -1 to 1. Furthermore, C1 and C2 are the weight of aerosol resistance. The variable and values of the equation coefficients above are L = 1, C1 = 6, C2 = 7.5, and G = 2.5 [22].
2.4. Age of Rice Estimation Method
The rice plants’ growth profile is determined using the Landsat 8 imagery, which has a multi-temporal 16-day recording time using the EVI algorithm. The beginning of planting was marked by an EVI value lower than the harvest time and vacant land. Based on vegetation index changes, it is used to determine the spatial distribution of age (HST) and rice growth at a certain time or period [15].
The early growth phase of rice had EVI values lower than at harvest time (100-120 days) with vacant land. The Time Early Planting (TEP) can be spatially estimated when the maximum EVI is obtained. It can be calculated using the modified equation from [15], as shown in equation (2).
![]()
Where is the time when the maximum EVI value is obtained with the unit in Julian date, LP is the planting time for rice plants, and the period is the temporal resolution of Landsat 8. When the TEP value is obtained, the age of the rice at the time of image acquisition is determined by calculating the difference in the acquisition date with TEP. So the equation modified become equation 3.
![]()
Equation 3 was modified the band in EVI and Landsat 8 period or temporal resolution with the rice planting time in study area is 110 days.
2.5. Limitation of The Study
This research was conducted in a research area characterized by irrigated rice fields during the dry season. rice varieties in the study area were homogeneous, most of which planted medium time planting rice. So that the rice planting time (LP) is assumed to be homogen, that is 110 days.
3. Result and Discussion
3.1. Growth Model of Rice Result
The development of rice growth models is obtained by arranging a multitemporal EVI pattern (March 4 2019, March 20 2019, April 5 2019, April 21 2019, May 8 2019, May 24 2019, June 9 2019, and June 25 2019) to produce its graphical representation. In this study, 25 sampling points were chosen to determine the multitemporal EVI pattern in the study area with the graph shown in figure 2.
Figure 2 shows more than one whole wave (one peak and one trough) on the multitemporal EVI graph. This is used to illustrate the model of rice growth patterns in the study area. It also means that there is more than one planting season in the study area. The minimum EVI value (trough) indicates that the land was vacant at that time, and the maximum value indicates that the rice was at the peak greening phase.

Figure 2: Graph of multitemporal EVI patterns at sample points
In general, the rice growth pattern shows the EVI value moves up towards the peak and decreases with the plant turning yellow when the rice has passed the flowering phase. This is influenced by rice flowers’ effects and continues to decline because the seeds start maturing while drying the stems. A maximum EVI image is needed to determine the image with the highest value at each pixel. It is necessary because the highest pixel values among all multitemporal images represent the phase with the highest greenish level at 60-64 days after planting (HST), also known as the flowering phase. The maximum EVI that has been obtained is classified into 11 classes with an interval of 0.05, as shown in Figure 3.

Figure 3: Maximum EVI classification results in Demak Regency
Figure 3 shows the spatial distribution of EVI max for each rice field area. This EVI class shows that the higher the value, the healthier the plants in the rice fields. This classification can be recapitulated in each class area shown in Table 1 and the graph in Figure 4.
Table 1 and Figure 4 show each EVI Max class area, which indicates that the EVI Max rice in Demak Regency in the first Planting Season of 2019 is the widest at 0.80-0.85 covering 12023.28 ha, followed by 0.75-0.80 ha at 11834 ha. Figure 4 shows that more than 70% of rice fields in Demak Regency in the planting season 1 of 2019 have an EVI Max above 0.70. Based on [16], the high EVI and NDVI represent the healthy vegetation. Therefore, the pattern of rice growth in the first planting season is healthy, with the greenness of rice (chlorophyll), which is closely related to crop health.
Table 1: Area of each EVI Max class in Demak Regency rice field
| Class of EVI Max | Area (ha) |
| EVIMax 0.4-0.45 | 961.02 |
| EVIMax 0.45-0.50 | 1299.42 |
| EVIMax 0.50-0.55 | 1800.99 |
| EVIMax 0.55-0.60 | 2617.92 |
| EVIMax 0.60-0.65 | 3781.71 |
| EVIMax 0.65-0.70 | 5665.05 |
| EVIMax 0.70-0.75 | 8542.08 |
| EVIMax 0.75-0.80 | 11834.19 |
| EVIMax 0.80-0.85 | 12023.28 |
| EVIMax 0.85-0.90 | 7320.6 |
| EVIMax > 0.9 | 2731.32 |
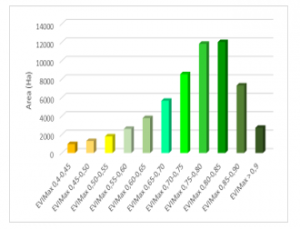
Figure 4: Graphic of Area in each EVI Max class of Rice field in Demak Regency from March – June 2019
3.2. Age Estimation of Rice Result
In this study, the age of rice was calculated using the Time Early Planting (TEP) estimation approach. This was obtained by running equation 1 on the EVI Max image, which was previously extracted from the time when EVI Max occurred on the Julian Date unit. Age estimation results are obtained from the difference between the time of acquisition or observation with TEP. The results of processing Time Early Planting and Age Estimation of rice in Demak Regency as of July 26, 2019 are shown in Figure 5 and Table 2.
Figure 5 and Table 2 show the results of Time Early Planting (TEP) and Age Estimation of Rice in Demak Regency on July 26, 2019. The widest TEP and Age Estimation was obtained on March 20, 2019 (Age of 99 Days) covering 8482, 245 Ha, followed by March 4, 2019 (Age of 115 Days) at 7088, 355 Ha and March 21, 2019 (Age of 67 Days) at 6846, 277 Ha. It shows that the rice field in Demak Regency on July 26, 2019, was dominated by Ripening’s growing phase. The harvesting time estimation is obtained by adding the Time Early planting (TEP) with the Long Period (LP). It is the planting time for rice in the study area. Most of the rice varieties in Demak in planting season II were medium rice types (aged after planting 110 days). So that the harvesting time can be obtained by adding 110 days to TEP.
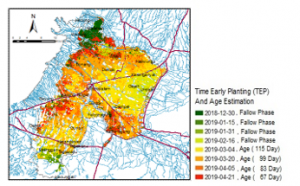
Figure 5: Time Early Planting and Age Estimation as of July 26, 2019
Table 2: Time Early Planting estimation result
| Time Early Planting Estimation | Time Harvesting Estimation | Area (ha) |
| 2018-12-30 | 2031-11-30 | 4718.604 |
| 2019-01-15 | 2021-04-21 | 827.056 |
| 2019-01-31 | 2021-11-16 | 1020.586 |
| 2019-02-16 | 2030-09-13 | 4227.501 |
| 2019-03-04 | 2038-07-30 | 7088.355 |
| 2019-03-20 | 2042-06-09 | 8482.245 |
| 2019-04-05 | 2029-01-31 | 3589.963 |
| 2019-04-21 | 2038-01-17 | 6846.277 |
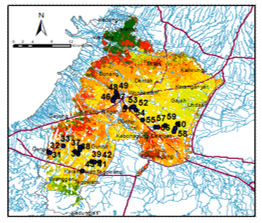
Figure 6: Spatial distribution of the validation sample point
3.3. Validation
Validation is used to determine the accuracy of rice’s estimated age with the Time Early Planting (TEP) approach of EVI Multitemporal Landsat 8. In this study, this process was carried out at 25 points distributed in the study area, as shown in Figure 6. This was carried out by field observations and interviews with farmers in order to obtain the actual age of rice. The validation was carried out on July 26, 2019.
The distributed validation test sample points also considered the representation of each rice age estimation results using the proportional random sampling technique. It aims to ensure that the validation is sufficient to meet the existing population. The results of this validation are shown in Table 3.
Table 3: Validation result of rice age estimation
| Sample Point | Age of Rice In Situ | Age of rice Estimation | Error (Days) |
| 31 | 48 | 67 | 19 |
| 32 | 59 | 67 | 8 |
| 33 | 95 | 99 | 4 |
| 34 | 96 | 99 | 3 |
| 35 | 104 | 99 | 5 |
| 36 | 104 | 99 | 5 |
| 37 | 97 | 99 | 2 |
| 38 | 106 | 99 | 7 |
| 39 | 104 | 115 | 11 |
| 40 | 117 | 115 | 2 |
| 41 | 109 | 115 | 6 |
| 42 | 98 | 99 | 1 |
| 43 | 104 | 99 | 5 |
| 44 | 97 | 83 | 14 |
| 45 | 97 | 83 | 14 |
| 46 | 95 | 83 | 12 |
| 47 | 95 | 83 | 12 |
| 48 | 82 | 83 | 1 |
| 49 | 87 | 83 | 4 |
| 50 | 107 | 115 | 8 |
| 51 | 107 | 115 | 8 |
| 52 | 107 | 115 | 8 |
| 53 | 92 | 99 | 7 |
| 54 | 112 | 115 | 3 |
| 55 | 112 | 115 | 3 |
| 56 | 114 | 115 | 1 |
| 57 | 117 | 115 | 2 |
| 58 | 112 | 115 | 3 |
| 59 | 117 | 115 | 2 |
| 60 | 107 | 115 | 8 |
| RMSE | 7.698 |
The Root Mean Square Error (RMSE) or the accuracy of the multitemporal EVI method is obtained to estimate the rice age by 7.698 days. This is sufficient when compared to the Landsat 8 temporal resolution of 16 days. Furthermore, this method is quite effective for identifying vegetative, reproductive, and ripening phases. This value is good enough because the RMSE is in the same range of growth phases of rice. Another study by [23] using time series MODIS data with the method wavelet and fourier transform in EVI graphic to estimate phenological age of rice. The result of this method has the RMSE of 12.1 day. Then [24] also used the MODIS time series data to estimate phenological stage. They used savitky golay transform in EVI multitemporal graphic. It has RMSE of 10 days. The last study propose by [25] used the machine learning in one time Landsat 8 imagery to clasification the growth phases of rice. The result of this study show that SVM radial data has the overal accuracy 70,5 % in classification of growth phase of rice. Therefore multitemporal EVI using the TEP method of Landsat 8 that has a RMSE of 7.698 days, was appropriate to estimate the age of rice..
4. Conclusion
The following conclusions were made based on the research analysis:
In conclusion, the multitemporal EVI from Landsat 8 imagery can describe rice growth models with the ability to provide information on the number of growing seasons in the study area and the health level of rice from the maximum EVI value. Furthermore, more than 70% of rice fields in the Demak Regency in the planting season 1 of 2019 have an EVI Max above 0.70, therefore it is in the quite healthy category.
The study also showed that the multitemporal EVI method of Landsat 8 Imagery can estimate rice age using the Time Early Planting (TEP) approach. It has an RMSE accuracy of 7.7 days and sufficient for monitoring the rice age because the RMSE value is still in the same growth phase range.
Conflict of Interest
The authors declared no conflict of interest.
Acknowledgment
The authors are grateful to the Faculty of Engineering – Diponegoro University for funding this research through the 2020 Strategic Research grant. This article publication is suported by World Class University (WCU) Program from Diponegoro Univeristy. We are also grateful to all those that supported this research.
- M. Kubo, M. Purevdorj. The Future of Rice Production and Consumption, Journal of Food Distribution Research 35(1), 129-142, 2004.
- Bandumula, N. Rice Production in Asia: Key to Global Food Security. Proc. Natl. Acad. Sci., India, Sect. B Biol. Sci. 88, 1323–1328, 2018. https://doi.org/10.1007/s40011-017-0867-7
- H. Saliem, N. Hermanto, E. Suryani, R. Suhaeti, & M. Arian. The Dynamics of Indonesian Consumption Patterns of Rice and Rice-Based Food Eaten Away From Home. Analisis Kebijakan Pertanian, [S.l.], 17(2), 95-110, dec. 2019. ISSN 2549-7278. doi: http://dx.doi.org/10.21082/akp.v17n2.2019.95-110
- H. Maridjo, Y. Mudayen, & A. Prihantoro. Increased productivity and technical efficiency of rice farming with the System of Rice Intensification (SRI) method in Purworejo District, Central Java. Journal of Economics, Business, & Accountancy Ventura, [S.l.], 19(1), 49-58, july 2016. ISSN 2088-785X. doi: http://dx.doi.org/10.14414/jebav.v19i1.535
- J. R. Porter, M. A. Semenov . Crop responses to climatic variation. Phil. Trans. R. Soc. B 360: 2021–2035. 2005. doi: http://doi.org/10.1098/rstb.2005.1752
- S. FUKUI, Y. ISHIGOOKA, T. KUWAGATA, T. HASEGAWA. A methodology for estimating phenological parameters of rice cultivars utilizing data from common variety trials. Journal of Agricultural Meteorology, 71(2), 77-89. 2015. https://doi.org/10.2480/agrmet.D-14-00042
- W. Koppe, M. L. Gnyp, C. Hut, Y. Yao, Y. Miao, X. Chen, G. Bareth. Rice monitoring with multi-temporal and dual-polarimetric TerraSAR-X data. Int J Appl Earth Obs Geoinformation 21, 568–576. 2012. https://doi.org/10.1016/j.jag.2012.07.016
- R. Nurtyawan, A. Saepuloh, A. G. Harto, K. Wikantika, A Kondoh. Satellite Imagery for Classification of Rice Growth Phase Using Freeman Decomposition in Indramayu, West Java, Indonesia. HAYATI Journal of Biosciences, 25(3), 126-137, 2014. https://doi.org/10.4308/hjb.25.3.126
- K. L. Liu, Y. Z. Li, H. W. Hu. Predicting ratoon rice growth rhythm based on NDVI at key growth stages of main rice. Chilean J. Agric. Res. 75(4), 410-417 Chillán dic. 2015. http://dx.doi.org/10.4067/S0718-58392015000500005.
- R Rosle, N. N. Che’Ya, N. A. Roslin, R. M. Halip, M. R. Ismail. Monitoring Early Stage of Rice Crops Growth using Normalized Difference Vegetation Index generated from UAV. IOP Conf. Series: Earth and Environmental Science 355, 2019. 012066. doi:10.1088/1755-1315/355/1/012066
- P. Santos, A. J. Negri. A Comparison of the Normalized Difference Vegetation Index and Rainfall for the Amazon and Northeastern Brazil. J. Appl. Meteor. (1997) 36 (7): 958–965. 1997. https://doi.org/10.1175/1520-0450(1997)036<0958:ACOTND>2.0.CO;2
- C. J. Trucker, P. J. Sellers. Satellite remote sensing of primary production. Int. J. Remote Sens., 7, 1395–1416. 1986. https://doi.org/10.1080/01431168608948944
- C. Yonezawa, M. Negishi, K. Azuma, M. Watanabe, N. Ishitsuka, S. Ogawa, G. Saito. Growth monitoring and classification of rice fields using multitemporal RADARSAT-2 full-polarimetric data. Int. J. Remote Sens., 33(18), 2012. https://doi.org/10.1080/01431161.2012.665194
- Jiang, D., Wang, N., Yang, X. et al. Study on the interaction between NDVI profile and the growing status of crops. Chin. Geograph.Sc. 13, 62–65. 2003. https://doi.org/10.1007/s11769-003-0086-4
- D. D. Domiri. The method for detecting biological parameter of rice growth and early planting of paddy crop by using multi temporal remote sensing data. IOP Conf. Series: Earth and Environmental Science 54(2017) 012002. 2018. doi:10.1088/1755-1315/54/1/012002
- J. Xue, B. Su. Significant Remote Sensing Vegetation Indices: A Review of Developments and Applications. Journal of Sensors Volume 2017, Article ID 1353691, 17 pages. https://doi.org/10.1155/2017/1353691
- H. Q. Liu and A. Huete, “Feedback based modification of the NDVI to minimize canopy background and atmospheric noise,” IEEE Transactions on Geoscience and Remote Sensing, 33(2), 457–465, 1995.
- D. P. Roy, M. A. Wulder, T. R. Loveland, C. E. Woodcock, R. G. Allene, M. C. Anderson. Landsat-8: Science and product vision for terrestrial global change research. Remote Sensing of Environment, 145, 154-172. 2014. https://doi.org/10.1016/j.rse.2014.02.001
- BPS. 2020. Central Java In Figure. BPS-Statistics of Central Java Province, 2020.
- X. Gao, A. Huete, W. Ni, T. Miura. Optical-biophysical relationships of vegetation spectra without background contamination. Remote Sens Environ 74, 609–620. 2000. https://doi.org/10.1016/S0034-4257(00)00150-4
- A. Huete, K. Didan, W. V. Leeuwen , T. Miura, E. Glenn. MODIS Vegetation Indices. In: Ramachandran B., Justice C., Abrams M. (eds) Land Remote Sensing and Global Environmental Change. Remote Sensing and Digital Image Processing, 11, 2010 Springer, New York, NY. https://doi.org/10.1007/978-1-4419-6749-7_26
- B. D. Wardlow, S. L. Egbert. Analysis of time series MODIS 250m Vegetation index Data for Crop Calssification in the U.S Central Great Plains. Remote Sensisng of Environment, 83, 97-111. https://doi.org/10.1080/01431160902897858
- T. Sakamoto, M. Yokozawa, H. Toritani, M. Shibayama, N. Ishitsuka, H. Ohno. A crop phenology detection method using time-series MODIS data. 2004. Remote Sensing of Environment 96(3–4), 366-374, 2005. https://doi.org/10.1016/j.rse.2005.03.008
- L. Shihua, X. Jiangtao, N. Ping, Z Jing, W Hongshu, W. Jingxian. Monitoring paddy rice phenology using time series MODIS data over Jiangxi Province, China. Int J Agric & Biol Eng, 2014; 7(6): 28-36. DOI: 10.3965/j.ijabe.20140706.005
- F. Ramadhani , R. Pullanagari , G. Kereszturi, J. Procter, Mapping of rice growth phases and bare land using Landsat-8 OLI with machine learning, International Journal of Remote Sensing, 41(21), 8428-8452, 2020. DOI: 10.1080/01431161.2020.1779378