A Hybrid Mod

Adv. Sci. Technol. Eng. Syst. J. 5(5), 414–425 (2020);
 DOI: 10.25046/aj050552
The ability to verify the critical risk factors related to an effective diagnosis is very crucial for improving accuracy on coronary heart disease prediction. The objective of this research is to find the best predictive model for coronary heart disease diagnosis. Three approaches are set up to achieve the goals (1) investigating the classifier algorithms that are most suitable for the Thai heart disease dataset in this study (2) exploring features analyzed to be the significant risk factors in the predictive model, both major risk factors, and socioeconomic status and (3) rediscretizing the predefined clinical values on certain major risk factors. In order to achieving the optimal model before incorporating with feature selection process, several classifier approaches are conducted in this experiment. The study shows that the most effective classifiers ranked from the highest accuracy are Support Vector Machine, Naïve Bayes, Decision Tree, and Multi Layer Perceptron. Support Vector Machine produces the highest accuracy of 88.18%, with respect to both major risk factors and socioeconomic factors. Moreover, when adjusted thirteen major risk factors and five socioeconomic factors altogether, the accuracy is proved to be better than conducting each one alone. To investigate the better predictive performance of our study, feature selection methods of both filter and wrapper groups are employed with exploring the hybrid models to identify the most relevant features for Thai coronary heart disease. Relief Attribute Evaluation with Bayes Theorem is proved to be the best one with the accuracy of 92.59%, classified by SVM. To prove the accuracy enhancement, we perform rediscretization model on predefined medical values to examine different physical and personalized information of each person which can be incurred the coronary heart disease in different situation. The findings found that equal-depth rediscretization values on 7 major risk factors as Obesity, Hypertension, age, LDL, HDL, Fasting Blood Sugar, and Triglyceride, influences and improves with the better accuracy than predefined values of 95.50% classified by SVM. Thus, this finding shows that the proposed technique definitely outperforms predefined values from medical field.
1. Introduction
Coronary Heart Disease (CHD) is a chronic and fatal disease that is appeared to become the major health problem in Thailand. The most critical major risk factors causing such disease include Hypertension, HDL, LDL, Triglyceride, or diabetes. Base on literature reviews, many researchers attempted to utilize data mining techniques to enhance prediction ability on heart disease, which it was mostly based only on the major risk factors (MRF). Nevertheless, the factors related to socio-economic parts, called as socioeconomic status (SES), can also be influenced as one of crucial factors affecting on coronary heart disease. These factors can be found in various developing countries as well as in Thailand. The SES, like age and sex, can be mentioned after empirical demonstration that it can be a powerful predictor discovering the heart disease for Thai people [1]. Commonly, the high death rates from heart disease happened in Thailand can be caused by stress, hard works, and others. But even low SES can recently be found as influential factors related to heart disease problems for Thai patient [2]. In addition, the factors such as high blood pressure level, obesity, and smoking, lower education level, occupation as well as unhealthy life-styles can also affect heart disease [3]. Although previous researchers conducted experiment SES for heart disease prediction, they merely used statistical methods to derive the study result. However, there have been few studies utilizing the data mining techniques. Thus, we need to find out which major or biological risk factors and SES factors that are the critical risk factors for Thai population. This study applied data mining techniques task as supervised machine learning methods via various feature selection models. Moreover, the rediscretization approaches are also used to find patterns that are hidden in the datasets to explore which risk factors can be the significant ones in prediction coronary heart disease for Thai population. In the last phase of this study, we proposed rediscretized methods for transforming the predefined medical values to novel rediscretized values to investigate the better accuracy for Thai heart study. The purposes of this research are to (1) explore the critical major and SES risk factors analyzed to be critical for Thai population (2) to rediscretize the predefined medical values on some of major risk factors.
2. Literature Review
For the last few years, many researchers have been attempting to employ advanced data mining technique approaches for prediction in medical field. In this study, the literature review is categorized into 3 paradigms. Firstly, explore heart disease prediction applying SES independently. The predictive model by applying Logistic Regression methods with Linear Regression using Statistical Software as SAS was conducted [4]. The result implied that gender and age are correlated with income levels and education, which is critical for incurring Coronary Heart Disease. Furthermore, the correlation between Risk of All-Cause Cardiovascular Mortality and Socioeconomic Status was performed [5]. The authors conducted the experiment by applying Twenty-Three risk factors. They employed association among socioeconomic status to evaluate the performance by Cox proportional hazard models using SAS Statistical Software. This research explored the correlation between lower social-economic status (SES) and worse conditions of health were directly related to the heart disease. The result revealed that each of the 23 socioeconomic status conducted was critically correlated, especially when assigning age with income.
Secondly, classification is applied in this study in order to classify Thai people who are healthy and who can be taken in to the consideration of heart disease. In [6], the authors developed a research on Effective Heart Disease Prediction by employing feature selection as association algorithm. They used Maximal Frequent Itemset Algorithm (MAFIA) classified by Non Linear Integrals to obtain the effective result. Further study of a predictive methodology on heart disease patient diagnosis based on decision tree J48 and Bagging Algorithms was presented [7]. Feature selection algorithms as Information Gain, GINI, and Gain Ratio were employed generated as ranking of most significant features. The highest performance is assessed on the basis of accuracy as 84.1%. Additionally, heart disease prediction applying j48, Bayes Net, SMO, and Multilayer perception with 10-fold cross validation using WEKA software was proposed [8]. SMO produced the highest accuracy of 89%. The heart disease prediction focusing on non- linear classification algorithm has also been developed [9]. They conducted with big data tool as Hadoop Distributed File System (HDFS) along with SVM for optimizing the set of feature. The research compared the performance of different data mining techniques. SVM in parallel fashion was executed as the best performance of prediction with 85% of accuracy.
Finally, discretization has been developed as applying for the first step in classification process in data mining approaches. In [10], the authors developed a discretization method and Information Gain on Naïve Bayes to diagnose heart disease. The authors used the heart disease dataset recruited from the UCI dataset composing of 270 instances and 14 features. The experiment was conducted with 10 fold cross validation. The results of the application showed that the accuracy of Naïve Bayes classifier was 85.18% while Naïve Bayes with discretization and information gain obtained the increased accuracy of 85.56%. Further study was conducted on the experiment of Heart Disease Prediction proposing different types of Decision along with discretization [11]. They evaluated the performance of alternative of decision trees by calculating sensitivity, specificity, and accuracy. The result showed that nine voting Equal Frequency Discritization with Gini Index Decision Tree produced the best accuracy with 85.3%, when compared with other methods without discretization.
3. Major Contribution of the Work
This study has the usefully applicable contribution both for data mining and medical field as (1) the effective performance of a hybrid model for coronary heart disease prediction for Thai population, which explores novel strategy achieved by combining feature selection approaches for choosing the most relevant attributes and rediscretization model, can be utilized for public health personnel as a primary prevention tool; and (2) a rediscretization model of this heart disease prediction system can be applied to the other diseases that have the same risk factors as stroke [12].
4. Proposed Method
This study proposed the hybrid models of feature selection methods and rediscretization on predetermined clinical values of major risk factors to prove the better performance on predictive accuracy on heart coronary disease. We firstly conducted hybrid of feature selection models to explore the most relevant attributes or risk factors that strongly related to the coronary heart disease. In the final of the study, the rediscretization on medical values was proposed to investigate the enhanced performance on prediction and to prove the strongly robust risk factors that can be the significant indicators for coronary heart disease in Thai population. In this phase, the stage of the proposed method includes data gathering, research framework, proposed hybrid models of prediction, and experiment process. Then, the algorithms of feature selectors chosen to develop the model for measuring the performance are described. Finally, the results from both hybrid predictive model and rediscretization model are compared for observing the prediction accuracy and are analyzed in discussions.
4.1. Dataset Collection
The dataset used in this work was recruited from Ramathibodi Hospital, Bangkok, Thailand. This Thai heart disease dataset consisted of 20,000 records, composing of 11,240 male and 8,760 female. Additionally, this data set contains 1,205 record with CHD. There are two types of attributes, first is 13 major risk factors (attributes) and the other type is 5 SES. Detail values of each attribute and their corresponding predefined values by medical field are listed in Table1 and Table 2. The full dataset of participants were conducted in this research to explore the best fit classifiers for dataset in this study. We then performed the analysis on the dataset to determine the relation between baseline major risk factors and SES to incur CHD. The 13 major risk factors applied for the experiment are age, gender, HDL, LDL, Fasting Blood Sugar, Hypertension, Exercise, Smoking, Alcohol intake, Diabetes, Obesity, Hereditary, and Triglyceride. The 5 socioeconomic status used in the experiment are income, education, Occupation, Jobs, and Living Conditions.
The 13 major risk factors (attributes), which have the corresponding predefined values of medical field are listed in Table 1.
Table 1: Description of each attribute for major risk factors
| No. | Attributes | Descriptions | Values |
| 1 | Gender | Male or Female | 0: Female
1: Male |
| 2 | Age | Age in years | Continuous |
| 3 | HDL | Good cholesterol (mg/dl) | 0: >= 40
1: < 40 |
| 4 | LDL | Bad cholesterol (mg/dl) | 0: <= 130
1: >130 |
| 5 | fbs | Fasting Blood Sugar (mg/dl) | 0: <= 120
1: >120 |
| 6 | hp | Hypertension
|
0: No
1: Yes |
| 7 | Exercise | Physical Activity | 0: No Exercise
1: Less Than 3d/wk 2: Greater or Equal than 3d/wk |
| 8 | Smoke | Smoking Habit | 0: Non-Smoking
1: Smoking |
| 9 | Alcoholic | Alcoholic Habit | 0: Non-Drinker
1: Drinker |
| 10 | Diabetes | Diabetes Mellitus | 0: No
1: Yes |
| 11 | Obesity | Measured By BMI | 0: No
1: Yes |
| 12 | Hereditary | Family Member Diagnosed with HD | 0: No
1: Yes |
| 13 | Tg | Triglyceride ( mg/dl) | 0: 0 – 200
1: >200 |
The additional five risk factors related to socioeconomic status are employed to assess in the prediction analysis in order to derive improved result as well as effective prediction. Moreover, the result generated from the study can provide the identification on whether correlated with the major risk factors to cause the coronary heart disease. The factors concerning socioeconomic status and their representing values are detailed in Table 2.
4.2. Experiment settings
In this work, WEKA was used as a tool for preprocessing and classifying CHD dataset. For preprocessing step, Weka was facilitated on feature selection, both traditional and designed hybrid model, and was employed for discretization. Finally, classifier algorithms were used for prediction analysis.
Three experiments were conducted for this study. The experiment performance was assessed by Confusion Matrix, which it was the standard metrics to measure the accuracy. In the meantime, the performances derived from the classifiers were also compared in order to see the different views of the results.
The experiment that had been done in the first time had the objective to identify the classification algorithms that can effectively investigate the most relevant dataset of Thai heart disease. In this stage, the study incrementally studied and separately evaluated 13 factors related to biological (MRF) perspectives and 5 factors about the socioeconomic status (SES). Next step, both MRF and SES were assessed together. The predictive performance as accuracy in this designed experiment was examined the effective measurement between conducting MRF and SES separately and adjusting both of them. Lastly, the comparison for both scenarios on the derived result was also conducted.
Table 2: Description of each attribute of socioeconomic risk factors
| No. | Attributes | Descriptions | Values |
| 14 | Income | Income levels
(THB) |
0 = <=10,000
1 = >10,000 – 20,000 2 = >20,000 – 50,000 3 = >=50,000 |
| 15 | Edu | Education Levels | 0 = Secondary
1 = Vocational 2 = Bachelor 3 = Higher than Bachelor |
| 16 | Occupation | Occupation Levels | 0 = Manager
1 = Intermediate 2 = Self-Employed 3 = Technical |
| 17 | Jobs | Employment status | 0 = Unemployed
1 = Employed |
| 18 | liv. cond. | Living condition | 0 = Rented
1 = Owner |
The second experiment focused on applying various feature selection models to CHD dataset. This experiment was designed to evaluate the efficiency of classification by examining performance of filter and wrapper approaches, including proposed hybrid models pioneered from combined feature selector methods to improve the classification accuracy. In this section, 10 filter algorithms and wrapper approach were applied. Furthermore, the hybrid models generated from combined feature selectors were developed. All of filter algorithms were classified by 4 classifiers and the accuracy of each were compared. For wrapper approaches, and the hybrid ones, were proposed to investigate the enhancement of predictive performance. Feature selection methods employed in this study are as followings:-
- Correlation Based Feature Selection (CFS): Typically, CFS algorithm evaluates strong features subsets containing features that are highly correlated with the class [13]. We mainly performed both CFS and CFS with other three feature selection approaches in this study. 18 risk factors were used to identify the robust and relevant factors. The factors that executed the value highly related to the class selected by CFS were age, gender, LDL, hypertension, smoking, diabetes, obesity, triglyceride, income, and education.
- Bayes Theorem: based on statistical technique describing the usage of the Theory of conditional probability, which assume with possible causes for a given observed event. It can be computed from the knowledge that has already been occurred. It identifies the relation between event and probability [14]. Applying Bayes’ theorem, assume that one would like to investigate whether the prospective participants have a chance to get the heart disease by knowing their triglyceride. Triglyceride is the critical causes of CHD, the participants’ triglyceride information can be determined the probability of CHD occurrence.
- CFS and Bayes Theorem: A novel hybrid feature selection model generated from CFS with Bayes Theorem combination was proposed. The features selected by CFS algorithm will be assigned to Bay’s theorem for conclusively better reduction. Correspondingly, the insignificant features will be removed. Bay’s theorem selects the feature with the highest conditional probability. In this study, CFS with Bayes Theorem is proved to give the better accuracy than the single selector approach.
- Chi-squared attribute evaluation: A Chi-squared feature selection is normally applied to test the independence of two variables or features. The aim of this feature selection is to select the features which are significantly dependent on the other feature or the response. When two features are significantly different, the chi-square value will be smaller, and it can be implied that features are not related to each other as it is not dependent on the response [15]. In this study, we focused on exploring the critical risk factors that are correlated with CHD for Thai people.
- Random Tree: Algorithms used for selecting features by randomized method. It works effectively on large dataset as having the greatest solving problem in impurity, while reducing time for training model and achieving accuracy improvement [16]. This selector algorithm produced the highest accuracy when combined with CFS to determine the critical risk factors of Thai CHD.
- Info Gain Attribute Evaluation: An algorithm proposed for feature ranking and feature reduction evaluated by Entropy, which characterizes the impurity of a collection of examples [17]. In this study, the risk factors selected by this method are reduced to 8 factors with higher accuracy than without feature selection.
- SVM Attribute Evaluation: This approach evaluates the features, which are ranked with respect to the square of coefficients as linear using SVM classification algorithm [18].
- Wrapper Subset Evaluation: A learning algorithm that are applied to evaluate the feature subsets and use the predictive model to score them due to the accuracy to detect the possible relationships between variables [19]. In this study, we applied wrapper approach including Genetic Algorithm and Sequential Search to solve the problem of performing of intensive calculation.
The third experiment was developed to assess and to compare the new rediscretized values with the predefined medical values. In this experiment, we proposed rediscretization model on 7 major risk factors (MRF) that have continuous and predefined categorical values. The new rediscretized values are automated binning by WEKA, starting from 2 to 10 bins, before feeding to the best feature selector from the previous experiment. Lastly, the accuracy of rediscretized values of each risk factor will be compared with the corresponding predefined medical values.
4.3. Designed Framework
The framework designed for this research was proposed focused on hybrid feature selection approaches for predicting coronary heart disease, which assembled numerous methods of attribute selectors via classification task to enhance the accuracy of prediction. The various hybrid feature selection models were combined from two different attribute selectors. All of these hybrid models, proposed to prove the improvement in accuracy, were generated into prospective classifiers to compare the predictive performance. Rediscretization was conducted at the last step to investigate the highest accuracy. The steps of designed framework were detailed and portrayed in Figure 1.
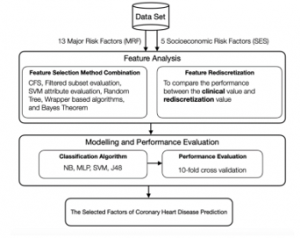
Figure 1: Proposed Framework of Predictive Model for CHD
In the phase of feature analysis, the In the phase of feature analysis, the research employed 18 feature selection models, including 10 filter approaches, wrapper models, and hybrid models in order to attain the significant attributes. The number of relevant or critical attributes drawn by these feature selector approaches would be fed into 4 classifiers, consisting of Naïve Bayes [20], Decision Tree J48 [21], Multilayer Perceptron (MLP), and Support Vector Machine (SVM) [22]. These 4 classifiers were proved to be the best ones resulting from the first study stage. Accordingly, the performance evaluation of different classification algorithms for each feature selector approach was compared and analyzed. Nevertheless, several significant MRF derived from attribute selection methods related to lifestyle such as no exercise, eating discipline, or personalization were discovered to have the different effect on each individual. Hence, the study employed rediscretization model for predefined clinical values regarding MRF in order to investigate the improved predictive performance.
4.4. Experimental Results
The experimental result was divided into 3 parts corresponding to the experimental set up, which can be demonstrated as followings
4.4.1. Experiment 1
Before feature selection, we conducted 6 classifiers to find the best fit for our dataset, which were Naïve Bayes, K-Nearest Neighbor (KNN), J48, Neural Network (NN), MLP, and SVM, and we found that KNN and NN gave the accuracy less than 80% for every type of risk factors. Finally, only 4 classifiers were selected, due to predictive performance higher than 80%. Also the performance evaluation as accuracy was compared on 5 factors of socioeconomic status (SES) with 13 major risk factors (MRF). The experimental result obtained clearly revealed that that the entire 13 MRF produced much better accuracy performance than only socioeconomic factors. Classification algorithm as SVM obviously executed as the highest classifier compared with the other three. Accordingly, predicting heart disease considering only SES in Thai people, the predictive performance cannot be accepted due to low accuracy. The comparison of predictive performance of these four classifiers between all MRF and SES factors are shown in Table 3.
Table 3: Comparison of accuracy between all major risk factors (MRF) and all socioeconomic risk factors (SES)
| Classifiers | Accuracy (%) | ||
| MRF | SES | MRF+SES | |
| Naïve Bayes | 86.70 | 47.33 | 86.14 |
| J48 | 83.17 | 43.33 | 84.88 |
| MLP | 82.50 | 54.68 | 83.66 |
| SVM | 86.88 | 56.78 | 88.18 |
From Table 3, the result showed that after adjusting all MRF and SES together, the predictive performance is a little better than that of MRF itself. It indicates that when considered Socioeconomic status (SES) as a predictor of coronary heart disease independently of the major risk factors as gender, age, diabetes, hypertension, smoking, physical activity, cholesterol, and body weight, SES itself is not a powerful determinant for health problem even it is inversely associated with risk for CHD. For example, low education or low income can be proved to have a chance of occurrence of CHD but not directly contributed to CHD without analyzing the major risk factors together. Accordingly, this finding found that consideration of SES with major risk factors would address more CHD risk. The performance of all 18 risk factors and each type of risk factors are compared and are evaluated by four classifiers. The comparison of results is represented in table 3.
According to Table 3, the result confirmed that adjusting major risk factors with SES provides the better accuracy. The above result was performed before process of feature selection, SVM classifier produced the best accuracy of 88.18%. The result examined the relationship between major risk factors and SES that when these two types of risk factors were assessed together, they affect the accuracy more than considered SES alone. Low education was defined as a low SES. If considered with major risk factors, it is strongly related with smoking [23].
4.4.2. Experiment 2
After achieving the performance evaluation before feature selection, the number of irrelevant attributes was minimized by exploring four feature selector approaches, including CFS, Filtered Subset Evaluation, SVM Attribute Evaluation, and Random Tree respectively. The critical relevant attributes obtained from each attribute selector approach were presented in Table 4.
Based on the results given in Table 4, among 4 feature selector approaches, Random Tree produced the minimum number of risk factors, which decreased to 7 factors. The factors including gender, age, smoking, LDL, and education were then accounted as the critical factors influencing CHD incurrence for Thai people. Accordingly, the finding discovered that all classifiers produced the higher accuracy after removing irrelevant attributes.
Subsequently, we proposed three hybrid feature selection approaches, which were developed from combining CFS with Filtered subset evaluation, CFS with SVM attribute evaluation, and CFS with Random Tree. Accordingly, the study proved that the three proposed hybrid models produced the better predictive accuracy. The relevant attributes or the critical risk factors achieved from three proposed hybrid feature selection models were shown in Table 5.
From the result given in Table 5, the best performance measurement yielded to SVM classifier with the highest accuracy of 90.55%, selected by CFS with Random Tree attribute selector approaches.
As a result displayed in Table 4 and Table 5, we observed the finding and found that the combination of two feature selection approaches called hybrid models produced the better accuracy than applying a single feature selector. Furthermore, Education which is the SES factors is appeared in every selector approach, both a single selector method and hybrid models. Thus, the result in this phase can be implied that low education level is considered as a critical risk factor related to SES and has the direct effect on CHD in Thai people. Consequently, Thai people with less education have more chance to raise CHD.
The findings indicated that classifiers give the improved accuracy after utilizing the hybrid feature selector approaches. The crucial factors including age, gender, LDL, smoking and low education can raise CHD of Thai people. Additionally, diabetes was found that it can also have an effect on Thai heart disease related with age, sex, cholesterol and smoking.
After results of hybrid feature selectors conducted in filter group were shown in Table 5, there were other feature selection in another group as wrapper subset evaluation of wrapper group was also implemented. Herewith, other five feature selections including wrapper subset evaluation (WSE), information gain attribute evaluation (IGAE), qui-squared attribute evaluation (CAE), gain ratio attribute evaluation (GRAE), one attribute evaluation (OAE), and relief attribute evaluation (RAE) had been employed as they were accepted to investigate the enhanced accuracy of prediction of factors affecting CHD occurrence in Thailand. The reduced selected factors are displayed in the Table 6.
Table 4: Number of selected attributes by each attribute selection method and attributes selected
| Selection Method | Selected Attributes | Accuracy (%) | ||||
| Naïve Bayes | J48 | MLP | SVM | Average | ||
| CFS subset evaluation | 10 (1, 2, 4, 6, 8, 10, 11, 13, 14, 15) | 87.70 | 85.14 | 84.74 | 88.00 | 85.14 |
| Filtered subset evaluation | 8 (1, 2, 3, 6, 8, 10, 13, 15) | 87.14 | 83.60 | 80.88 | 85.60 | 83.38 |
| SVM attribute evaluation | 8 (1, 2, 5, 8, 10, 14, 15) | 88.00 | 85.74 | 85.50 | 88.74 | 85.94 |
| Random Tree | 7 (1, 2, 3, 4, 6, 8, 15) | 88.18 | 86.00 | 87.11 | 89.66 | 86.59 |
Table 5: Selected features by CFS with Filtered subset evaluation, CFS with SVM attribute evaluation, and CFS with Random Tree
| Selection Method | Selected Attributed | Accuracy (%) | ||||
| Naïve Bayes | J48 | MLP | SVM | Average | ||
| CFS | 10 (1, 2, 4, 6, 8, 10, 11, 13, 14, 15) | 87.70 | 85.14 | 84.74 | 88.00 | 85.14 |
| CFS + Filtered subset evaluation | 8(1, 2, 4, 6, 8, 10, 13, 15) | 88.18 | 85.62 | 88.62 | 86.00 | 85.63 |
| CFS + SVM attribute evaluation | 7(1, 2, 4, 5, 8, 10, 15) | 86.18 | 88.91 | 88.14 | 89.91 | 87.12 |
| CFS + Random Tree | 6(1, 2, 4, 8, 10, 15) | 88.92 | 89.14 | 89.71 | 90.55 | 88.39 |
Table 6: The selected attributes by attribute selection methods
| Selection Method | Selected Attributes | Accuracy (%) | ||||
| Naïve Bayes | J48 | MLP | SVM | Average | ||
| Wrapper Subset Evaluation | 7(1, 2, 4, 8, 10, 15) | 87.50 | 85.82 | 84.86 | 88.54 | 86.93 |
| Info Gain Attribute Evaluation | 8(1, 2, 4, 5, 8, 10, 13, 15) | 87.00 | 85.18 | 84.66 | 87.74 | 86.15 |
| Chi-squared Attribute Evaluation | 9(1, 2, 3, 4, 5, 6, 8, 10, 13, 15) | 83.70 | 81.66 | 82.88 | 85.50 | 83.44 |
| Gain Ratio Attribute Evaluation | 8(1, 2, 4, 6, 8, 10, 13, 15) | 87.00 | 84.70 | 85.18 | 87.50 | 86.10 |
| One Attribute Evaluation | 8(1, 2, 4, 5, 8, 10, 13, 15) | 87.50 | 85.18 | 86.88 | 88.00 | 86.89 |
| Relief Attribute Evaluation | 7(1, 2, 4, 8, 10, 15) | 88.89 | 85.97 | 87.50 | 89.50 | 87.97 |
Table 6 displayed the result of selected attributes from feature selection algorithms mentioned above. There are 5 crucial biological factors as age, sex, LDL, diabetes, smoking, and socioeconomic factors as education accepted as the crucial factors as picked in every selector approach. This study implies that gender, age, LDL, diabetes, smoking and levels of education are the critically related factors causing CHD for Thai population.
In addition, the study revealed that Triglyceride was appeared to show the impact on prediction and could have the critical effects on Thai Heart Disease, associated with age, sex, cholesterol and smoking and diabetes.
The selected attributes were picked into classification algorithms to investigate the prediction accuracy. The accuracy of related factors towards CHD can be seen in the Table 6, demonstrating comparative results.
From Table 6, after performing the hybrid feature selector approaches, classifiers produced the enhanced accuracy. Relief attribute evaluation method (RAE) classified by the SVM produced best accuracy as of 89.50%, indicating that age, sex, LDL, smoking, diabetes, and low education can affect CHD occurrence. Further analysis on the study result from six methods indicated that the diabetes can be one of crucial factors influencing coronary heart disease for Thais.
After using feature selection from filter group, we attempted to use other wrapper feature selections to study the related factors influencing CHD and then compare its performance evaluation with feature selectors in filter group. The studied wrapper models are then conducted and explained. First, the wrapper algorithms that have been conducted together with Baysian classifier were calculated to work out on average accuracies. Furthermore, the other two wrapper models as Forward Selection (FS) wrapped methodologies were experimented on feature subsets to assess the prediction performance about the coronary heart disease factors. The first one uses the Best First Search (BFS) which is the search algorithm that explores the graph by expanding the promising node with the best score [24]. The second one we generate the subset of features using the Sequential Floating Forward Search (SFFS) [25]. The principle of such technique is to add one or more attributes progressively. For SFFS, after each step forward, backward steps would be applied to improve the efficiency of wrapper selector. The proposed wrapper with GA approach is also compared with four classifiers.
The finding suggested that gender, age, LDL, diabetes, smoking and education are the critical factors as they were selected in every feature selection method, and Triglyceride was also significantly involved as the major cause of CHD.
The list of features or risk factors for heart disease dataset generated by each of wrapper approach, which are Genetic Algorithm [26], Best First Search, Sequential Forward Floating Search, and without feature selection, is shown in Table 7.
Table 7: The Selected Features by different wrapper Techniques
| Feature | Selected Features | ||||||
| GA | BFS | SFFS | |||||
| NB | SVM | MLP | J48 | NB | NB | ||
| 1 | Gender | P | P | P | P | P | P |
| 2 | Age | P | P | P | P | P | P |
| 3 | HDL | P | P | P | |||
| 4 | LDL | P | P | P | P | ||
| 5 | FBS | P | P | P | |||
| 6 | Hypertension | P | P | P | |||
| 7 | Exercise | P | P | ||||
| 8 | Smoke | P | P | P | P | P | |
| 9 | Alcoholic | P | P | P | |||
| 10 | Diabetes | P | P | P | P | ||
| 11 | Obesity | P | |||||
| 12 | Hrd. | P | P | ||||
| 13 | Tg | P | P | P | |||
| 14 | Income | P | P | P | |||
| 15 | Edu | P | P | P | P | P | |
| 16 | Ocp. | ||||||
| 17 | Jobs | P | P | P | |||
| 18 | Liv.Cond | ||||||
As the consequence of employing the wrapper feature selection method, the Table 8 displays the results related to the accuracy that has been derived by implementing 10-fold cross validation. Applying GA wrapper generated with BN yields the highest effective prediction accuracy as of 89.50%, which is accounted as the most accurate value compared to other feature selection methods. It is interpreted that the GA wrapper operated with Genetic Algorithm classified by Naïve Bayes can explore the most relevant and strongest features. In addition, the accuracy of classification algorithms with different wrapper feature selection are also mentioned and displayed in the Table 8.
As the result shown from wrapper feature selection group in Table 8, it can be again confirmed that the GA wrapper with BN classifier can produce the highest predictive accuracy of CHD as 89.50%. After investigating with wrapper methods, the other filter feature selectors were applied to reduce the irrelevant risk factors.
After that, the six-inconsequence hybrid models with Bayes theorem, which include CFS, Info Gain Attribute Evaluation, Chi-squared Attribute Evaluation, Gain Ratio Attribute Evaluation, One Attribute Evaluation and Relief Attribute Evaluation, have been experimented and their results obtained the improved predictive accuracy. The attributes attained from these selection methods are shown in the Table 9.
Table 8: The performance evaluation of wrapper-based feature selection algorithms
| Wrapper Method | Accuracy (%) | |||
| Naïve Bayes | J48 | MLP | SVM | |
| GA Wrapper | 89.50 | 88.82 | 85.60 | 84.55 |
| BFS Wrapper | 87.50 | 84.53 | 83.50 | 84.18 |
| SFFS Wrapper | 88.18 | 87.17 | 81.89 | 83.50 |
| Without FS | 86.50 | 84.50 | 80.88 | 80.12 |
Referring to the hybrid feature selection models in Table 9, the numbers of attributes deducted after applying Chi-squared attribute evaluation is 9, One attribute evaluation is 8, Gain Ratio attribute evaluation is 8, and Relief attribute evaluation is 7, respectively. These selected risk factors are processed into Bayes Theorem. The CFS method with Bayes Theorem generates 6 attributes. The info gain attribute evaluation method with Bayes theorem produces 7 attributes. The chi-squared attribute evaluation method with Bayes Theorem gives 8 attributes. The gain ratio attribute evaluation method with Bayes Theorem generates 7 attributes. The one attribute evaluation method with Bayes Theorem executes 7 attributes. And lastly, the relief attribute evaluation method with Bayes Theorem produces 6 attributes. The results also indicated that critical factors influencing CHD for Thai people can count on gender, age, LDL, smoking, and education. Nevertheless, this chosen dataset achieved from the hybrid models is summarily proved in accuracy improvement classified by four classification algorithms. The comparison of classifiers accuracy with deducted attributes is presented in Table 9.
As a result obtained in Table 9, when adjusting Bayes with these six feature selectors, the predictive accuracy is absolutely proved an improved performance. Relief attribute evaluation (RAE) with the attribute selector Bayes Theorem classified by SVM yields the highest accuracy of92 .59%. The attributes including age, sex, LDL, smoking, and low education are counted as the significant factors affecting the coronary heart disease for Thai people. Beyond this, the diabetes is revealed to be one of the critical factors conclusively associated with age, sex, cholesterol and smoking raising the CHD for Thai population.
4.4.3. Experiment 3
In the last step of our study, according to the values of some risk factors are continuous values or have the predefined range of value from the medical theory, which is not well suitable for nowadays lifestyle of Thai people. For example, attribute such as age, is shown in the clinical value as continuous, which is inappropriate for predictive analysis in medical domain and have no meanings to be the input for heart disease prediction. In this section, we propose the rediscretization method to improve the
accuracy on predictive model for CHD of prediction. The proposed methodology involved systematically testing discretization techniques.
Discretization is one of the preprocessing techniques that is used for transforming the different continuous attributes, variables to discrete or nominal attributes [27]. In addition,
Table 9: The selected attributes by hybrid selection methods with Bayes Theorem
| Selection Method
With Bayes Theorem |
Selected Attributed | Accuracy (%) | ||||
| Naïve Bayes | J48 | MLP | SVM | Average | ||
| CFS | 6(1, 2, 4, 8, 10, 15) | 89.88 | 86.60 | 87.11 | 90.94 | 88.63 |
| Info Gain Attribute Evaluation | 7(1, 2, 4, 8, 10, 13, 15) | 88.50 | 86.88 | 87.50 | 89.88 | 88.19 |
| Chi-squared Attribute Evaluation | 8(1, 2, 4, 5, 8, 10, 13, 15) | 85.92 | 83.29 | 84.07 | 87.50 | 85.20 |
| Gain Ratio Attribute Evaluation | 7(1, 2, 4, 8, 10, 13, 15) | 88.00 | 85.88 | 86.50 | 88.67 | 87.26 |
| One Attribute Evaluation | 7(1, 2, 3, 4, 6, 8, 15) | 88.18 | 86.50 | 87.88 | 89.50 | 88.02 |
| Relief Attribute Evaluation | 6(1, 2, 4, 8, 10, 15) | 90.50 | 86.87 | 88.50 | 92.59 | 89.62 |
Table 10: Comparison of accuracy between Equal Width Binning and Equal Depth Binning with Age Attribute
| No. of Bins | Accuracy (in%) | |
| Equal Width Binning | Equal Frequency Binning | |
| 2 | 89.50 | 88.18 |
| 3 | 91.00 | 95.33 |
| 4 | 90.55 | 94.00 |
| 5 | 88.50 | 93.66 |
| 6 | 87.18 | 90.28 |
| 7 | 85.33 | 87.33 |
| 8 | 84.10 | 85.50 |
| 9 | 81.18 | 83.70 |
| 10 | 79.88 | 81.28 |
Table 11: Discretization on continuous and some of numeric factors of 7 risk factors
| No. | Attributes | Descriptions | Clinical Value | Discretized Value |
| 2 | Age | Age (years) | Continuous | 0: 0 – 37
1: 38 – 50 2: >= 51 |
| 3 | HDL | Good cholesterol (mg/dl) | 0: >= 40
1: < 40 |
0: >= 60
1: 50 – 59 2: 40 – 49 3: < 40 |
| 4 | LDL | Bad cholesterol (mg/dl) | 0: <= 130
1: >130 |
0: <= 100
1: 100 – 130 2: 130 – 160 3: >= 160 |
| 5 | fbs | Fasting Blood Sugar (mg/dl) | 0: <= 120
1: > 120 |
0: <= 125
1: >125 |
| 6 | hp | Hypertension
(mm/hg) |
0: No
1: Yes |
0: <= 125
1: 121 – 150 2: > 150
|
| 11 | Obesity | Measured By BMI | 0: No
1: Yes |
0: 19-22
1: 23-25 2: 26-30 3: > 30 |
| 13 | Tg | Triglyceride (mg/dl) | 0: 0 – 200
1: > 200 |
0: 0 – 130
1: > 130-179 2: >180 – 259 3: > 259 |
several classifiers entail that some would work better on discretized or binarized data as the valuable meanings in the new range of values.
At the earlier stage of this experiment, we performed the simplest unsupervised discretization methods on prospective risk factors based on equal width and equal frequency discretization. Hence, the methodology of the research work is equal width binning and equal frequency binning to investigate which one produced the better accuracy for our heart disease dataset. The primarily results showed that equal frequency gave the higher accuracy than equal width. Thus, in this study, the equal depth (Equal Frequency) discretization was selected to conduct the experiment to help improving the predictive performance. To confirm the result, attribute “Age” was exemplified. The equal width method divided the range into the user-defined number of approximately equal size of intervals.
The equal frequency method divides the values into k groups and each group contains approximately the same number of training values [28]. The new discretized value of each factor will be automated binning. The number of bins was generated by WEKA tool. We tried 9 numbers of bins starting from 2 bins to 10 bins. Table 10 contains the measurement of accuracy regarding to the number of bins generated.
This study specifies the parameter by the number of bins and how many values should be included in each bin or each interval. According to the result shown in Table 10, Equal Frequency discretization approach gave the better accuracy and the bin that achieved the highest accuracy was selected to perform rediscretization on the final experiment. Rediscretization on medical values designed to 7 attributes or risk factors is shown in Table 11.
According to the Table 11, first four major risk factors, which are age, HDL, LDL, and fasting blood sugar has been rediscretized. The rediscretized values of attribute “Age” was categorized as followings: the range of 0-37 years old contains 6,132 people, which is accounted for 31%. The range of 38-50 years old contains 8,258 people, which is accounted for 41%. The range of age more than 50 years old contains 5,610 people, which is accounted for 28%. This range of rediscretized values of attribute “Age” gives the best accuracy when compared with any other number of bins. We tried 2 to 10 bins of discretization and the number of 3 bins produced the best performance. Thus, the rediscretized values of 3 bins were selected for the study. The attribute “HDL” was rediscretized into 4 ranges. The range of more than or equal to 60 mg./dl contains 3,232 people, which is accounted for 16%. The range of 50-59 mg./dl contains 5,162 people, which is accounted for 26%. The range of 41-49 mg./dl contains 6,221 people, which is accounted for 31%. The range of less than or equal to 40 mg./dl contains 5385 people, which is accounted for 27%. Similar to attribute age, we tried rediscretization from 2 bins to 10 bins and the selected 4 bins gave the best accuracy. The attribute “LDL” was categorized into 4 bins of new range of values. The range of less than or equal to 100 mg./dl contains 3,657 people, which is accounted for 18%. The range of 101-130 mg./dl contains 4,953 people, which is accounted for 25%. The range of 131-160 mg./dl contains 5,745 people, which is accounted for 29%. The range of less than or equal to 40 mg./dl contains 5,645 people, which is accounted for 28%. Similar to attribute age, we tried rediscretization from 2 bins to 10 bins and the selected 4 bins produced the best performance evaluation. The attribute “Fasting Blood Sugar” was rediscretized to the new range of values as 2 bins. We selected this bin as the best accuracy. The first range is less than or equal to 125 mg/dl, which involves 12,240 people. Another range is more than 125 mg/dl, which involves 7,760 people.
Furthermore, as the experiment conducted in the phase of feature selection, hypertension is one of the critical risk factors for incurring the chance of occurrence for CHD. Thus, this study applied additional risk factor as hypertension for rediscretization. Many previous researches defined and divided the range of systolic blood pressure (SBP) in different range of values due to the purpose and the main idea of their researches. Generally, Hypertension was categorized according to blood pressure readings and the examination by physician is usually performed under the multivariate period of time [29]. Hypertension is considered related to several factors, such as age, body mass index, blood pressure, smoking, family history, and physical inactivity [30]. In our study, the blood pressure determination used for experiment is Systolic Blood Pressure (SBP), and the SBP that we obtained is categorized in to class “Yes” and “No”, and the rediscretized values from predefined ones, which has been chosen as the best accuracy from the bins explored from 2 to 10 bins. The rediscretized values selected in the new range can be categorized in to 3 bins, which are less than or equal to 120 mm/hg, 120 – 150 mm/hg, and more than 150 mm/hg. Systolic blood pressure with our participant’s characteristics is shown in Table 12.
Table 12: Characteristics of Participants with rediscretized values of hypertension
| Systolic Blood Pressure (mm/hg) |
Hypertension | ||
| Men (%) | Women (%) | ||
| Normal | < 120 | 43 | 52 |
| High Normal | >120 – 150 | 41 | 34 |
| Hypertension | > 150 | 16 | 14 |
As a result shown in Table 12, the finding found that there were relatively few participants at the higher stage of hypertension. Approximately half of the participants for each gender had blood pressure level in the normal range. After rediscretizing to the new range of blood pressure levels, in addition to the first four factors, the predictive accuracy is proved to more efficient and to have a better performance.
At initial examination of the feature selection phase, obesity is one of the relative risks but not selected by the selection models. Nevertheless, obesity was found to be relative associated with coronary heart disease. Thus, this study also explored the rediscretization task on obesity risk factors as the sixth factors to investigate the better accuracy in prediction, by adding to five factors above. The percentages of each interval of attribute obesity can be summarized in the Table 13.
As a result, presented in Table 13, most of participants have the normal or a little bit overweight. In the medical value, people would be detected to be critical overweight or have the obesity when they must have the value of obesity of more than 25. In our study, you can be detected to be risky to have a chance of coronary heart disease occurrence when you have a value of BMI ranged from 23 to 25. Therefore, if people take the discretized value of obesity as consideration, they can have a primary prevention for avoiding overweight, which might finally lead to coronary heart disease.
Table 13: The ratio of Participants with rediscretized values of Obesity
| Discretized Values | Participants (%) |
| 19-22 | 22 |
| 23-25 | 36 |
| 26-30 | 26 |
| >30 | 16 |
Referring to the phase of feature selection, triglyceride was explored to be the critical risk factors for CHD, because it was appeared in every attribute selection methods. Thus, it indicates that triglyceride is the significant major risk factors for Thai people. Triglycerides, usually considered as having levels higher than 200 mg/dl., are a type of fat stored in human’s blood, which are derived from consuming fat and high calories food. In this research, triglyceride is one of the major risk factors to be rediscretized the medical values to test the better classification performance due to difference of individuals on the basis of both physical and behavioral issues.
Normally, triglyceride is considered adjusting with HDL, and LDL. Accordingly, this study considered to examine the better accuracy by rediscretizing the attribute of triglyceride, in addition to rediscretized five factors conducted earlier. Triglyceride has been tried rediscretizing from 2 to 10 bins similar to other discretized factors, and has been chosen a 4-bin as the best accuracy for our dataset.
Table 14: Characteristics of Participants with rediscretized values of triglyceride
| Triglyceride (mg/dl) |
Participants (%) | |
| Normal | 0 – 130 | 36 |
| Normal to borderline High | 131 – 179 | 26 |
| Borderline High to High | 180 – 259 | 25 |
| High | > 259 | 13 |
According to Table 11, the rediscretized values of triglyceride were categorized into 4 bins, due to the best accuracy ranged from 2 to 10 bins. The new range of triglyceride values was divided starting from 0 – 130 mg/dl, 130 – 179 mg/dl, 180 – 259 mg/dl, and more than 259 mg/dl. Compared with the predefined clinical value, which was categorized into only 2 classes with the criteria of 0 -200 and more than 200 mg/dl., the new rediscretized values can provide more details. Cutoffs for discretized values of triglyceride provided some characteristics of participants, was shown in Table 14.
As seen in the Table 14, the people who has triglyceride in the range of 0 – 130 mg/dl is accounted for 36%, in the range of 131 – 179 mg/dl is accounted for 26%, in the range of 180 – 259 mg/dl is accounted for 25%, and in the range of more than 259 mg/dl is accounted for 13%. The finding found that most of participants in this study ware categorized in the normal to borderline high level. Additionally, the experimental result of this finding provided some significant information for people who were in the normal to borderline high level. In this level, there are 5225 participants involved. Within 5,225 people, there are 311 of them that has the heart disease, and 12 of them has the triglyceride less than 150 mg/dl. Furthermore, in the level of borderline high to high triglyceride value, 4,950 people were categorized in this level and 543 of them had the heart disease. With this number, there were 114 participants that have triglyceride value less than 200 mg/dl. Therefore, the rediscretization in this study can help as an early warning for people who look healthy but actually, they can have a chance to get the CHD, even they have the triglyceride value less than 200 mg/dl or even less than 150 mg/dl. They can have the primary prevention for being aware of eating food, exercise, and other positive behavior that will inverse with incurring a chance of CHD.
Consequently, rediscretization on the seventh major risk factor which is triglyceride is proved to produce the better predictive accuracy. The performance evaluation of comparative 7 rediscretized major risk factors conducted on the experiment is shown in Table 15.
Table 15: Comparison of the accuracy of different algorithms between with feature selection, without feature selection and Discretization, and with discretization and feature selection for 7 major risk factors
| Accuracy (%) | |||||
| NB | J48 | MLP | SVM | ||
| no discretization
no feature selection |
83.18 | 81.67 | 80.67 | 85.55 | |
| no discretization but
feature selection with RAE |
88.82 | 87.55 | 83.59 | 90.92 | |
| discretization
+ RAE |
4 Factors | 90.90 | 88.82 | 87.59 | 91.92 |
| 5 Factors | 91.33 | 89.02 | 90.55 | 92.58 | |
| 6 Factors | 92.05 | 90.67 | 91.89 | 93.10 | |
| 7 Factors | 93.47 | 92.18 | 92.57 | 95.50 | |
According to Table 15, the full dataset of 20,000 instances are employed for rediscretization. As the empirical studies in the earlier experiment proved that RAE with Bayes is the best hybrid model for selecting the relevant risk factors, rediscretization task in this phase is conducted and classified applying RAE with Bayes, based on accuracy measurement. Table 15 demonstrates the accuracy comparison of 4 different classifiers, which are Naïve Bayes, J48, MLP, and SVM, between without feature selection and without discretization, without discretization and feature selection by RAE, and with feature selection by RAE and with discretization for 4, 5, 6, and 7 risk factors respectively.
From the result shown in Table 15, the comparison of 3 experimental setting is shown. The predictive performance of CHD dataset for Thai people classified by 4 classifiers is presented without feature selection and without discretization in the first row. The second row presents critical risk factors associated with CHD are pioneered by feature selection but not fed into discretization method, which are classified by 4 classifiers. The last section demonstrates predictive accuracy of rediscretization method with RAE feature selection approach for 4, 5, 6, and 7 risk factors respectively. Rediscretization is set up on medical values, which is divided in 4 rounds. For the first round, we rediscretized on four major risk factors as age, Fasting Blood Sugar, Obesity and Triglyceride. In the second round, hypertension is added as the fifth major risk factors for rediscretization with the first four factors conducted in the first round. For the third round, LDL is the sixth factors included for rediscretization with the five factors performed in the second round. Finally, HDL is the last factors added on for rediscretization including the six factors performed earlier. As seen in all of the performance measurement, the results can be summarized that the proposed method explored and designed applying rediscretization produces the better predictive performance than classifying without rediscretization. Accordingly, the finding can be implied that all classifiers is achieved the improved accuracy when performing rediscretization. Additionally, rediscretization approach with RAE feature selection on 7 risk factors for Thai heart disease dataset classified by SVM produces the highest accuracy of 95.50%, when compared with predefined clinical value conducted in the experimental setup with no feature selection and with no rediscretization as 85.55%, and 90.92% as with the process of hybrid feature selection model but no rediscretization applied. Thus, the finding can infer that the more numbers of risk factors rediscretized, the more predictive accuracy are produced.
Finally, according to the result of rediscretization on clinical values shown above, we describe the characteristic of data of each rediscretized major risk factors in context. Thus, the example of data which are rediscretized from clinical values, categorized by men and women are demonstrated in Table 16.
Table 16: Comparison of Data Characteristics of Rediscretized values from major risk factors categorized by gender
| No CHD (n = 18,795) | With CHD (n = 1,205) | |||
| Male | Female | Male | Female | |
| 10,436 | 8,359 | 804 | 401 | |
| HDL (mg/dl) | ||||
| >= 60 | 2,738 | 2,407 | 228 | 110 |
| >=50 – 59 | 3,167 | 2,608 | 241 | 124 |
| >=40 – 49 | 2,627 | 2,163 | 206 | 103 |
| <40 | 1,724 | 1,361 | 129 | 64 |
| LDL (mg/dl) | ||||
| <=100 | 1,932 | 1,536 | 146 | 73 |
| >100 – 130 | 2,582 | 2,039 | 245 | 118 |
| >130 – 160 | 2,987 | 2,515 | 230 | 115 |
| >160 | 2,935 | 2,269 | 226 | 113 |
| Obesity (BMI) | ||||
| 19 – 22 | 2,288 | 1,848 | 176 | 88 |
| 23 – 25 | 3,744 | 3,024 | 288 | 144 |
| 26 – 30 | 2,704 | 2,184 | 208 | 104 |
| >30 | 1,664 | 1,344 | 128 | 64 |
| Triglyceride (mg/dl) | ||||
| 0 – 130 | 3,644 | 2,293 | 263 | 119 |
| >130 – 179 | 2,704 | 2,284 | 192 | 100 |
| >179 – 259 | 2,536 | 2,315 | 185 | 93 |
| >259 | 1,552 | 1,647 | 164 | 89 |
5. Conclusion and Discussion
The findings of this research can be implied that Education is the significant SES indicator that can incur CHD associated with the major risk factors. Support vector machine (SVM) is the best classifier for our dataset due to the best accuracy in every feature selection methods, and for the whole study. The proposed hybrid models of feature selection were explored to produce the better accuracy for CHD prediction on Thai people. Additionally, the objective of the research also concentrates on identifying SES factors and individual biological factors strongly associated with CHD by discovering the critical risk factors from both types which are significantly predictable for raising CHD. SES factors as education has been found as a significant indicator for raising CHD, after adjusting with major risk factors. Furthermore, SES factors as income is also revealed to be a significant predictor that have the great impact for causing CHD for Thai citizens, as well as the biological factors as gender, age, cholesterol, smoking, and diabetes.
Finally, this study proposed rediscretization approaches, which are confirmed to enhance the predictive accuracy of classifiers on CHD diagnosis. Equal Frequency Discretization with attribute selected by RAE and Bayes is proved to produce the accuracy improvements, as higher than the traditional classifiers conducted without feature selection and without rediscretization. SVM gives the highest predictive performance of 95.50% accuracy. After employing the rediscretiztion method in order to convert the predefined clinical values to the new boundaries of values with different number of intervals, we found that age, triglyceride, obesity, LDL, HDL, and hypertension are appeared to be significantly correlated with CHD. In addition, the finding can be implied that the proposed rediscretization method is proved to achieve the higher accuracy of predictive model, compared with the predefined values from medical field. Equal Frequency Discretization pioneered with attribute selection by RAE combined with Bayes generates the higher accuracy than the classification without rediscretization and with no feature selection, which indicates that the novelty of proposed rediscretization model is obviously superior to the predefined medical values. Nevertheless, in general, each individual country has its own individual characteristics, different physical conditions, lifestyles and environment. Thus, the similar parameter values are able to be measured and applied in alternative approaches for best suitable prediction incorporating with risk factors to derive the best performance measurement in predictive model.
- S. Dedkhar, “Risk factors of cardiovascular disease in rural Thai women,” The University of Arizona, https://repository.arizona.edu/ handle/10150/195629, 2006.
- P. Vathesatogkit, P. Sritara, M. Kimman, B. Hengprasit, T. E-Shyong, HL. Wee, M. Woodward, “Associations of lifestyle factors, disease history and awareness with health-related quality of life in a Thai Population,” pone, 7(11), 2012, https:/doi.org/10.1371/0449921.
- G.M. Egeland, A. Tverdal, R.M. Selmer, H.E. Meyer, “Socioeconomic status and coronary heart disease risk factors and mortality: Married residents, three countries, Norway,” The Norwegian Journal of Epidemiology, 13(1), 155 – 162, 2003.
- R.V. Luepker, D. Rosamond, R. Murphy, J.M. Sprafka, A.R. Folsom, P.G. McGovern, H. Blackburn, “Socioeconomic Status and Coronary Heart Disease Risk Factor Trends : The Minnesota Heart Survey,” 2172-2179, 2015, https:// doi:10.1161/01.CIR.88.5.2172.
- J.W. Lynch, G.A. Kaplan, R.D. Cohen, J. Tuomilehto, J.T. Salonen, “Do Cardiovascular Risk Factors Explain the Relation between Socioeconomic Status, Risk of All-Cause Mortality, Cardiovascular Mortality, and Acute Myocardial Infarction?,” in 1996 CRPIT 9th proceeding of the Australian Data Mining Conference in Research and Practice in Information Technology, 144(10), 934 – 942, 1996.
- S. Saravanakumar, S. Rinesh, “Effective Heart Disease Prediction using Frequent Feature Selection Method,” International Journal of Innovative Research in Computer and Communication Engineering, 2(1), 2767 – 2774, 2014.
- M. Shouman, T. Turner, R. Stocker, “Using Decision Tree for Diagnosing Heart Disease Patients,” in 9th proceedings of Australian Data Mining Conference in Research and Practice in Information Technology (CRPIT), 121, 23-29, 2011.
- M. Sultana, A. Haider, “Heart Disease Prediction using WEKA tool and 10-Fold cross-validation,” The Institute of Electrical and Electronics Engineers, March 2017.
- R. Sharmila, S. Chellammal, “A conceptual method to enhance the prediction of heart diseases using the data techniques,” International Journal of Computer Science and Engineering, 6(4), 21-25, 2018.
- T.F. Mubaroq, E. Sugiharti, I. Akhlis, “Application of Discretization and Information Gain on Naïve Bayes to Diagnose Heart Disease,” Journal of Advances in Information Systems and Technology, 1(1), 75-82, 2019, https://doi: 10.5121/csit.2013.3305.
- M.M. Kirmani, S.I. Ansarullah, “Prediction of Heart Disease using Decision Tree a Data Mining Technique,” International Journal of Computer Science and Network (IJCSN), 5(6), 885-892, 2016.
- C. Partanapat, C. Jandaeng, C. Jaruskulchai, A Hybrid Model for Coronary Heart Disease Prediction in Thai Population, Ph.D. Thesis, Walailak University, 2019.
- A. Hall Mark, “Correlation-based feature selection for machine learning,” The University of Waikato, 1999.
- K. Mani, P. Kalpana, “An Efficient Feature Selection based on Bayes Theorem, Self Information and Sequential Forward Selection,” International Journal of Information Engineering and Electronic Business, 6, 46-54, 2016, https://doi.org/10.5815/ijieeb.2016.06.06.
- S. Ravichandran, V.B. Srinivasan, C. Ramasamy, “Measuring Accuracy of Classification Algorithms for Chi-Square Attribute Evaluator in MCDR,” in 28th Advances in Engineering and Technology Convergence, Bangkok, Thailand, 2019.
- S.L. Pundir, S. Amitra, “Feature Selection using Random Forest in intrusion detection system,” International Journal of Advances in Engineering & Technology, 6(3), 1319-1324, 2013.
- A. Hall Mark, A. Smith Lloyd, “Practical feature subset selection for machine learning,” Springer, 1998.
- C. Arunkumar, M.P. Souraj, S. Ramakrishnan, “A Comparative Performance Evaluation of Supervised Feature Selection Algorithms on Microarray Datasets,” in 7th International Conference on Advances in Computing & Communications (ICACC), 209-217, 2017, https:// doi.org/10.1016/j.procs.2017.09.127.
- R. Kohavi, G.H. John, “Wrapper Subset Evaluation,” Artificial Intelligence, 273-324, 1997.
- B. K. Bhardwaj, S. Pal, “Data Mining: A prediction for performance improvement using classification,” International Journal of Computer Science and Information Security (IJCSIS), 9(4), 136-140, 2011.
- D. N. Bhargava, G. Sharma, D. R. Bhargava, M. Mathuria, “Decision Tree Analysis on J48 Algorithm for Data Mining,” International Journal of Advanced Research in computer Science and Software Engineering, 3(6), 1114-1119, 2013.
- S. Bhatia, P. Prakash, G.N. Pillai, “SVM based decision support system for heart disease classification with inter-coded genetic algorithm to select critical features,” in 2008 Proceedings of the World Congress on Engineering and Computer Science (WCECS), San Francisco, USA, 2008. http://www.iaeng.org/publication/WCECS2008.
- E. Ferdousy, M. Islam, M. Matin, “Combination of Naïve Bayes Classifier and K-Nearest Neighbor in the Classification Based Predictive Models,” Computer and Information Science, 6(3), 48-56, 2013, https://doi:10.5539/cis.v6n3p48.2013.
- B. Abdullah, I. Abd-Alghafar, G. I. Salama, A. Abd-Alhafez, “Performance evaluation of a genetic algorithm based approach to network intrusion detection system,” in 13th international conference on aerospace sciences and aviation technology, Military Technical College, Kobry Elkobbah, Cairo, Egypt, 1-17, 2009. https:// doi: 10.21608/asat.2009.23490.
- J. Anil, Z. Douglas, “Feature selection: Evaluation, application, and small sample performance,” in 1997 IEEE transactions on pattern analysis and machine intelligence, 19 (2), 153-158, 1997.
- M.A. Jabbar, B.L. Deekshatulu, P. Chandra, “Heart disease prediction using lazy associative classification,” in 2013 International Multi-Conference on Automation, Computing, Communication, Control and Compressed Sensing (iMac4s), 40-46, 2013.
- H. Liu, R. Setiono, “Feature selection via Discretization,” in 1997 IEEE Transactions on Knowledge and Data Engineering, 9(4), 642-645, 1997. https://doi.org/10.1109/69.617056.
- A. Rajalakshmi, R. Vinodhini, K. Fathima Bibi, “Data Discretization Technique Using WEKA Tool” International Journal of Computer Science & Engineering Technology (IJCSET), 6(8), 293-298, 2016.
- P.W. Wilson, R.B. D’Agostino, D. Levy, A.M. Belanger, H. Silbershatz, W.B. Kannel, “Prediction of Coronary Heart Disease Using Risk Factor Categories,” American Heart Association, 97(18), 1837-1847, 1998, doi.org/10.1161/01.CIR.97.18.1837.
- R.S. Vasan, M.G. Larson, E.P. Leip, W.B. Kannel, D. Levy, “Assessment of frequency of progression to hypertension in non-hypertensive participants in the Framingham Heart Study: a cohort study,” Lancet, 358, 1682–1686, 2001, doi: 10.1016/S0140-6736(01)06710-1.