Multi-Objective Optimization when Surface Grinding the 3X13 Steel by Combining the General Reduced Gradient Algorithm and Harmonic Mean Method

Adv. Sci. Technol. Eng. Syst. J. 5(5), 395–400 (2020);
 DOI: 10.25046/aj050550
In this paper, the multi-objective optimization process was applied for the surface grinding process of 3X13 steel using an aluminum oxide grinding wheel (WA46J7V1A). For each experiment, three cutting parameters, including the workpiece velocity, feed rate, and the depth of cut, were controlled to change according to the experimental matrix. At each experiment, surface roughness and vibrations of the technology system in three directions (X, Y, and Z) were measured and analyzed. The surface roughness and vibration amplitudes were modeled as a quadratic function of workpiece velocity, feed rate, and the depth of cut. The General Reduced Gradient (GRG) algorithm and Harmonic Mean (HM) method were combined to solve the multi-objective optimization problem about the surface grinding process of 3X13. The optimized values of surface roughness and vibration amplitudes (in X, Y, Z directions) were 0.901 µm, 0.815 µm, 1.594 µm, and 0.599 µm, respectively. These results that were determined at the cutting conditions were workpiece velocity of 14.428 m/min, the feed rate of 5.789 mm/stroke, and cutting depth of 0.013 mm. By conducting the grinding process at the optimal values of grinding conditions, the experimental results of surface roughness and system vibration amplitudes were quite close to that one of the predicted results. This proposed approach can be applied to improve the machining quality of the surface grinding process of 3X13 steel.
1. Introduction
Surface roughing of a part when machined by the grinding method, has a great influence on the workability and life of the product. Therefore, it is often selected as one of the most important factors for evaluating the efficiency of the grinding process. The vibration of the technology system also has a great influence on the accuracy and quality of the part surface. Therefore, researching solutions to limit the vibration amplitude of the technological system also plays an important role in grinding technology. To obtain the small values of the surface roughness and vibrations of the technological system to ensure the requirements of the product quality, determining the optimum value of the cutting parameters that needs to be done for each specific case.
The response surface method (RSM) was used to determine the optimum values of the cutting depth, feed rate, and the dressing depth. This method was applied in grinding process of AISI 1080 steel by using the A60V5V grinding wheel to obtain the minimum value of machined surface roughness [1]. RSM was applied to determine the optimum value of the grinding wheel speed, feed rate, and cutting depth when using the AA46/54 K5V8 grinding wheel to grind the EN 8 steel. The purpose of the optimization process in this study was an assurance that the surface roughness has the lowest value with the highest material removal rate [2]. To obtain the minimum value of surface roughness, RSM was used to determine the optimum values of traverse speed, depth of the cut, and the number of passes in the grinding process of Inconel 718 alloy [3]. RSM was applied to determine the optimum value of wheel speed, work speed, depth of cut, abrasive mesh, and grinding direction (up and down grinding) to ensure the minimum value of surface roughness when grinding Inconel 625 alloy [4]. RSM was applied to determine the optimal value of the cutting depth, the number of grinding strokes, and wheel grade to ensure a minimum surface roughness, maximum surface hardness, and maximum flatness when grinding spheroidal graphite cast iron using the green silicon carbide grinding wheel [5].
To ensure the smallest surface roughness, Taguchi method was applied to determine the optimum value of the coolant concentration and flow of the cooling fluid, feed rate, workpiece velocity, and cutting depth when grinding 9CrSi steel by using Cn46TB2GV1,300.32,127.30 m/s grinding wheel (Hai Duong grinding wheel, Vietnam) [6]. Taguchi method and RSM were combined to determine the optimum values of grinding grain size, the cutting depth, and the feed rate when grinding the AISI 1035 steel. The purpose of this study is also to ensure that the surface roughness of the machined part has a minimum value [7]. The WA36G5VBE grinding wheel was used to perform experiments with three materials, including mild steel, cast iron, and carbon steel (three different hardness levels). In this study, the Taguchi method was applied to determine the optimum values of the workpiece hardness, workpiece velocity, and the depth of cut to obtain the minimum value of surface roughness [8].
Taguchi method was applied to investigate the influence of cutting parameters on the system vibrations when grinding the C9rSi steel alloy. The obtained results showed that the cutting parameters have a significant influence on the system vibrations [9]. Taguchi method was applied to determine the optimum values of the grinding wheel speed, workpiece speed, and the feed rate to ensure that the vibration amplitudes of the grinding wheel have the smallest values. In this study, the 1-A-355-38-127-C-46-J-7-V grinding wheel was used to grind the S45C steel [10].
Taguchi-gray method was applied to determine the optimum values of the grinding wheel speed, workpiece speed, and feed rate when grinding OCR12VM tool steel using A80QV grinding wheel. The purpose of this study is to ensure that the surface roughness, vibration in the X direction, and vibration in the Z direction have the smallest values [11].
Although the studies to determine the optimal values of the cutting parameters to ensure the surface roughness and vibrations of the technological system having the smallest value, that has been carried out in many studies. However, the studies that were performed for the surface grinding process of the 3X13 steel have been not mentioned. Meanwhile, 3X13 stainless steel is often used to make the machine parts with high precision, working in extreme conditions (such as valves of air compressors, etc.). For these parts, the surface grinding method is often chosen as the final machining method for important surfaces. So, it is necessary to study the surface roughness and vibrations of the technological system when surface grinding this steel.
On the other hand, in the previous studies, when determining the optimal values of cutting parameters in the surface grinding process, two popular methods were often used that were the response surface method and the Taguchi method. The studies that applied the combination of the GRG algorithm and the HM method to solve the optimization process of surface grinding processes have not been mentioned. Therefore, the combination of the GRG algorithm and the HM method to determine the optimal value of the workpiece velocity, the feed rate, and the cutting depth when grinding 3X13 steel is to ensure that both surface roughness and vibration amplitudes in the three directions X, Y, Z having the small values that will contribute to the novelty of both the method and the research objects in the grinding technology.
2. Experimental Method
2.1. Experimental Grinding Wheel and Machine
The grinding wheel was used in this work, which had the symbol of WA46J7V1A–180’13’31.75 as described in Figure 1. The experiments were carried out in the surface grinding machine APSG-820/2A.
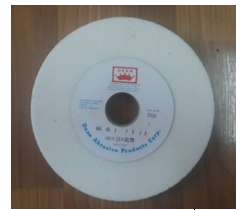
Figure 1: Experimental grinding wheel
2.2. Experimental Workpiece
The experimental workpiece material is 3X13 steel that was made by Russia. The chemical compositions of the workpiece are listed in Table 1. The equivalent sign of 3X13 steel, according to several Standard are described in Table 2. The properties of 3X13 steel were listed in Table 3. The workpieces dimensions are the length of 60 mm, the width of 40 mm, and the height of 10 mm, as shown in Figure 2.
Table 1: Chemical Composites of 3X13 Steel
| Element | C | Si | Mn | Cr | S |
| (%) | 0.42 | 1.00 | 1.00 | 13.00 | 0.005 |
Table 2: Equivalent Symbol of 3X13 Steel of According Several Standard
| Russia | United States | Germany | Japan | France | England | Europe | Italy | Spain | China | Sweden | Finland | Czech |
| GOST | SAE | DIN | JIS | AFNOR | BS | EN | UNI | UNE | GB | SS | PN | CSN |
| 3X13 | 420 | 1.4028 | SUS420J2 | 410F21 | 420S45 | 1.4028 | GX30Cr13 | F.3403 | 3Cr13 | 2304 | 3H13 | 17023 |
Table 3: The Properties of 3X13 Steel
| Density, g/cm3 | 7.8 |
| Melting point, °C | 1450 – 1510 |
| Specific heat capacity, J/kg | 460 at 0 – 1000C |
| Electrical resistivity, μΩ·m | 0.55 at 200C |
| Elastic modulus, MPa | 200 |
| Thermal conductivity, W/m | 24.9 at 1000C |
| Coefficient of thermal expansion, μm/m | 10.3 at 0 – 1000C |
| 10.8 at 100 – 3150C | |
| 11.7 at 315 –5380C |
2.3. Measurement System
MITUTOYO-Surftest SJ-210 surface roughness tester was used to measure the machining surface roughness of the product (Figure 2). The evaluation length was fixed at 0.8 mm. The surface roughness was measured perpendicular to the cutting velocity direction and repeated three times following three repeated times of each cutting test. The average value of surface roughness in three consecutive times was used for analysis and evaluation.
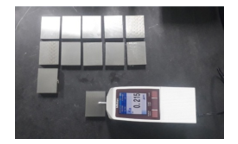
Figure 2: The experimental workpiece and surface roughness tester
The block diagram of the experimental system was described in Figure 3. The vibration measurement system that included the acceleration sensor Type 4525-B-001, the data processing box, and the PULSE software was used to measure the system vibrations. For each experiment, the vibrations of the system were measured simultaneously in three directions (X, Y, Z). The detail is illustrated in Figure 4.
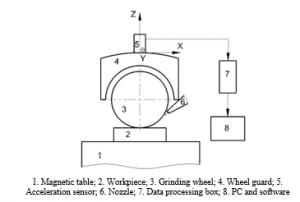
Figure 3: Block diagram of the experimental system
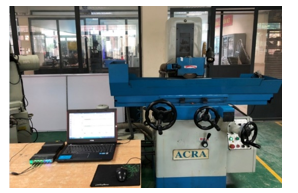
Figure 4: Setup of vibration measurement
2.4. Experimental Matrix
The experimental matrix was designed according to the Box-Behnken form. Figure 5 presents the Box-Behnken experimental diagram with three variables (including workpiece velocity, feed rate, and depth of cut). By this form, each cutting parameter has three levels corresponding to the three coding values (-1, 0, and 1), which were described in Table 3. In Figure 5, each point represents an experiment. C is the central experiment point. In the central experiment point, the workpiece velocity, feed rate, and depth of cut were the average values of each parameter (10 m/min, 6 mm/stroke, and 0.015 mm, respectively). The number of experiments at the central point is three times. The experimental matrix was described in Table 5.
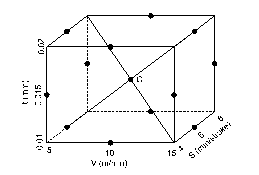
Figure 5: Box-Behnken experimental design with three variables
Table 4: Input Factors and The Their Values at the Coded Levels
| Factors | Symbol | Unit | The values at the coded levels | ||
| -1 | 0 | 1 | |||
| Workpiece velocity | V | m/min | 5 | 10 | 15 |
| Feed rate | S | mm/stroke | 4 | 6 | 8 |
| Depth of cut | t | mm | 0.01 | 0.015 | 0.02 |
Table 5: Experimental Matrix and Results
| No. | Cutting Conditions | Surface Roughness | Vibration Amplitudes | ||||
| V
(m/min) |
S (mm/
stroke) |
t
(mm) |
Ra
(µm) |
Ax
(µm) |
Ay
(µm) |
Az
(µm) |
|
| 1 | 10 | 4 | 0.01 | 0.332 | 0.191 | 0.277 | 0.212 |
| 2 | 15 | 6 | 0.01 | 0.377 | 0.206 | 0.297 | 0.333 |
| 3 | 15 | 8 | 0.015 | 1.128 | 0.977 | 1.960 | 1.215 |
| 4 | 10 | 8 | 0.01 | 1.068 | 0.560 | 0.839 | 0.693 |
| 5 | 5 | 8 | 0.015 | 0.508 | 0.443 | 0.687 | 0.599 |
| 6 | 5 | 4 | 0.015 | 0.490 | 0.199 | 0.160 | 0.242 |
| 7 | 15 | 6 | 0.02 | 0.761 | 0.291 | 0.324 | 0.36 |
| 8 | 15 | 4 | 0.015 | 0.799 | 0.18 | 0.232 | 0.272 |
| 9 | 10 | 8 | 0.02 | 1.263 | 0.571 | 0.968 | 0.581 |
| 10 | 5 | 6 | 0.02 | 0.886 | 0.277 | 0.343 | 0.387 |
| 11 | 10 | 6 | 0.015 | 1.229 | 0.282 | 0.449 | 0.419 |
| 12 | 10 | 4 | 0.02 | 1.107 | 0.217 | 0.313 | 0.322 |
| 13 | 10 | 6 | 0.015 | 1.192 | 0.338 | 0.502 | 0.45 |
| 14 | 5 | 6 | 0.01 | 1.164 | 0.193 | 0.233 | 0.32 |
| 15 | 10 | 6 | 0.015 | 1.176 | 0.341 | 0.499 | 0.459 |
2.5. Machining Conditions
The experiments were conducted in the grinding conditions as following: Grinding wheel velocity: 26 (m/s). Cooling fluid: emulsion 10%, overflow irrigation method, the volume flow rate of 5 (lit/min). Dressing conditions: dressing depth 0.01 (mm), dressing feed rate: 100 (mm/min).
3. Experimental Results and Discussions
The experimental results of surface roughness and vibration amplitudes in three directions (X, Y, Z) were stored and described in Table 5 and Figure 6.
It seems that the tendencies of vibration amplitudes were the same. When the system vibration amplitude in one direction increased, the vibration amplitudes in other directions also increased, and vice versa. The phenomenon can be explained that the vibrations in the machining process caused by many factors such as the stiffness of the system, the damping ratio of the system, cutting forces, etc. In all parameters, cutting forces have a significant effect on the vibrations. When cutting forces increase, the vibrations will increase. Besides, in the grinding process, the cutting forces were formed in all directions (X, Y, Z), and when cutting forces increases, the vibrations will increase in all directions. So, the tendencies of vibration amplitudes were the same in different directions.
Figure 6 also showed that the tendency of the surface roughness was also quite the same as the tendency of vibration amplitudes. The phenomenon can be explained that when the vibrations were encreased in X and Y direction, it made the machining surface wave also increasing. Besides, when the vibration in Z direction increased, the cutting depths of the cuts of grinding grains leaving on the surface of the part increased. So, when the vibrations increase, in most cases, the surface roughness also increases.
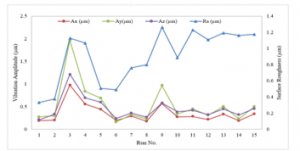
Figure 6: The relationship between surface roughness and vibration amplitudes
In all experiments, the surface roughness was smallest at the experiment number 1 (Ra = 0.332 µm). At this experiment, the vibration amplitude in Z direction was also the smallest (Az = 0.212 µm), while the vibration amplitudes in X and Y directions were not the smallest. In the X direction, the smallest vibration amplitude was 0.18 (µm) that was obtained at experiment number 8, while in the Y direction, the smallest vibration amplitude was 0.1608 (µm) that was obtained at experiment number 6. These results can be explained as follows: vibration components and surface roughness are not only dependent on the cutting parameters but also dependent on the interaction between those parameters, as well as dependent on other factors in the machining process. The complex influence of the factors on the vibration and surface roughness components has different roles and degrees. It is not easy to explain these phenomena. Therefore, more experimental studies are needed to clearly explain these phenomena. It means that it is impossible to determine the value set of V, S, t to obtain the smallest values of all the objective functions (Ra, Ax, Ay, and Az). It is only possible to determine the value set of V, S, t to obtain the small harmonic values of Ra, Ax, Ay và Az. So, it is necessary to solve the multi-objective optimization problem. This issue was presented in the next section.
4. Multi-Optimization by Using General Reduced Gradient Algorithm and the Harmonic Mean Method
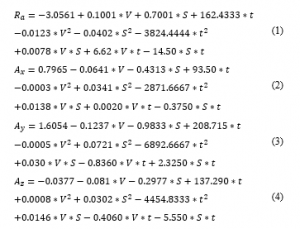
4.1. Surface Roughness and Vibration Amplitude Models
From the experimental results in Table 5, the surface roughness and vibration amplitudes in three directions (X, Y, Z) were modeled as a quadratic function of workpiece velocity, feed rate, and depth of cut as expressed by (1) to (4). These equations were the basis to solve the multi-objective optimization problem when surface grinding of 3X13 steel. The factor of machining conditions (V, S, t) will determine by solving the multi-objective optimization problem when considering all 4 of these models simultaneously.
4.2. General Reduced Gradient Algorithm
The GRG algorithm was used to solve nonlinear problems. The basic principles and ways to solve the problem by the GRG algorithm have been detailed in several studies [12] and [13]. Currently, the GRG algorithm has also been integrated into the solver tool of Microsoft Excel. Using Microsoft Excel to solve problems with the GRG algorithm has the advantage of being non-programming and convenient even for people who are not specialized in mathematics or computer science.
4.3. Harmonic Mean Method
The HM method was introduced the first time in 1999 [14]. This is the new approach method to solve the multi-objective optimization problems in the case without enough information on the evaluation criteria. In the multi-objective optimization problems, there is not enough information about the weight number of the objective functions. This method can be solved the problems most harmoniously. According to this method, the minimum of the overall function can be expressed by (5) [15].
![]()
where f(xi) is the individual objective functions
And then, the optimization problem can be rewritten by (6).
4.4. Optimization Process and Results
To solve the multi-objective optimization problem for surface roughness and vibration amplitudes in X, Y, Z directions, the constraints of objective functions and input parameters (workpiece velocity, feed rate, and depth of cut) must be determined. The regression models of surface roughness and vibration amplitudes were built based on the experimental matrix and data, so the constraints of cutting conditions and objective functions were determined by (7) and (8).
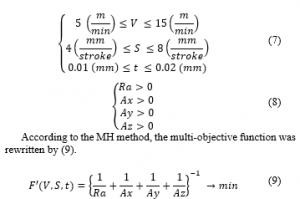
Applying the GRG algorithm to solve (9) with the constraints as by (7) and (8). The optimal values of the input parameters and the objective functions were obtained and listed in Table 7.
Using the optimal values of cutting parameters (V, S, t) from Table 7, the grinding tests were conducted to verify the optimal values of the objective function. The tested results were stored in Table 8.
Table 7: The Optima Values of the Parameters and Objective Functions
| V
(m/min) |
S
(mm/ stroke) |
t
(mm) |
Ra
(µm) |
Ax
(µm) |
Ay
(µm) |
Az
(µm) |
| 14.428 | 5.789 | 0.013 | 0.826 | 0.316 | 0.496 | 0.010 |
Table 8: Verified Results of Optimal Values of Grinding Cutting Parameters
| Test No. | V
(m/min) |
S
(mm/ stroke) |
t
(mm) |
Ra
(µm) |
Ax
(µm) |
Ay
(µm) |
Az
(µm) |
| 1 | 14.428 | 5.789 | 0.013 | 0.8442 | 0.349 | 0.502 | 0.011 |
| 2 | 0.8453 | 0.352 | 0.519 | 0.011 | |||
| 3 | 0.8258 | 0.365 | 0.522 | 0.011 | |||
| Average | 0.838 | 0.355 | 0.514 | 0.011 | |||
| The difference with the optimal values | 0.012 | 0.039 | 0.018 | 0.001 | |||
The tested results were compared with the optimized results. The tested results were quite close to the optimized results. The difference in percentage between the optimizing process and testing process of surface grinding was 1.43% for surface roughness, 10.99% for vibration amplitude in the X direction, 3.50% for vibration amplitude in the Y direction, 9.09% for vibration amplitude in the Z direction. Table 9 presents the comparison results of surface roughness deviation between calculated results and experimental results according to the optimum values of the cutting parameters in different studies. Deviations between calculated values and experimental values of vibration components were not included in this table. The reason is that until now, it seems that there have not been any studies on the surface grinding process with the optimization of all three parameters Ax, Ay, and Az, then conducting experiments to verify the optimal results as the done works of this study.
Table 9: Comparison of the deviations of different studies
| Method | Combining the GRG algorithm and the HM method | Taguchi method | Response surface method | Taguchi method with Grey Relational Analysis |
| Source | This study | Reference [6] | Reference [3] | Reference [16] |
| Deviation % | 1.43 | 7.18 | 9.85 | 5.3 |
The results from Table 9 showed that, although it must ensure the harmony between the surface roughness criteria and the vibration component criteria, the deviation in surface roughness between calculated results and the experimental results in this study was still much smaller than that of some other methods. This result has shown outstanding advantages in solving the multi-objective optimization problem by combining the GRG algorithm and the HM method. So, the optimal value of cutting parameters in this study can be used to improve the surface grinding process of 3X13 steel.
5. Conclusions
In this study, the surface roughness and vibration amplitudes in X, Y, Z directions was modeled as a quadratic function of workpiece velocity, feed rate, and depth of cut in the surface grinding process of 3X13 steel. The GRG algorithm and MH method were successfully combined to solve the multi-objective optimization problem. The optimized values of surface roughness and vibration amplitudes (in X, Y, Z directions) were 0.838 µm, 0.355 µm, 0.514 µm, and 0.011 µm, respectively. These results that were determined at the cutting conditions were workpiece velocity of 14.428 m/min, the feed rate of 5.789 mm/stroke, and cutting depth of 0.013 mm. The optimization results of the surface grinding process were successfully verified by the tested results.
- S. Periyasamy, M. Aravind, D. Vivek, Dr. K. S. Amirthagadeswaran, “Optimization of Surface Grinding Process Parameters for Minimum Surface Roughness in AISI 1080 Using Response Surface Methodology”, Advanced Materials Research, 984, 118-123, 2014, doi: https://doi.org/10.4028/www.scientific.net/AMR.984-985.118.
- B. Dasthagiri, Dr. E. Venu Gopal Goud, “Optimization Studies on Surface Grinding Process Parameters”, International Journal of Innovative Research in Science, Engineering and Technology, 4(7), 6148- 6156, 2015, doi: 10.15680/IJIRSET.2015.0407166.
- N. A. Yaakob, Hema Nanthini Ganesan, Nurul Hatiqah Harun, Raja Lzamshah, Mohd Shahir Kasim, Jaharah A. Ghani, C. H. Che Haron, “Influence of grinding parameters on the surface finish of Inconel 718″, Journal of Mechanical Engineering, 3(2), 199-209, 2017.
- R. de SouzaRuzzi, Rosemar Batistada Silva, Leonardo Rosa Ribeiroda Silva, Álisson RochaMachado, Mark JamesJackson, AmauriHassui, “Influence of grinding parameters on Inconel 625 surface grinding”, Journal of Manufacturing Processes, 55, 174-185, 2020, doi: https://doi.org/10.1016/j.jmapro.2020.04.002.
- C. S Sumesh, Harikrishna S, Harikrishnan S Nair, Mahesh V, Ramkumar R, “Experimental Investigation and Optimization of Surface Grinding of Spheroidal Graphite Cast Iron Using Response Surface Methodology”, Journal of Mechanical Engineering Research and Developments, 43(2), 305-321, 2020, doi: https://jmerd.net/02-2020-322-335/.
- L. Tung, Vu Ngoc Pi, Do Thi Thu Ha, Le Xuan Hung, Tien Long Banh, “A Study on Optimization of Surface Roughness in Surface Grinding 9CrSi Tool Steel by Using Taguchi Method”, Lecture Notes in Networks and Systems, 63, 100–108, 2019, doi: https://doi.org/10.1007/978-3-030-04792-4_15.
- M. Aravind, Dr. S. Periyasamy, “Optimization of Surface Grinding Process Parameters By Taguchi Method And Response Surface Methodology”, International Journal of Engineering Research & Technology, 3(5), 1721-1727, 2014.
- S. Talapatra, Ishrat Islam, “Optimization of Grinding Parameters for Minimum Surface Roughness using Taguchi Method”, International Conference on Mechanical, Industrial and Energy Engineering, ICMIEE-PI-140191, 1-6, 2014.
- T. Nguyen, Nhu-Tung Nguyen, Long Hoang, “A study on the vibrations in the external cylindrical grinding process of the alloy steels”, Modern Physics Letters B, 2040150, 1-6, 2020, doi: https://doi.org/10.1142/S0217979220401505.
- Cheng-Chi Wang, Xin-Xiang Zhuo, Yong-Quan Zhu, “Optimization Analysis of Vibration for Grinder Spindle”, Sensors and Materials, 32(1), 407–416, 2020, doi: https://doi.org/10.18494/SAM.2020.2603
- Hendri Jumianto, Suhardjono, Sampurno, M.Khoirul Effendi, “Multi-response optimization on vibration and surface roughness of the process parameter surface grinding of OCR12VM using Taguchigrey method”, AIP Conference Proceedings, 2187(030015), 1-8, 2019, doi: https://doi.org/10.1063/1.5138319.
- Hong-Tau Lee, Sheu-Hua Chen, He-Yau Kang, “A Study of Generalized Reduced Gradient Method with Different Search Directions”, Measurement Management Journal, 1(1), 25-38, 2004.
- Leon S. Lasdon, Richard L. Fox, Margeryw. Patner, “Nonlinear optimization using the generalized reduced gradient method”, Revue française d’automatique, informatique, recherche opérationnelle. Recherche opérationnelle, 8(3), 73-103, 1974, doi: http://www.numdam.org/item/?id=RO_1974__8_3_73_0.
- Da-Feng Xia, Sen-Lin Xu, and Feng Qi, “A proof of the arithmetic mean-geometric mean-harmonic mean inequalities”, RGMIA Research Report Collection, 2(1), 85-87, 1999.
- Nguyen Van Hieu, “A new approach to solving a multi-criteria decision problem with partial information about criteria”, The Journal of Science and Technology of Danang University, 1(74), 99-102, 2014.
- Luu Anh Tung, Vu Ngoc Pi, Vu Thi Lien, Tran Thi Hong, Le Xuan Hung, Banh Tien Long, “Optimization of dressing parameters of grinding wheel for 9CrSi tool steel using the Taguchi method with grey relational analysis”, IOP Conf. Series: Materials Science and Engineering, 635(012030), 1-8, 2019, doi:10.1088/1757-899X/635/1/012030.