Water Availability for a Self-Sufficient Water Supply: A Case Study of the Pesanggrahan River, DKI Jakarta, Indonesia
Volume 5, Issue 5, Page No 348-355, 2020
Author’s Name: Ramadhani Yanidar1,2, Djoko Mulyo Hartono3,a), Setyo Sarwanto Moersidik3
View Affiliations
1Department of Civil Engineering, Faculty of Engineering, Universitas Indonesia, Depok, 16242, Indonesia
2Department of Environmental Engineering, Faculty of Architecture Landscape and Environmental Technology, Universitas Trisakti, Jakarta 11440, Indonesia
3Environmental Engineering Study Program, Department of Civil Engineering, Faculty of Engineering, Universitas Indonesia, Depok, 16242, Indonesia
a)Author to whom correspondence should be addressed. E-mail: djokomh@eng.ui.ac.id
Adv. Sci. Technol. Eng. Syst. J. 5(5), 348-355 (2020); ![]() DOI: 10.25046/aj050543
DOI: 10.25046/aj050543
Keywords: Dependable flow, GIS, System dynamics, Water supply, Water demand

Export Citations
The research will explore the challenges of using local water sources inside the city for a self-sufficient urban water supply by developed a system dynamics model. This study aims to evaluate and understand the Pesanggrahan River appropriateness as a raw drinking water source through a conceptual model that can accurately represent the interactions between the water supply and demand system. A set of time series data for the monthly precipitation and river flow rates at two stations from 2002 to 2016 were used to calculate the 90% dependable river flow fluctuations over one year. The results showed that water availability becomes limited in July, August, and September. Simulation results demonstrated that the Pesanggrahan River could supply 450 liters/s. The water demand exceeded the supply if the average water consumption 150 liters/capita/day for 100% service coverage. However, they will balance when service coverage 66 %, but reducing water consumption to 99 liters/capita/day will increase service coverage to 100%. The average water consumption and service coverage forming a linear equation relationship Y = 99.20x-0.99 with a correlation factor R2 = 0.99. This research contributes to enhancing the resilience of the water supply system. It provides a well-founded, flexible, and realistic approach to recognize and deal with challenges to local raw water resources limitation that inherent with uncertainties in water resources management.
Received: 03 July 2020, Accepted: 16 August 2020, Published Online: 17 September 2020
1. Introduction
Freshwater is essential to sustain life, and its role is irreplaceable and of high value to its users. Water is vital, finite, and fugitive [1]. Although water is a renewable resource, its availability is limited. As a result of its volatile nature, it is quite challenging to determine the limits of water resources and assess flow variations. Climate change has various implications. The spatial variability of water due to climate change is quite large. For planning purposes, it is not realistic to rely on estimates of extreme rainfall across an entire city.
Therefore, local or decentralized raw water sources should be used as an alternative water supply for the betterment of the population [2]. Furthermore, independent diversification of water supplies can help overcome climate uncertainty and natural variability, which is a significant challenge for cities around the world [3]. For planning purposes, it is not realistic to rely on estimates of extreme rainfall across an entire city.
Currently, raw water resources for the centralized water supply mostly emphasize outside the cities, namely [4]-[7]. Studies on local raw water research have been proposed groundwater and treated wastewater for the landscape in the next decade [8]. However, the opportunities to use local river water that passes through cities are still rarely explored as raw water sources. In order to fill this gap, this research will explore the challenges of using local water sources inside the city for self-sufficient urban water supply by developed a system dynamics model.
The water supply services in DKI Jakarta, Indonesia, use centralized piped systems. The primary raw water sources are currently the reservoirs that are ± 70 km away from Jakarta, and the treated water primarily comes from Tangerang, which acts as a buffer city. The local water resources in DKI Jakarta only fulfill 5.7% of its current water demand. The service coverage has reached only 60.27%. Therefore, people still depend on groundwaters as alternative clean water sources. Over-abstraction of groundwater has sharpened inequalities in access to water within and beyond the centralized piped network [9]. Besides, variations of groundwater extraction caused land subsidence in Jakarta [10]. Consequently, it needs additional raw water resources for Greater Jakarta to improve the services of centralized piped systems and facilitate the reduction of groundwater use.
Thirteen rivers cross DKI Jakarta in Indonesia. These rivers have the potential to increase the raw water through rainwater runoffs, which are almost entirely discharged into the sea to prevent flooding. Pesanggrahan River is one of the raw water sources inside the DKI Jakarta area. Due to its water quality, it is adequate for use as a raw drinking water source [11]. However, it is necessary to prove that the quantity of its supply is sufficient for decentralized raw water services accommodating the inhabitants of the sub-basin of the Pesanggrahan River in the DKI Jakarta subregion.
Water availability is associated with the dependable flow of specific probabilities that determine the minimal river discharge characteristics. This analysis of the Pesanggrahan River was calculated based on a 90% dependable flow. The managing water supply systems need a deep understanding of all of the issues. Controlling the integrated system, which has a causal relationship with the different subsystems, requires appropriate strategies and policies. Therefore, this study utilized a system dynamics model to represent and understand the causal interaction between the quantity of raw water sources and the increase in its requirements
The dynamic feedback interaction between the available raw drinking water sources and the consumer population reflects the continually evolving problems in the system. Fortunately, researchers can formulate a feasible policy based on the estimation and simulation results provided by a system dynamics model. To meet its population’s requirement for raw drinking water sources, DKI Jakarta must adopt a management strategy to balance the water supply and demand.
This study aims to evaluate and understand the Pesanggrahan River’s appropriateness as a raw drinking water source through a conceptual model that can accurately represent the interactions between the water supply and demand system. This research will contribute to enhancing the resilience of the water supply system for inhabitants in DKI Jakarta
2. Material and Methods
This study developed a water availability model for a self-sufficient water supply using system dynamics. The water quantity variable was based on a historical hydrology data analysis of natural water flow from the upstream area. The simulation focused on water availability during one-year fluctuations based on dependable river flow and potential runoff.
Concerning [12]-[14], this study employed the main variables related to hydrology analysis—namely, monthly rainfall, monthly river discharge, basin area, sub-basin land cover, and rainfall-runoff. The variables in the model were based on the results of the Pesanggrahan River analysis, using the 90% dependable discharge data. Furthermore, the alternative sources of additional raw water included reused collected rainfall, which varied with the seasons.
2.1. Study Area and Data Sources
The study area was constrained to the sub-basin of the Pesanggrahan River in the DKI Jakarta subregion, which has several tributaries entering the main river flow to DKI Jakarta Province, Indonesia. The precipitation and river discharge data were obtained from the Ciliwung Cisadane Rivers Area Agency (BBWSCC). The Pesanggrahan River discharge data came from two different monitoring stations, namely Sawangan Station (2000–2016) and Kebun Jeruk Station (2002–2016). Sawangan station was the sole source of precipitation data for 2009 to 2016. The digital elevation model (DEM) used the 8m x 8m map sourced from the National Geospatial Information Center (INA- Geoportal).
2.2. Water Availability Analysis Method
The duration curve method was used for the water availability analysis, while the dependable flow was calculated using the Weibull probability formula [15] with a flow duration curve based on (1) :
![]()
Where, P(X ≥ x) = the probability of the occurrence of variable X (discharge) being equal to or greater than x m3/s (the percentage probability), m = the data rating, the order number of the discharge n = the amount of data, the number of data X = the series data discharge, the dependable flow = the reliable discharge when the probability matches the allotment of the source of clean water, and P(X ≥ Q90%) = 0.9.
To calculate the potential runoff, we used the rational modification method based on the following equation (2) :
![]()
where Q = the potential runoff (m3/month), Ci = the land cover runoff coefficient, Ai = the area of land cover (Ha), R = the 90% dependable monthly rainfall at the Sawangan Station (mm/month), and A = the area of the sub-watershed of the Pesanggrahan River (Ha).
Figure 1 shows our concept for determining the potential runoff coefficient using a geographic information system (GIS) [16]. The spatial slope classification data used in the present study was the result of an analysis of national DEM data of 8m x 8m using GIS tools. A simple linear relationship between the potential runoff coefficients and the surface slope was used to calculate the potential runoff coefficient, as shown in (3) [17]:
![]()
where C is the potential runoff coefficient for a surface slope S (%), S0 (%) is a slope constant for different land use and silty clay soil combinations, and C0 is the coefficient of the potential runoff representing the values belong to [17].
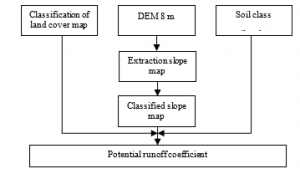
Figure 1: The concept of determining the potential runoff coefficient
2.3. A System Dynamics Model for Water Availability
A system dynamics model development used the PowerSym tool. The model was developed based on a causal loop diagram (CLD) and stock-flow diagram (SFD) to represent and understand the causal interaction between the quantity of a raw water source and the increases in its requirements
3. Result and Discussion
3.1. Dependable Flow of Pesanggrahan River
The maximum, minimum, and 90% dependable monthly river flow fluctuations at both the Sawangan Station and Kebun Jeruk Station are shown in Figure 2 and Figure 3.
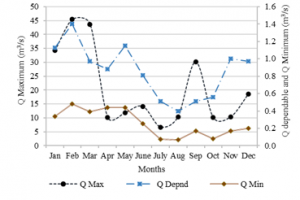
Figure 2: Flow fluctuations of the Pesanggrahan River at the Sawangan measurement stations
At the Sawangan Station, the minimum river flow varied between 0.07 m3/s and 0.44 m3/s, while the maximum river flow varied between 10.1 m3/s and 45.4 m3/s. With this data, a Stream’s Regime Coefficient (KRS) of 103 to 144 was obtained, which indicated medium to poor conditions for water availability [18]. The 90% dependable monthly river flow ranged from 0.4 m3/ sec to 1.4 m3/s (Figure 2).
However, in the course of the river flow to Jakarta, the discharge significantly increased due to the additional flow of the Angsana River and Kali Putih River into the point W2 (6°18′ 43.6″ S 106°46’29.1″ E) from a 5.122 ha sub-watershed and the flow of the Grogol River at point P (6°15’38.0″S 106°46’34.7″ E) from a 360 ha sub-watershed. Therefore, the river flow measurement at the Kebun Jeruk Station in the downstream was significantly higher than the measurement at the Sawangan Station, as the minimum flow was 1.65 m3/s to 5.66 m3/s and the maximum flow was 26.7 m3/sto 69.9 m3/s. The KRS was 12.34 to 16.2, which indicated the right conditions for water availability [18]. Meanwhile, the dependable flow fluctuated from 6.18 m3/s to 9.79 m3/s (Figure 3).
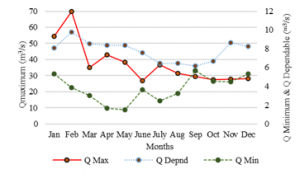
Figure 3: Flow fluctuations of the Pesanggrahan River at the Kebun Jeruk measurement stations
This analysis required precipitation data from the same time, station, and interval as the river flow data series; however, the precipitation data was only available through the measurements taken at the Sawangan Station. Therefore, statistical analysis and visual comparison were required to compare the precipitation data at both monitoring station locations.
Figure 4 shows the measurements for the dependable monthly flow at both the Sawangan and Kebun Jeruk stations. The measurements at the two locations followed similar patterns. In addition, the relationship between the Pesanggrahan River flow patterns at Kebun Jeruk Station and Sawangan Station was R2=90%, forming a linear regression model of Y = 3.42X + 4.85 (Figure 5). Therefore, there was no significant difference in precipitation measurements between the two stations. However, in the development of the model, it was assumed that the precipitation at the two locations had the same value and that the additional discharge of the Pesanggrahan River came from potential runoff on sub-watersheds [19]. Based on this model, there was a relationship between the dependable flow in the Pesanggrahan River and the precipitation data.
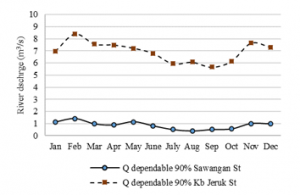
Figure 4: Dependable flow of the Pesanggrahan River at Sawangan Station and Kebun Jeruk Station
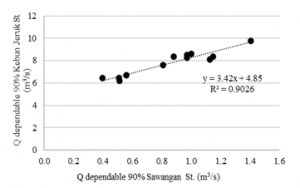
Figure 5: The relationship between the Pesanggrahan River flow patterns at Kebun Jeruk Station and Sawangan Station
Figure 6 shows the monthly precipitation data at the Sawangan Station, with a 90% probability ranging from 5.5 mm/month in September to 125.8 mm/day in May. The discharge measurements ranged from 0.4 m3/s in August to 1.4 m3/s in February.
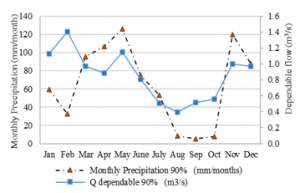
Figure 6: Monthly 90% dependable precipitation and flow fluctuation at the Sawangan Station
When developing the system dynamics model, the monthly precipitation and runoff fluctuation data are shown in Figure 6 was used as an auxiliary function for the available raw water sources that could serve as a self-sufficient water supply in DKI Jakarta.
3.2. Potential Runoff Coefficient Identification
The potential runoff can be understood as the additional amount of water that increases the river water flow. Silty clay dominated the hydrology soil type in the sub-basin of the Pesanggrahan River in the DKI Jakarta subregion. The land cover, sloped surfaces, and hydrological soil groups were all taken into account in the potential runoff coefficients
A land cover map featuring water bodies, built-up land, grass, plants, and impervious land is shown in Figure 7. The DEM map processing generated a slope map with four classifications, as shown in Figure 8. A GIS overlay of the slope map (Figure 5) and land cover map (Figure 6) is also provided. A new field was added to the attribute table of the overlay. The results of Eq. (3) were entered into the new field, and then a potential runoff coefficient map was created, as shown in Figure 9.
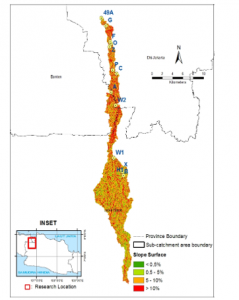
Figure 7: Land Cover of Pesanggrahan watershed
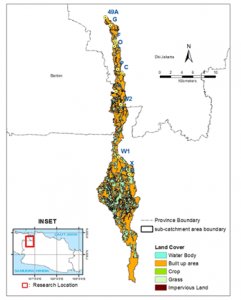
Figure 8: Slope of Pesanggrahan watershed
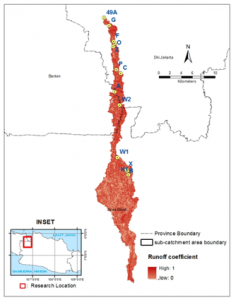
Figure 9: Runoff coefficient of Pesanggrahan Watershed
3.3. Model System Dynamics for the Pesanggrahan River Water Availability
The situation analysis provided by the CLD structure of the system dynamics model described the appropriateness of the Pesanggrahan River as a raw water source (see Figure 10).
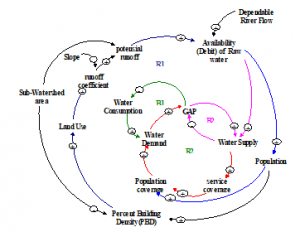
Figure 10: Causal loop diagram (CLD) describing the fluctuations in raw water availability
The model was built by four loops of causal relationships between different components. Two of those loops were positive or reinforced loops (R): R1 and R2. The other two loops were negative loops (B), which modeled the relationships between the factors balancing the water supply (B1 and B2). Furthermore, the model showed various factors that were associated with increasing or decreasing the flow of raw water resources.
Based on the causal loop built above, an SFD was made for the water quantity availability model, as shown in Figure 11. The operational definitions of each component model are presented in Table 1.
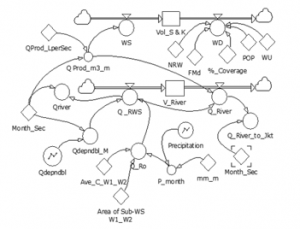
Figure 11: Stock flow diagram (SFD) of the System Dynamics Model for Water Availability
Table 1: Operational Definitions of the Variables / Component Models
| No | Variables | Operational Definition | Measurement unit |
| 1 | V_River | The volume of the river water | m3 |
| 2 | Q_RWS | Pesanggrahan River’s inflow from the upstream (Bogor) to Sawangan Station, Depok | m3/month |
| 3. | Q_River | Inflow of the Pesanggrahan River from the sampling point W2, Cinere Depok | m3/month |
| 4 | Q_Ro | Runoff discharge from the sub-watersheds of the river segment | m3/month |
| 5 | Qdepndbl_M | The fluctuations of the 90% probability river flow per month | m3/month |
| 6 | Precipitation | The fluctuations of the 90% probability precipitation | mm/day |
| 7 | Ave_C_W1_W2 | C value of the average runoff coefficient of the river segment W1–W2 | Ha |
| 8 | Area_of_Sub-WS_W1_W2 | Area of the watershed river segment W1–W2 | Ha |
| 9 | Vol_S&K | A gap of cumulative supply and demand | m3 |
| 10 | WS | The water production capacity plan | m3/month |
| 11 | Q_Prod | Discharge of raw water in the river intake | m3/month |
| 12 | WD | Water demand | m3/month |
| 13 | POP | Quantity of the population served | population |
| 14 | WU | Average water consumption | Liters /capita /day |
| 15 | FMd | The maximum day factor for the water demand | |
| 16 | NRW | Non-revenue water factor | % |
3.4. Simulation Results
Model simulations provided an overview of the Pesanggrahan River’s water availability in a year. The analysis of the 90% dependable monthly discharge showed that there was a fluctuation in water quantity, with minimal availability in August. Initial simulations demonstrated a scenario involving raw water extraction at the upstream location (W2) of the Pesanggrahan sub-district of DKI Jakarta. The inflow of river water was assumed as the 90% dependable monthly discharge (Figure 4) at the Sawangan Station (W1), with an additional flow from the potential runoff of 5.112 Ha W1-W2 sub-watershed area (Figure 9). Furthermore, the simulation results showed that the Pesanggrahan River could supply raw water at a rate of 450 liters/s for the population in the Pesanggrahan River Basin of the DKI Jakarta subregion. Figure 12 shows that a constant supply of 450 liters/s would result in water demand exceeded the supply if the average water consumption was 150 liters/capita/day of 100% service coverage.
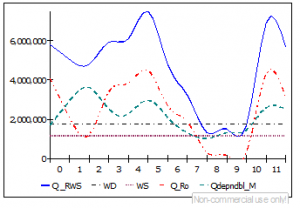
Figure 12: Results assuming 450 liters/s raw water uptake discharge and 150 liters/capita/day average water consumption
The simulation results of various water consumption scenarios produce the total water demand equal to total supply, which refers to the water availability of 450 m3/s (Figure 13).
They showed variations in service coverage, with the average water consumption forming a linear equation relationship Y= 99.202x0.986 with a correlation factor R2 = 0.99 (Figure 14). The simulation model proves that self-sufficient water supply in the region will require increased awareness of the water scarcity crisis and changes to the perception and lifestyle of Jakarta’s inhabitants.
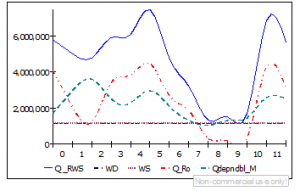
Figure 13: Results assuming 450 liters/s raw water uptake discharge of various water consumption scenarios that produce the total water demand equal to total supply
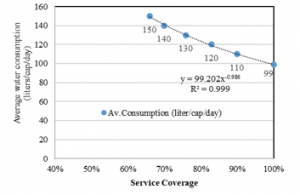
Figure 14: Simulation results of the service coverage policy based on average water consumption
A policy strategy for lowering water consumption is needed. One of the alternatives is to use prices as a policy instrument that can reduce water consumption [20],[21]. Eliminating water subsidies by gradually increasing prices is a more promising strategy than pushing up prices to match inflation [21]. Besides, price scenarios can be combined with technological interventions, such as water-saving taps and “Xeriscaping,” as a strategy to reduce water consumption [22]. An impounding reservoir could be another option for increasing the water supply to overcome the minimum flow in July, August, and September. The results of our reliable discharge analysis showed a significant increase from the upstream of the Sawangan Station to the downstream of the Kebun Jeruk Station. Moreover, the downstream had a KRS indicating good conditions for water availability if selected as a raw water intake location. However, it should be noted that water quality deteriorated in the downstream location of the river. As a limitation of this study, our model did not include water quality as a variable. Hence, detailed computer simulations of the integrated water resource system should be performed to clarify the availability of drinking water in terms of quantity and quality [23].
The verification results of the model structure, the mathematical equations, and the interrelationships between the subsystems accurately reflect the real situation. Together, they represent a simplification of the entire process. However, due to its limitations, there are always differences from the actual reality [24]. Nevertheless, this model is useful as a decision support tool for water supply planning and management, because the availability of raw water is explained based on a minimum river flow with a probability of 90%.
4. Conclusion
The system dynamics model provides insight and an in-depth understanding of the water availability problems involved in creating a self-sufficient water supply in DKI Jakarta, Indonesia. The Pesanggrahan river could supply 450 liters/s where water extraction at the upstream of sub-district of DKI Jakarta. It will balance with the demand if the average water consumption 150 liters/capita/day when service coverage 66% or reducing water consumption to 99 liters/capita/day will increase service coverage to 100%. This study contributes to enhancing the resilience of the water supply system. It recognizes and deals with challenges to local raw water resources limitation that inherent with uncertainties in water resources management.
Though the water quality deteriorated at the downstream, the quantity of water increased. In future research, it needs to develop a model that includes water quality variables and more in-depth simulations to obtain the optimal location for water intake and a storage strategy that can meet the quantity and quality of drinking water needs for the region.
Conflict of Interest
The authors declare no conflict of interest.
Acknowledgment
This research was financially supported by the Research Grant of Doctoral Dissertation (PUTI Doktor), Universitas Indonesia, with Contract No NKB-658/UN2.RST/HKP.05.00/ 2020.
The authors would like to thank and give appreciation to Ardiansyah, ST, for his assistance in guiding and assisting data processing with GIS.
- P. Van Der Zaag, H.H.G. Savenije, Principles of Integrated Water Resources Management, doi:10.1201/b13146-9.
- P. Jaramillo, A. Nazemi, “Assessing urban water security under changing climate: Challenges and ways forward,” Sustainable Cities and Society, 41(November 2016), 907–918, 2018, doi:10.1016/j.scs.2017.04.005.
- M.A. Renouf, S. Serrao-Neumann, S.J. Kenway, E.A. Morgan, D. Low Choy, “Urban water metabolism indicators derived from a water mass balance – Bridging the gap between visions and performance assessment of urban water resource management,” Water Research, 122, 669–677, 2017, doi:10.1016/j.watres.2017.05.060.
- J. Yang, G. Li, L. Wang, J. Zhou, “An Integrated Model for Simulating Water Resources Management at Regional Scale,” Water Resources Management, 29(5), 1607–1622, 2015, doi:10.1007/s11269-014-0897-3.
- L. Garrote, A. Granados, A. Iglesias, “Strategies to reduce water stress in Euro-Mediterranean river basins,” Science of the Total Environment, 543, 997–1009, 2016, doi:10.1016/j.scitotenv.2015.04.106.
- T. Li, S. Yang, M. Tan, “Simulation and optimization of water supply and demand balance in Shenzhen: A system dynamics approach,” Journal of Cleaner Production, 207, 882–893, 2019, doi:10.1016/j.jclepro.2018.10.052.
- L. Yuan, W. He, D.M. Degefu, Z. Liao, X. Wu, M. An, Z. Zhang, T.S. Ramsey, “Transboundary water sharing problem; a theoretical analysis using evolutionary game and system dynamics,” Journal of Hydrology, 582(December 2019), 124521, 2020, doi:10.1016/j.jhydrol.2019.124521.
- M.H. Ahmadi, M. Zarghami, “Should water supply for megacities depend on outside resources? A Monte-Carlo system dynamics simulation for Shiraz, Iran,” Sustainable Cities and Society, 44(October 2018), 163–170, 2019, doi:10.1016/j.scs.2018.10.007.
- M. Kooy, C.T. Walter, I. Prabaharyaka, “Inclusive development of urban water services in Jakarta: The role of groundwater,” Habitat International, 73, 109–118, 2018, doi:10.1016/j.habitatint.2016.10.006.
- I. Abidin, H.Z., Andreas, H., Gumilar, “Land subsidence of Jakarta (Indonesia) and its relation with urban development.,” Nat Hazards, 59, 1753, 2011.
- R. Yanidar, D.M. Hartono, S.S. Moersidik, “Water quality assessment for self-sufficient water resources for DKI Jakarta,” in IOP Conference Series: Earth and Environmental Science, 2018, doi:10.1088/1755-1315/106/1/012056.
- C.C. Yang, L.C. Chang, C.C. Ho, “Application of system dynamics with impact analysis to solve the problem of water shortages in Taiwan,” Water Resources Management, 22(11), 1561–1577, 2008, doi:10.1007/s11269-008-9243-y.
- G. Wu, L. Li, S. Ahmad, X. Chen, X. Pan, “A Dynamic Model for Vulnerability Assessment of Regional Water Resources in Arid Areas: A Case Study of Bayingolin, China,” Water Resources Management, 27(8), 3085–3101, 2013, doi:10.1007/s11269-013-0334-z.
- Y. Sun, N. Liu, J. Shang, J. Zhang, “Sustainable utilization of water resources in China: A system dynamics model,” Journal of Cleaner Production, 142, 613–625, 2017, doi:10.1016/j.jclepro.2016.07.110.
- F. Dixey, “Engineering hydrology,” Journal of Hydrology, 27(1–2), 169, 2003, doi:10.1016/0022-1694(75)90105-5.
- S.H. Mahmoud, “Investigation of rainfall-runoff modeling for Egypt by using remote sensing and GIS integration,” Catena, 120, 111–121, 2014, doi:10.1016/j.catena.2014.04.011.
- Y.B. Liu, F. De Smedt, “WetSpa Extension , A GIS-based Hydrologic Model for Flood Prediction and Watershed Management Documentation and User Manual,” Documentation and User Manual, (March), 1–126, 2004.
- Y. Lilis Handayani, Siswanto, B. Sujatmoko, G. Oktavia, “Stream’s regime coefficient in upstream Rokan watershed of Riau Province,” MATEC Web of Conferences, 276, 04013, 2019, doi:10.1051/matecconf/201927604013.
- D.P. Loucks, E. van Beek, Water resource systems planning and management: An introduction to methods, models, and applications, Springer, 2017, doi:10.1007/978-3-319-44234-1.
- K. Qaiser, S. Ahmad, W. Johnson, J. Batista, “Evaluating the impact of water conservation on fate of outdoor water use: A study in an arid region,” Journal of Environmental Management, 92(8), 2061–2068, 2011, doi:10.1016/j.jenvman.2011.03.031.
- M. Goldani, H. Amadeh, “A System Dynamics Approach in Water Resource Management and Government Subsidy Policy: A Case Study of Tajan Basin in Iran ,” Proceedings of the 29th International Conference of the System Dynamics Society, 1–18, 2011.
- S. Ahmad, D. Prashar, “Evaluating Municipal Water Conservation Policies Using a Dynamic Simulation Model,” Water Resources Management, 24(13), 3371-3395., 2010, doi:10.1007/s11269-010-9611-2.
- A. Mirchi, K. Madani, D. Watkins, S. Ahmad, “Synthesis of System Dynamics Tools for Holistic Conceptualization of Water Resources Problems,” Water Resources Management, 26, 2421–2442, 2012, doi:10.1007/s11269-012-0024-2.
- J. Sterman, “System Dynamics; System Thinking and Modeling for a Complex World,” 2002.
Citations by Dimensions
Citations by PlumX
Google Scholar
Scopus
Crossref Citations
No. of Downloads Per Month
No. of Downloads Per Country