
Economic and Environmental Analysis of Life Expectancy in China and India: A Data Driven Approach
Volume 5, Issue 5, Page No 308-313, 2020
Author’s Name: Nittaya Kerdprasop1,a), Kittisak Kerdprasop1, Paradee Chuaybamroong2
View Affiliations
1School of Computer Engineering, Suranaree University of Technology, Nakhon Ratchasima 30000, Thailand
2Department of Environmental Science, Thammasat University, Rangsit Campus 12120, Thailand
a)Author to whom correspondence should be addressed. E-mail: nittaya@sut.ac.th
Adv. Sci. Technol. Eng. Syst. J. 5(5), 308-313 (2020); ![]() DOI: 10.25046/aj050539
DOI: 10.25046/aj050539
Keywords: Data analysis, Life expectancy, Environment and economic, Web graph, Classification and regression tree

Export Citations
A data analytic approach presented in this work covers both data descriptive and predictive modeling with two main objectives: (1) discovering factors related to longevity of populations in the two most populated nations, China and India, and (2) generating life expectancy predictive models for both countries. Descriptive modeling methods to explore major environmental and economic factors anticipating to affect longevity patterns of people are web graph analysis and chi-squared automatic interaction detection (CHAID) techniques. Web graph analysis has been applied for the ease of visualization and CHAID is for discovering factors leading to longevity. From the analysis results, particulate emission including ozone pollution and PM2.5 concentrations is the most important factor threatening life of populations in both China and India. To predict number of years an individual is expected to live based on the available environmental and economic factors, several statistical and machine learning techniques are applied and it turns out that a linear regression model yields the most accurate prediction result.
Received: 08 June 2020, Accepted: 13 September 2020, Published Online: 17 September 2020
1. Introduction
Longevity, education and income are the three main indicators that the United Nations Development Program (UNDP) has adopted for computing the human development index (HDI) to assess development level of each country [1]. The HDI captures three main essential aspects: a long and healthy life, an ability to have sufficient knowledge, and a decent standard of living. The health aspect is measured from life expectancy at birth, which is number of years a new-born baby is expected to live, averaging from the cohort. The knowledge aspect is measured from years of schooling. The standard of living aspect is measured from the gross national income per capita. The HDI is the geometric mean of all three aspects that have gone through the normalized process. This paper focuses on the longevity indicator through the life expectancy at birth measure, as it is considered [2], [3] a reflect for the good health of population.
The analysis of longevity trends within and across nations is of interest among many groups of researchers [4]-[7]. The number of years an individual is expected to live is also important to actuaries for making an optimal and economical insurance and pension plans [8]-[10]. Both positive and negative factors affecting longevity have been investigated by several researchers. For instance, Chinese researchers had explored the factors relating to energy consumption in daily life of Chinese people through the use of coal and electricity [11], [12]. The results are that coal usage relates to shorten life, whereas domestic electricity usage shows positive correlation to longevity. However, the choice of energy sources depends on the household income. Such economic and socio-economic factors had been proven by many researchers [13], [14], [15] that they can affect the long-life of population.
Exposure to polluted environment is also another important factor studied by various researchers [16], [17] to assess its impact against longevity. Environment factors reported to have negative impact toward shorten longevity includes carbon dioxide (CO2) emission [18], [19], particulate matter (PM10) and sulfur dioxide (SO2) concentrations [20], [21]. A poor climate condition also shows negative impact toward longevity of population [22], [23].
From the literature review, it can be noticed that most researchers study longevity by building a predictive model to forecast number of years the populations are expected to live using various methods including regression [24], autoregressive integrated moving average [25]-[27], and neural network algorithms [28], [29]. Some researchers [30] apply an ensemble method to make forecasting through a number of models and use the averaging scheme to predict the years of living.
In this work, we make our contribution to the demography as well as the environmental fields of research by proposing a different longevity analysis approach in which both numeric and categorical modeling are applied, instead of the sole numeric computation. Our data analytic method generates descriptive model through categorical computation to reveal life-threatening factors and also produces predictive model to make a numeric prediction toward number of years an individual is expected to live based on the available economic and environmental factors. The data source and our analysis methodology are explained in Section 2. Results from the data analytic approach are presented in Section 3. Performance evaluation of the predictive models is shown in Section 4. The conclusion is in Section 5.
2. Materials and Methods
The main purpose of our research is to present descriptive and predictive modeling methods to automatically discover major factors influencing good health of people living in the highly populated countries. We choose China and India to be our case study because the two countries are the most populated ones in the world (China = 1.43 billion, India = 1.36 billion [31]) and the trends of human development index (HDI) of the two countries are almost similar. The geographic location of China and India and the trend in HDI improvement from the years 1990 to 2018 are shown in Figures 1 and 2, respectively.
We focus the HDI analysis along the dimension of long and healthy life through the discovery of major factors affecting life expectancy at birth among populations in China and India. The life expectancy at birth together with other 16 economic and environmental indicators expecting to play some role on lifespan during 1960-2017 have been accessed from the World Bank database [32]. The summary of all attributes is listed in Table 1.
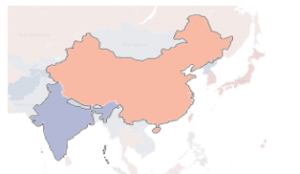
Figure 1: Location of China (above — in orange) and India (below — in grey)
(image source: https://data.worldbank.org/country/)
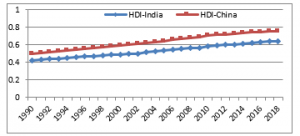
Figure 2: HDI improvement of China and India from the years 1990 to 2018
(data source: http://hdr.undp.org/en/data)
Table 1: Selected attributes for life threatening analysis
| Attribute | Description | Unit |
|
National_ income |
Net national income per capita | annual % growth |
|
Education_ expense |
Education expenditure — excluding investments in buildings and equipment | % of GNI |
|
Forest_ depletion |
Net forest depletion — if growth exceeds harvest, this figure is zero | % of GNI |
| Particulate_emis | Particulate emission damage — calculated as foregone labor income due to premature death due to exposure to ozone pollution and indoor concentrations of PM2.5 in households cooking with solid fuels | % of GNI |
|
Agri_met_ emis |
Agricultural methane emissions — from animals, animal waste, rice production, agricultural waste burning | % of total |
|
CO2_ emission |
CO2 emissions — carbon dioxide produced during consumption of solid, liquid, and gas fuels and gas flaring | metric tons per capita |
|
Electric_ power |
Electric power consumption | kWh per capita |
| Energy_use | Energy use | kg of oil equivalent per capita |
| Exports | Exports of goods and services | % of GDP |
| Forest_area | Forest area — excluding tree stands in agricultural production systems and trees in parks and gardens | % of land area |
| GDP_growth | GDP growth | annual % |
| GNI | GNI per capita growth | annual % |
| High-tech_exports | High-technology exports — products with high R&D intensity, such as in aerospace, computers, pharmaceuticals, scientific instruments, and electrical machinery | % of manufactured exports |
| Imports | Imports of goods and services | % of GDP |
| Industry | Industry, value added — industries correspond to ISIC divisions 10-45 and 15-37 | % of GDP |
| Manufacturing | Manufacturing, value added — industries belonging to ISIC divisions 15-37 | % of GDP |
| Life | Life expectancy at birth — the number of years a newborn infant would live if patterns of mortality at the time of its birth were the same throughout its life | years |
Among all 17 numeric data attributes, life expectancy at birth is the target of our analysis. The main steps in the data-driven analytical approach are illustrated in Figure 3.
The first step is data extraction including the selection of data attributes from the World Bank database and the data preparation to be in a suitable format for further analysis steps. The next step is data exploration, which is the analysis of correlation among data attributes. The third step is the discovery of factors threatening life of population in China and India. This step needs the transformation from numeric to be categorical through the binning approach. The descriptive model to reveal important factors affecting lifespan is derived by the algorithm chi-squared automatic interaction detection, or CHAID [33]. This algorithm has been adopted because its model represented as a tree structure has many advantages such as efficiency, interpretability and successful adoption to solve a wide range of problems [34],[35]. To visualize factor association, we adopt the web graph method.
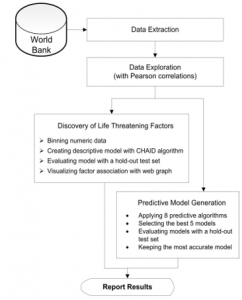
Figure 3: The main steps for data-driven analytical approach
The fourth and also the last step of our analytical method is the predictive model generation. We adopt 8 algorithms in this modeling step including regression, generalized linear model (GLM), k-nearest neighbors (kNN), support vector machine (SVM), classification and regression tree (CART), chi-squared automatic interaction detection (CHAID), artificial neural network (ANN), and linear.
The obtained models are evaluated for their performances observed during the training process. The best 5 models are then selected for further testing with the hold-out method in which the separated test dataset has been applied. In the training and testing steps, the total 48 records of data during the years 1960-2017 had been split as two separate subsets: training and testing. The training dataset comprises of 45 records, whereas the testing dataset contains 13 records.
After evaluating prediction performance of the best 5 models using the same set of test data, the most accurate model is kept as the final model. This model is to be used for forecasting the number of years an individual is expected to live. It is worth noting that forecasting model for one country may be different from another because the modeling is a data driven approach such that different set of training data may yield different modeling result, even though set of data attributes is the same.
3. Analytical Results
According to the design of our data analytical approach, there are three main steps of data analysis: data exploration, descriptive model creation, and predictive model generation. We thus present the results from these three main steps sequentially in the following three subsections.
3.1. Data Exploration Results
The results of Pearson correlation analysis is shown in Table 2. It can be noticed similarity between the two countries that source of energy and amount of energy usage have strong positive influence toward longevity. The values in terms of import, export and industry are also among the top-5 positive factors associating with longevity.
In case of correlation analysis to reveal negative factors to lifespan of population, we can notice that particulate emission is among the top-five factors associating to life shortening in both China and India. However, other factors such as forest depletion, forest area, the export of high-technology product, the expense in education and the national income per capita are also appeared as having negative influence toward longer life of population in the two countries. These results are preliminary data exploration. The next step is the in-depth analysis discovering only prominent factors relating to longevity of population.
Table 2: Pearson correlation between life expectancy at birth and economic and environmental factors
|
Top-5 Positive Factors (correlation) |
Top-5 Negative Factors (correlation) |
|
| China | Energy_use (0.856) | Forest_depletion (-0.862) |
| Electric_power (0.837) | Education_expense (-0.862) | |
| Imports (0.800) | Particulate_emis (-0.709) | |
| Exports (0.767) | High-tech_exports (-0.689) | |
| Industry (0.734) | Forest_area (-0.672) | |
| India | Electric_power (0.954) | High-tech_exports (-0.853) |
| Energy_use (0.940) | Particulate_emis (-0.848) | |
| Industry (0.902) | Forest_area (-0.798) | |
| Exports (0.875) | National_income (-0.739) | |
| Imports (0.838) | Forest_depletion (-0.717) |
3.2. Descriptive Modeling Results
Descriptive analytics refer to the process of applying statistical and other intelligent techniques to provide insight into the historical data to gain some understanding about the important factors, hidden patterns or concealed behavior. To understand characteristics of longevity pattern, we apply CHAID algorithm to reveal prominent factors affecting lifespan and display it as a tree structure as shown in Figure 4 (root of a tree is on the left hand side). It can be seen from the patterns that particulate emission damage is the most important environmental factor shortening lifespan of populations in both China and India.
A web graph to display association between economic and environmental factors and life expectancy at birth for each population group is also shown in Figure 5. The thickness of line linking each node in a graph represents strength of association. The thicker is the stronger. The web graph also shows the strong association between a short lifespan and a high level of particulate emission damage for both Chinese and Indian populations.
| China |
|
Particulate_emis in [0.27-0.34] => Lifespan in [74.29-76.41] Particulate_emis in [0.35-0.75] => Lifespan in [69.93-74.28] Particulate_emis > 0.75 => Lifespan in [67.61-69.92] Particulate_emis is unknown Exports in [2.49-8.32] => Lifespan in [59.08-67.60] Exports in [8.33-17.91] => Lifespan in [67.61-69.92] Exports in [17.92-36.03] => Lifespan in [59.08-67.60] (Accuracy on test data = 100%) |
| India |
|
Particulate_emis in [0.78-1.02] => Lifespan in [64.96-68.80] Particulate_emis in [1.03-2.21] => Lifespan in [59.92-64.95] Particulate_emis in > 2.22 => Lifespan in [54.71-59.91] Particulate_emis is unknown Industry in [21.41-26.16] => Lifespan in [47.72-54.70] Industry in [26.17-27.84] => Lifespan in [54.71-59.91] Industry in [27.85-31.13] => Lifespan in [47.72-54.70] (Accuracy on test data = 84.62%) |
Figure 4: Factors affecting lifespan of populations in China and India discovered by the CHAID algorithm
|
China
LE: 1=[59.08-67.60], 2=[67.61-69.92], 3=[69.93-74.28], 4=[74.29-76.41] PE: 1=[0.27-0.34], 2=[0.35-0.75], 3 = >0.75, 4 = unknown EX: 1=[2.49-8.32], 2=[8.33-17.91], 3=[17.92-23.58], 4=[23.59-36.03]
|
||||||
|
India
LE: 1=[47.72-54.70], 2=[54.71-59.91], 3=[59.92-64.95], 4=[64.96-68.80] PE: 1=[0.78-1.02], 2=[1.03-2.21], 3 = >2.22, 4 = unknown IN: 1=[21.41-26.16], 2=[26.17-26.72], 3=[26.73-27.84], 4=[27.85-31.13]
|
Figure 5: Factors contributing to longevity of populations displayed as a web graph
3.3. Predictive Modeling Results
Predictive modeling is the data analytical approach to generate a model with the main aim of using that model to forecast future event. We apply both statistical and machine learning methods to build a predictive model from the training dataset. From the model performance comparison, linear regression is a method yielding the most accurate result for both China and India cases. The linear regression models to predict lifespan of population in each country are presented in Figure 6. It can be noticed that education expense is among the first two factors appeared in the models and it shows positive influence toward long life of population in both countries.
| China: Life expectancy at birth |
|
= Education_expense * 6.195 + Agri_methane_emission * 0.00005864 + CO2_emission * -4.16 + Electric_power_consumption * -0.008426 + Energy_use * 0.03816 + Exports * -0.07075 + Forest_area * 0.0001171 + GDP_growth * 0.01842 + GNI * -0.00001071 + Hi-tech-exports * -0.0002215 + Imports * 0.3694 + Industry * -0.2848 + Manufacturing * 0.000447 + 48.7
|
| India: Life expectancy at birth |
|
= National_income * -0.02832 + Education_expense * 2.28 + Forest_depletion * -0.02815 + Agri_methane_emission * -0.000006419 + CO2_emission * 8.185 + Electric_power_consumption * 0.02312 + Energy_use * -0.04361 + Exports * 0.2372 + Forest_area * 0.00003288 + GDP_growth * -0.2307 + GNI * 0.3371 + Hi-tech-exports * 0.00004354 + Imports * -0.1426 + Industry * 0.7558 + Manufacturing * -0.173 + 35.8
|
Figure 6: Factors contributing to longevity of populations in China and India
4. Model Evaluation
We test performance of descriptive and predictive models with a separate set of test data. The descriptive model derived by CHAID algorithm to reveal longevity pattern of population in China with 100% of accuracy, whilst the accuracy of CHAID model drops to 84.62% when the algorithm tries to fit model with data from Indian training cases. The decrease in accuracy may occur from the low level of homogeneity in the training data.
To build a predictive model, we apply eight algorithms and then select the best five models to test performance on a hold-out dataset. The evaluation results for the case of China population are illustrated in Table 3, whereas the results of India population modeling assessment are shown in Table 4. The best predictive model from both population groups with the least mean absolute error is the one derived from the linear regression algorithm.
Table 3: Predictive model evaluation results for China
| Algorithm | Correlation | Number of Factors | Mean Absolute Error |
| Regression | 0.977 | 13 | 0.602 |
| CHAID | 0.972 | 7 | 0.769 |
| CART | 0.971 | 12 | 0.916 |
| GLM | 0.874 | 16 | 1.597 |
| SVM | 1.0 | 16 | 3.212 |
Table 4: Predictive model evaluation results for India
| Algorithm | Correlation | Number of Factors | Mean Absolute Error |
| Regression | 0.996 | 15 | 0.544 |
| CHAID | 0.996 | 16 | 0.562 |
| CART | 0.988 | 7 | 1.071 |
| GLM | 0.926 | 16 | 1.507 |
| SVM | 0.895 | 15 | 1.888 |
5. Conclusion
We present data analytical approach to create descriptive and predictive model with the two main aims: to discover threatening factors that may shorten lifespan and to predict the number of years on average an individual is expected to live based on the economic and environmental variables. The analytical approach is data driven in the sense that model is to be generated from the training data. Therefore, using different datasets can result in obtaining different models, even though the same data variables and the same learning algorithm have been applied.
To derive a descriptive model, we adopt the CHAID algorithm. The training data are World development indicators accessed from the World Bank database with two specific countries, China and India, and the target of analysis is life expectancy at birth which is one aspect that the UNDP applied for computing the human development index of a country. The models of China and India show one common finding that particulate emission damage due to the exposure to ambient ozone pollution and PM2.5 is the most important factor affecting shorter longevity. We also apply several learning algorithms to derive predictive models to forecast number of years an individual is expected to live based on the available economic and environment factors. The most accurate predictive model is the one built from the linear regression method.
Conflict of Interest
The authors declare no conflict of interest.
Acknowledgment
This work has been supported by grant from Suranaree University of Technology through the funding of Data and Knowledge Engineering Research Unit in which the first and second authors are principal researchers.
- UNDP, “Human Development Indices and Indicators: 2018 Statistical Update,” http://hdr.undp.org/sites/default/files/hdr2018_technical_ notes.
- D. Dicker et al., “Global, regional, and national age-sex-specific mortality and life expectancy, 1950–2017: A systematic analysis for the Global Burden of Disease Study 2017,” The Lancet, 392(10159), 1684–1735, 2018.
- M. Kim, Y.H. Khang, “Why do Japan and South Korea record very low levels of perceived health despite having very high life expectancies?,” SSRN Electronic Journal, article 3276420, 2018.
- L. Wang, Y. Li, H. Li, J. Holdaway, Z. Hao, W. Wang, T. Kraft, “Regional aging and longevity characteristics in China,” Archives of Gerontology and Geriatrics, 67, 153-159, 2016.
- S. Wang, K. Luo, R. Ni, Y. Tian, X. Gao, “Assessment of elemental background values and their relation with lifespan indicators: A comparative study of Jining in Shandong Province and Guanzhong area in Shaanxi Province, northern China,” Science of The Total Environment, 595, 315–324, 2017.
- L.A. Johnston, “The economic demography transition: is china’s ‘not rich, first old’ circumstance a barrier to growth?,” Australian Economic Review, Jul., 1–21, 2019.
- R. Bai, J. Wei, R. An, Y. Li, L. Collett, S. Dang, W. Dong, D. Wang, Z. Fang, Y. Zhao, Y. Wang, “Trends in life expectancy and its association with economic factors in the belt and road countries—evidence from 2000–2014,” International Journal of Environmental Research and Public Health, 15(12), article 2890, 2018.
- E. Kurtbegu, “Replicating intergenerational longevity risk sharing in collective defined contribution pension plans using financial markets,” Insurance: Mathematics and Economics, 78, 286–300, 2018.
- E. Debonneuil, S. Loisel, F. Planchet, “Do actuaries believe in longevity deceleration?,” Insurance: Mathematics and Economics, 78, 325–338, 2018.
- L. Mayhew, D. Smith, D. Wright, “The effect of longevity drift and investment volatility on income sufficiency in retirement,” Insurance: Mathematics and Economics, 78, 201–211, 2018.
- S. Wang, K. Luo, “Life expectancy impacts due to heating energy utilization in China: Distribution, relations, and policy implications,” Science of The Total Environment, 610–611, 1047–1056, 2018.
- S. Wang, Y. Liu, C. Zhao, H. Pu, “Residential energy consumption and its linkages with life expectancy in mainland China: A geographically weighted regression approach and energy-ladder-based perspective,” Energy, 177, 347–357, 2019.
- W.C. Cockerham, Y. Yamori, “Okinawa: an exception to the social gradient of life expectancy in Japan,” Asia Pacific Journal of Clinical Nutrition, 10(2), 154–158, 2001.
- J. Jiang, L. Luo, P. Xu, P. Wang, “How does social development influence life expectancy? A geographically weighted regression analysis in China,” Public Health, 163, 95–104, 2018.
- C. Lee, M. Kim, “The relationship between internet environment and life expectancy in Asia,” Review of Integrative Business & Economics, 8(2), 70–80, 2019.
- K. Hassan, R. Salim, “Population ageing, income growth and CO2 emission: empirical evidence from high income OECD countries,” Journal of Economic Studies, 42(1), 54–67, 2015.
- J.C. Yeh, C.H. Liao, “Impact of population and economic growth on carbon emissions in Taiwan using an analytic tool STIRPAT,” Sustainable Environment Research, 27(1), 41–48, 2017.
- N. Kerdprasop, K. Kerdprasop, “Regression tree analysis of CO2 emissions and environmental factors to the survival rate of population in Thailand and China,” in the International MultiConference of Engineers and Computer Scientists (IMECS), 286–290, 2016.
- N. Kerdprasop, K. Kerdprasop, “Association of economic and environmental factors to life expectancy of people in the Mekong basin,” in the 12th IEEE Conference on Industrial Electronics and Applications (ICIEA), 1984–1989, 2017.
- L. Wang, B. Wei, Y. Li, H. Li, F. Zhang, M. Rosengerg, L. Yang, J. Huang, T. Kraft, W. Wang, “A study of air pollutants influencing life expectancy and longevity from spatial perspective in China,” Science of The Total Environment, 487, 57–64, 2014.
- W. Song, Y. Li, Z. Hao, H. Li, W. Wang, “Public health in China: An environmental and socio-economic perspective,” Atmospheric Environment, 129, 9–17, 2016.
- J. Lv, W. Wang, Y. Li, “Effects of environmental factors on the longevous people in China,” Archives of Gerontology and Geriatrics, 53(2), 200–205, 2011.
- J. Robine, F.R. Herrmann, Y. Arai, D.C. Willcox, Y. Gondo, N. Hirose, M. Suzuki, Y. Saito, “Exploring the impact of climate on human longevity,” Experimental Gerontology, 47(9), 660–671, 2012.
- G. Gulis, “Life expectancy as an indicator of environmental health,” European Journal of Epidemiology, 16, 161–165, 2000.
- T. Torri, J.W. Vaupel, “Forecasting life expectancy in an international context,” International Journal of Forecasting, 28(2), 519–531, 2012.
- K.J. Foreman et al., “Forecasting life expectancy, years of life lost, and all-cause and cause-specific mortality for 250 causes of death: Reference and alternative scenarios for 2016–40 for 195 countries and territories,” The Lancet, 392(10159), 2052–2090, 2018.
- M.D. Pascariu, V. Canudas-Romo, J.W. Vaupel, “The double-gap life expectancy forecasting model,” Insurance: Mathematics and Economics, 78, 339–350, 2018.
- M. Kanevski, R. Parkin, A. Pozdnukhov, V. Timonin, M. Maignan, V. Demyanov, S. Canu, “Environmental data mining and modelling based on machine learning algorithms and geostatistics,” Environment Modelling & Software, 19(9), 845–855, 2004.
- M. Leuenberger, M. Kanevski, “Extreme Learning Machines for spatial environmental data,” Computers & Geosciences, 85, 64–73, 2015.
- V. Kontis, J.E. Bennett, C.D. Mathers, G. Li, K. Foreman, M. Ezzati, “Future life expectancy in 35 industrialised countries: Projections with a Bayesian model ensemble,” The Lancet, 389(10076), 1323–1335, 2017.
- United Nations, Department of Economic and Social Affairs, Population Division, “World Population Prospects 2019: Data Booklet,” https://population.un.org/wpp/Publications/
- The World Bank, “World Development Indicator,” https://databank.worldbank.org/source/world-development-indicators
- G. Kass, “An exploratory technique for investigating large quantities of categorical data,” Applied Statistics, 29(2), 119–127, 1980.
- S. Jang, H. Choi, Y. Jung, E. Moon, T. Yoon, “A comparison of H1N1 and H3N2 viruses using decision tree and Apriori algorithm,” International Journal of Machine Learning and Computing, 6(1), 76–79, 2016.
- S. Boonamnuay, N. Kerdprasop, K. Kerdprasop, “Classification and regression tree with resampling for classifying imbalanced data,” International Journal of Machine Learning and Computing, 8(4), 336–340, 2018.