C-Band FMCW Radar Design and Implementation for Breathing Rate Estimation

Adv. Sci. Technol. Eng. Syst. J. 5(5), 1299–1307 (2020);
 DOI: 10.25046/aj0505156
In this paper, a portable Frequency Modulated Continuous Wave (FMCW) radar system was designed and implemented for human movements and breathing detection. The radar operates with a frequency band ranges from 4.7 to 4.9GHz. The radar sub-systems were designed and simulated using up to date computer-aided-design tools before implementation. The Voltage Controlled Oscillators (VCO), high gain antenna, low loss power divider/combiner, and a high selectivity bandpass filter were implemented, and their parameters were measured using a microwave analyzer. The simulated results and the measured results show a significant correlation. The new RF front end module components enhanced the radar signal-noise-ratio (SNR), and the breathing rate detection. The Digital Signal Processing (DSP) is implemented on the Field Programmable Gate Array (FPGA) board for movement and breathing signals detection processing in real-time. Highly sensitive detection, configurability, low cost, low power consumption, and portability were considered in the designed system. We believe that the enhanced reconfigurable radar system will be helpful in several biomedical monitoring applications.
1. Introduction
Human breathing estimation is very important in security, medical, and homecare applications [1]. In security applications, special military troops use the human breathing detection devices to detect human behind walls in case of building enforcement operations. In medical applications, vital signs monitoring was proposed in US patent in 1990 [2]. After that, human breathing and heartbeat estimation instruments for medical application were introduced since 1993 [3]. Hospitals use human breathing radars to estimate the breathing especially for burned skin or COVID-19 patients where it is preferred not to contact the medical crew. In homecare applications, the population of Americans edged more than 65 years will grow to 90 million people in 2050 [4]. These old peoples who lives alone need to be monitored using breathing and heartbeat detection radars to detect sudden medical problems and report them to an emergency medical center.
Radar systems may be designed to be pulsed or continuous wave transmitters depending on the required application. Frequency modulated continuous wave (FMCW) radars outperforms the pulsed radars in transmitting higher average power with its capability of measuring the target range, especially for small cross section area targets. Because of that, FMCW radars were used in human breathing and heartbeat estimation and human movements detection applications [5]. In [6], a 24.15 GHz FMCW radar with a scanning bandwidth of 72 MHz was used to extract the human heartbeat rate signal. In [7], a 24 GHz FMCW radar was used for heartbeat rate estimation. The clutter noise was canceled but the effect of human limbs motion decreased the human breathing estimation rate accuracy. According to the selection of the operating frequency band, the human chest cross section area has its highest value in the frequency band 3-4 GHz and the received signal-to-noise ratio is high in the frequency band 4-6 GHz [8], [9] .However, many FMCW radars for human breathing rate estimation were designed and implemented in other frequency bands such as 2.4 GHz, 9.6GHz, 24GHz, and 77GHz [7], [10]-[13]. The harmonics of the human breathing frequency may interfere with the heartbeat rate that result in heartrate estimation failure [10]. One of the most effective methods is to use comb filters to remove these harmonics [14]. For C-band biomedical radars, the state-of-the-art presented the radar systems without considering configurability, cost, and design reliability which is covered in this paper.
Most uses of radar can be classified as detection, tracking, or imaging. In this research, the scope is on radar detection. The most fundamental problem in radar is detection of an object or physical phenomenon. This requires determining whether the receiver frontend output at a given time represents the echo from a reflecting object or only noise. Detection process starts with using the techniques of signal acquisition and interference reduction necessary to perform these tasks. These techniques were discussed briefly in [15] and the signal is then processed for a decision. Detection decisions are usually made by comparing the amplitude of the signal to a threshold which may be set a priori in the radar design, which is not preferred because noise changes over time, or may be computed adaptively from the radar data.
Digital signal processing on the radar returns can be implemented using main task functions such as: Moving Target Indicators (MTI), Constant False Alarm Rate (CFAR), digital integrators, and target information packet extractors [16]. These main functions can be set to be configurable. For example, CFAR techniques have been developed in the last few decades such as order statistics CFAR (OS-CFAR) [17], cell average CFAR (CA-CFAR) [18], greatest of CFAR (GO-CFAR) [19], and smallest of CFAR (SO-CFAR) [20]. Each one of these techniques is suitable for specific environmental conditions. The DSP can be design to select the desirable technique by the user.
In this paper, a configurable C-band FMCW radar is designed and implement for human breathing detection. Section 2 presents the principal of operation. Section 3 present the Radio Frequency (RF) components design and implementation. Section 4 is the measurements results, section 5 presents the conclusion, and section 6 discusses the future work .
2. Principles of Operation
The FMCW radar range resolution depends on the transmitted signal bandwidth while the maximum range can be calculated from the chirp time interval. (Figure 1.a) shows the linear variation of the transmitted frequency from f_start to f_stop where the bandwidth is equal to . The chirp time is T_chirp, that the maximum range is equal to , where C is the light propagation velocity. The transmitted signal can be presented by:
![]()
where, is the amplitude of the transmitted signal, BW is the bandwidth, and ) is the transmitter phase noise. When a transmitted signal hit a target, it reflects with attenuated amplitude and time shift related to the target range. The received signal can be presented by:
![]()
where, is the attenuated received signal amplitude, and is the round-trip delay from the radar antenna to the target and back again to the radar, and is given by:
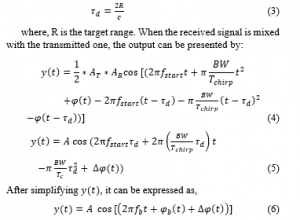
where, it the amplitude of the received signal , is the beat frequency and it is equal to , is the received signal phase and it equals to , is the phase noise and it equals to . When the target is moving with a specific speed, Doppler frequency adds to the beat frequency and becomes , where is the Doppler frequency. (Figure 1.b), shows the phase difference between the two mixed signals ( ).
The phase noise is not considered in this research. The term is very small compared to and can be neglected. Then, the beat signal which is equal to , is processed to extract the target parameters.

Figure 1: Sawtooth based FMCW radar basic concept: (a) Transmitted and received signal in the frequency-time domain, and (b) single target beat signal
3. System Design
In this section, the design of a C-band FMCW radar for human breathing rate estimation is presented. The system is implemented using RF components and configurable digital signal processing subsystem.
3.1. General Overview of the Proposed Radar
(Figure 2) shows the block diagram of the proposed radar. A single channel architecture is utilized in this design, in order to reduce hardware and memory resources, computation complexity, hence; a cost effective design can be achieved
A function generator board is used to control the Voltage Controlled Oscillator (VCO) to generate a chirp signal with a frequency ranged from 4.7-4.9 GHz. The VCO output is divided into two different ports using 3dB equally power divider. The output of the first port of the divider is connected to a bandpass filter (BPF) from 4 GHz to 5 GHz. The filter output then is sent to the power amplifier with a 20dB gain, and transmitted through a horn antenna with 16.5dB gain. The receive antenna which has the same gain of the transmitter antenna, receives the signal, then a 24dB Low Noise Amplifier (LNA) is used to amplify this signal, then the signal is sent to a BPF operates from 4 GHz to 5 GHz, then this signal is mixed with a replica of the transmitted signal coming from the second port of the power divider, to perform the frequency down conversion. A Low Pass Filter (LPF) then is used to filter the mixer output signal from the unwanted signals. An 8-bit Analog-to-Digital Converter (ADC) is used to digitize the analog signal, then the digital data is passed to the FPGA for signal processing. A PC is connected to the FPGA output for further processing, and a screen is connected directly to the FPGA to show the targets and the target history.

Figure 2: Proposed Radar general block diagram.

Figure 3: Fabricated radar system.
3.2. Radar System Parameters
A 75 cm range resolution is achieved by using 200 MHz sweep bandwidth from the VCO.
The following equation is used to determine the range resolution.
![]()
where C is the light speed, and BW is the proposed bandwidth. (Figure 3) shows the fabricated radar system, which considers the radar components fixation.
In this design, a chirp duration of 1 ms is chosen. Table 1 shows a listed ssystem parameters. A sampling rate of 2.048 MHz is used for sampling the signal with a band of frequencies that includes the targeted . The beat frequeny can be calculated using equation (6), by measuring the delay time between the transmitted signal and the received signal, the mixer can do this job by mixing these two signals, then the range can be measured. (Figure 4) shows the collected radar data: the x-axis is the fast time direction, each column represents one range cell, while y-axis is the slow time direction, each row represents one complete received chirp or one Coherent Processing Interval (CPI). To get the target’s range, then Fast Fourier Transform (FFT) can be performed in the fast time direction, while performing FFT in the slow time direction gets the target’s doppler information. (Figure 4) shows the target’s movement in many range cells, while another stationary target exists in the same range cell across the slow time direction.
Table 1: Radar system parameters
| Parameter | Value |
| Output Power | 16 dBm |
| Center Frequency ( ) | 4.8 GHz |
| Sweep Bandwidth ( ) | 200 MHz |
| Sampling Rate ( ) | 2.048 MSPS |
| FFT Points | 2048 point |
| Chirp Duration | 1 ms |
| Frequency resolution | 1 KHz |
| Range resolution | 0.75 m |
| Maximum Number of Available Range Cells | 1024 Range Cell |
| Range of Interest | 15 m |
| Battery Used | 11.1v/5A |
| Power Consumption | 19.98 W |
| Radar operation time for a single charge | 2.5 Hours |
| Device Cost | 800 $ |
3.3. Radar RF Front End Module
In our previous work, the (VCO), bandpass filter, power divide/combiner, and the antenna were designed and fabricated for a human breathing radar system [21]. In this work, a step forward in the design and fabrication was accomplished by introducing more analysis and design tuning. The radar Radio Frequency-Front End Module (RF-FEM) circuits are enhanced to improve the (SNR) of the received signal, and therefore improving the breathing rate detection. The new (RF-FEM) circuits are improved to be low cost, compact, high selectivity, low insertion loss in the passband, high isolation in the stopband, excellent return loss, equal phase, and equal amplitude. The (RF-FEM) architecture consists of a single transmitter and a single receiver as presented in (Figure 2). In the transmitter subsystem, a monolithic (VCO) chip TGV2562-SM is utilized to generate frequencies from 4.7 to 4.9 GHz In order to generate a chirp waveform with a preselected bandwidth, a sawtooth signal is used. The VCO printed circuit board is designed, fabricated on Rogers RO4003 substrate material with dielectric material , thickness (h) of 0.203 mm, and loss tangent ( ) as shown in (Figure 5). The VCO circuit is measured using N9918A spectrum analyzer, and the VCO output sweeps over the range from 4.7 to 4.9GHz.
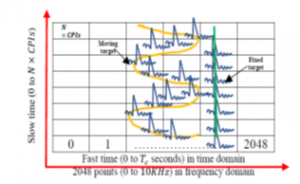
Figure 4: Radar data collection.

Figure 5: Fabricated printed circuit board of the VCO
equations (Figure 2) shows that the VCO output is connected to a 2-way power splitter. the output signal divides into two paths, a BPF in the transmitter subsystem, and a mixer in the receiver subsystem. (Figure 6) shows the design of a compact microstrip two-way equal Wilkinson RF power divider resonates at 4.8 GHz using CST software. the simulation results within the passband have good matching, isolation, and less than 0.15dB losses as shown in (Figure 6). The proposed power splitter is fabricated on Rogers RT6006 substrate with dielectric constant , thickness (h) of 0.64 mm, and loss tangent (tanδ= 0.0023) and tested using N9918A Vector Network Analyzer (VNA). The measured results show minimum insertion loss 0.2dB, Return Loss, isolation below -23dB in the operating frequency band as shown in (Figure 7).
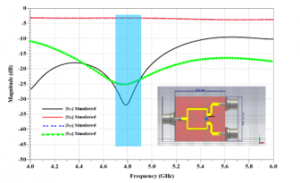
Figure 6: Power divider simulation results and the design structure
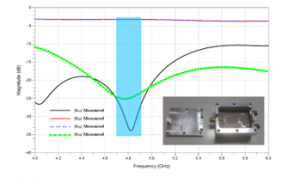
Figure 7: Measured S-parameters results of the fabricated power divider.
A high selectivity BPF is used to select the proposed RF signal on the transmitter subsystem and the receiver subsystem. The design of the presented BPF is based on a microstrip interdigital filter using CST software as shown in (Figure 8). The order of the interdigital filter is five. the simulation results of the proposed wideband BPF is illustrated in (Figure 8). The filter is fabricated on the epoxy Rogers 6006 substrate. Both measured and simulated results of the proposed wideband BPF have low insertion loss -1.1 dB, and good return loss. A good match is found between them the simulated and measured results. The simulated S-parameters are centered at 4.8 GHz while the measured results are shifted slightly and centered at 4.75 GHz as shown in (Figure 9). Any small difference between simulated and measured results from maybe a result of the standard manufacture defects and the copper surface roughness [22].
The BPF output on the transmitter subsystem is amplified via the use of a ZRON-8G+ Mini-Circuits power amplifier. The output of the amplifier is attached to a high gain transmitter antenna. The transmitter antenna is a pyramid horn antenna operating at C-band. (Figure 10) shows the design model and the simulated return loss of the horn antenna using CST software. The simulated results of 3-D radiation patterns of the antenna are given in (Figure 11). The antenna gain is more than 16.5 dB over the operating bandwidth. The horn antenna is fabricated from an aluminum sheet with 3mm thickness as shown in (Figure 12). The simulated results using the CST simulator are compared with the measured one and it achieves good agreements. The antenna return loss was measured using N9928A Field Fox handheld microwave VNA. As illustrated in (Figure 12), the simulated and measured return loss results of the antenna are less than -10 dB in the operating bandwidth.
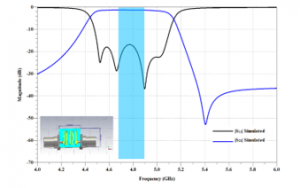
Figurer 8: CST structure of the interdigital filter and the simulation results.
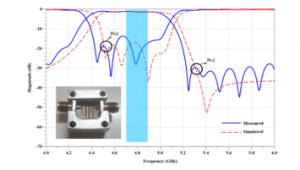
Figure 9: Measured and simulated results of the proposed BPF.
Next, the RF echo signals are received in the receiver subsystem via the receiving antenna, which is a composition of clutter and targets. The receiving antenna is the same as the transmitter antenna. The antenna output is amplified using ZX60-542LN+ Mini-Circuits (LNA). A BPF filter follows the LNA to select the proposed bandwidth. The filtered signal in the receiver subsystem and the output signal from the power splitter in the transmitter subsystem is mixed, using a wideband frequency mixer ZX05-14-S+ to convert the signal to baseband down.

Figure 10: Simulated return loss and the 3D view of the proposed antenna.
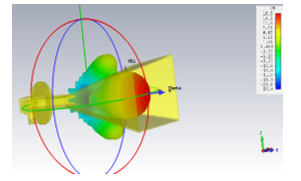
Figure 11: 3D view of the Radiation pattern.

Figure 12: Measured and simulated return loss results.
3.4. Signal Processing
The output of the mixer contains two major frequency components, Sum and difference of the received signal and the reference signal. The signal of interest is the low frequency which contains the target information, Range and Doppler. A LPF is designed and implemented with a cutoff frequency of 1 MHz to filter the mixer output signal from the high frequency components, (Figure 13) shows the filter response. The filtered signal then passes through a 8-bit ADC at 2.048 MSPS sampling rate. The FPGA receives the signal for signal processing.
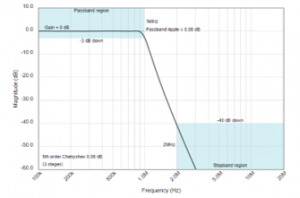
Figure 13: Frequency response of the baseband LPF.
An FPGA board of type XILINX Nexys4, Artix-7 XC7A100T FPGA board, is used for the implementation of the signal processor. A pipelined (FFT) at 2048 point is applied to the ADC output in the fast time direction as shown in (Figure 14) to extract the frequency component corresponding to the actual range.
Figure 14.a shows that the chirp signal is received continuously through the receiver antenna and the LNA for a single moving target. Figure 14.b shows the resultant signal form the mixer output, which contains the target’s information, the range and the Doppler. The amplitude of the signal increases and decreases depending on whether the target is approaching or drifting away from the radar. Figure 14.c shows the spectrum of the received signal after performing FFT, a target’s frequency appears with the largest amplitude which changes with the change of the received target signal. The spectrum for each chirp then is stored in a memory Figure 14.d, so that a second FFT can be performed in the slow time for Doppler estimation as shown in Figure 14.e.
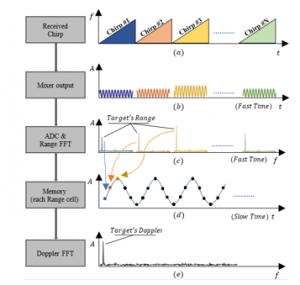
Figure 14: (a) Received chirps, and (b) Mixer output, and (c) Beat frequency in frequency domain, or spectrum of each chirp and (d) Storing target’s data into memory for second FFT (slow time), and (e) Slow time FFT for Doppler estimation.
(Figure 15) shows the general block diagram of the digital signal processor. After, the Moving Target Indicator (MTI) is applied to the first FFT output, to remove the stationary targets. MTI can be enabled/disabled, it depends on the target parameters and the environmental conditions, and either one pulse or two pulse cancellers can be selected depending on the targeted speed measurement of the moving target. Then, an adaptive Constant False Alarm Rate (CFAR) is applied, and either Smallest-of-CFAR (GOCFAR) or Greatest-of-CFAR (SOCFAR) can be selected, both having the widow size adjustable (16 or 32).
A decision based on an adjustable number of successive target hits is made using a binary integrator; it can be manually turned on or off during the device run-time operation, and the required number of successive hits can be adjusted during the run-time operation as well, without affecting the radar operation.
All the parameters that can be configured, are perfectly synchronized by the synchronizer to avoid any errors due to removing/adding signal processing blocks or changing numbers within each block in real time, during run time operation. The output block can be separately sent directly to a host PC using serial communication protocol during run-time to monitor and track the received signal in each block, as well as for further analysis, testing and processing.
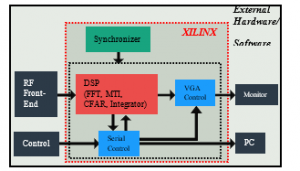
Figure 15: Developed Digital Signal Processing block diagram using XILINX FPGA.
3.5. Simulation Results
The simulation process is based on a simulated target from the MATLAB software, the simulated target then is processed in MATLAB software, the same MATLAB generated target is then processed in ModelSim software (FPGA simulator) , then the signal processing is applied, The outputs of FFT from both MATLAB and ModelSim are compared with each other, the same is applied to the MTI and CFAR. The results show that the outputs of the MATLAB and FPGA are identical. (Figure 16) shows the simulation criteria.
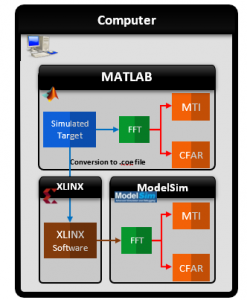
Figure 16: Developed Digital Signal Processing block diagram using XILINX FPGA.
4. Experimental Results
In this section, two experiments are presented, in the first experiment, a breathing signal is estimated from a human sitting in front of the radar device. In the second experiment, an FFT process is applied to a received signal from a human target moving back and forth within certain range from the radar, the FFT-processed data then is sent to the PC.
4.1. Breathing Detection
In this experiment (the first experiment), three measurements were taken from a human in three scenarios:
A human is sitting at a distance of 2.25m, 6m and a measurement without any target in front of the radar for results comparison.
(Figure 17) shows the breathing signal at the 3rd range cell (2.25 m) in time domain, after applying first FFT, the received breathing signal is caused by the human chest movement. After performing the 2nd FFT, a peak appears in the frequency domain which represents the breathing frequency, as shown in (Figure 18)

Figure 17: Time domain breathing signal at the 3rd range cell.

Figure 18: Breathing signal detection results of two ranges.
(Figure 18) shows that a breathing signal has been successfully extracted. Two peaks are detected at 0.4Hz and 0.37Hz detected at a distance 2.25m and 6m, respectively, which represent the breathing signal. To assure that the output peaks represent the breathing signal, not noise signal from the surrounding area or the thermal noise, a measurement was taken without a human in front of the radar, the result as in (Figure 17) green dashed line shows that the breathing frequency disappeared.
4.2. Movement Detection
In the second experiment, The radar device was placed in the free space, and there was two tanks in the left of the radar as shown in (Figure 19). The first data collected without a moving target shows a weak signal at 15 meters as the two tanks was placed on the left of the radar as shown in (Figure 20), a human is moving within 15m back and forth as shown in collected data in (Figure 21), the figure shows that the target appears distinguishable from the noise, as a result of the new RF components presented in this paper.
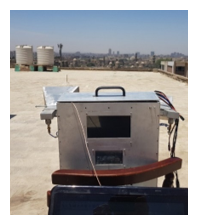
Figure 19: Measurement setup.
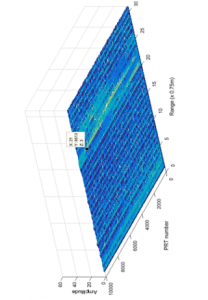
Figure 20: Data collected without moving target.
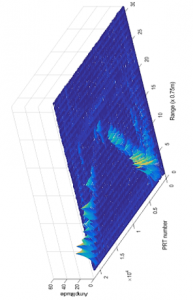
Figure 21: Data collected with the moving target.
4.3. System complexity:
In this paper, the proposed radar system contains IF components and RF components, The RF components comprises new simple RF designs yet with the best performance, while the readymade components are available in the market for commercial use.
The IF section contains the custom locally manufactured boards for this specific radar system, like ADC, LPF, Function Generator (FG) and power supply with attached battery, all were made by locally available components which made the IF section the cheapest part in the system. The FPGA is chosen carefully by calculating the needed resources for the DSP algorithm, that assures the best choice of the FPGA to avoid the high cost FPGAs.
The whole system was intended to be designed as simple as possible, to assure the availability of the required components, the reliability of usage, simplicity in maintenance, with the best performance as shown in previous sections.
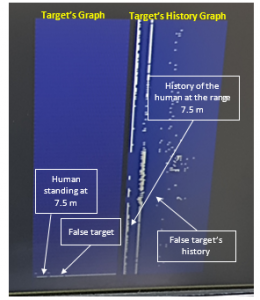
Figure 22: Real target detected on the monitor from the FPGA directly.
Table 2: Previous Work Comparison
| Parameter | This Work | [23] | [24] |
| Start frequency | 4.7 GHz | 2.1 GHz | 8 GHz |
| Bandwidth | 200 MHz | 12.5 MHz | 4 GHz |
| ADC sampling rate | 2.048 MSPS | 25 MSPS | 1 MHz |
| Sweep period | 1 ms | 1 ms | 100 ms |
| Power Output | 16 dBm | 33 dBm | 2 dBm |
| Configurability | Yes | No | No |
| FMCW software | No software required (Windows and Ubuntu are optional) | GNU Radio (Ubuntu) | GNU Radio (Windows) |
| Cost | Low | High | High |
The monitoring system is a key component in this system, the system does not require a software at all, however, an optional software is designed for target monitoring. A Video Graphics Array (VGA) algorithm is implemented on FPGA, taking the advantage of the remaining FPGA resources to show the signal processing results on the VGA screen directly as shown in (Figure 22) and assures the real time detection of the targets and breathing signal. The monitor screen can show the received signal in time domain/frequency domain, breathing signal in time domain/frequency domain, CFAR target output with 5 seconds target history. Switching between all the outputs on the screen can be controlled using the configuration control screen. One advantage of the VGA controller is that the system takes only 10 seconds to boot.
The monitoring system is a key component in this system, the system does not require a software at all, however, an optional software is designed for target monitoring. A Video Graphics Array (VGA) algorithm is implemented on FPGA, taking the advantage of the remaining FPGA resources to show the signal processing results on the VGA screen directly as shown in (Figure 22) and assures the real time detection of the targets and breathing signal. The monitor screen can show the received signal in time domain/frequency domain, breathing signal in time domain/frequency domain, CFAR target output with 5 seconds target history. Switching between all the outputs on the screen can be controlled using the configuration control screen. One advantage of the VGA controller is that the system takes only 10 seconds to boot.
4.4. Previous Work Comparison
Table 2 Shows a comparison between the proposed radar system and some other developed radar devices. The comparison shows that the proposed radar system is gaining the advantage of the configurability function, with relatively better price, in addition to that, our system does not require any software or operating system for the operation.
5. Conclusion and Future Work
In this paper, a reconfigurable radar system is proposed. The radar device is designed for human movement as well as for breathing detection. The proposed radar system is implemented using a new low-cost RF front end component and a reconfigurable radar signal processor. The radar device is aimed to operate in different situations and multiple environmental conditions. Depending on the required situations, MTI, CFAR and binary integrator can be configured for better performance. The system parameters can be reconfigured during the run time; without affecting the working efficiency. The Proposed radar system is compact and low cost compared to other radar systems with some similar parameters and operates in outdoor and indoor scenarios.
This research work will be extended by using software-defined radio (SDR), to generate the LFMCW waveform and to implement the digital receiver and DSP subsystem. SDR will help in generating different transmitted waveform configurations, decreasing the main to side-lobe level of the transmitted waveform, decreasing the overall size of the radar system, and reducing the cost. After that, many adjustments to the system can help in increasing the operating range and the breathing rate estimation accuracy. Additionally, some functions will be added to the VGA screen for ease to use, like adding grids, numbers and letters.
- M. Mabrouk, S. Rajan, M. Bolic, I. Batkin, H.R. Dajani, V.Z. Groza, “Model of human breathing reflected signal received by PN-UWB radar,” 2014 36th Annual International Conference of the IEEE Engineering in Medicine and Biology Society, EMBC 2014, 4559–4562, 2014, doi: 10.1109/EMBC.2014.6944638.
- S. Sharpe, Seals, J.; MacDonald, A.H.; Crowgey, S.R. Non-Contact Vital Signs Monitor. U.S. Patent 4,958,638, 25 September 1990.
- J. Pan, “Medical Applications of Ultra-Wideband (UWB),” Hadley, 2007.
- T. R. Frieden, “The State of Aging and Health in America,” Atlanta, 2013.
- F. Quaiyum, L. Ren, S. Nahar, F. Foroughian, A.E. Fathy, “Development of a reconfigurable low cost multi-mode radar system for contactless vital signs detection,” IEEE MTT-S International Microwave Symposium Digest, 6, 1245–1247, 2017, doi: 10.1109/MWSYM.2017.80 58832.
- D. Zhang, M. Kurata, T. Inaba, “FMCW radar for small displacement detection of vital signal using projection matrix method,” International Journal of Antennas and Propagation, 2013(1), 1–6, 2013, doi: 10.1155/2013/57198 6.
- H. Lee, B.H. Kim, J.K. Park, J.G. Yook, “A novel vital-sign sensing algorithm for multiple subjects based on 24-GHz FMCW Doppler radar,” Remote Sensing, 11(10), 2019, doi: 10.3390/rs11101237.
- N. Maaref, P. Millot, C. Pichot, O. Picon, “A study of UWB FM-CW radar for the detection of human beings in motion inside a building,” IEEE Transactions on Geoscience and RemoteSensing, 47(5), 1297–1300, 2009, doi: 10.1109/TG RS.2008.2010709.
- A. Nezirovic, A.G. Yarovoy, L.P. Ligthart, “Experimental Verification of Human Being Detection Dependency on Operational UWB Frequency Band.” IEEE International Conference on Ultra-Wideband, Singapore, 305-310, 2007, doi: 10.1109/ICUWB.2007.4380960.
- L. Anitori, A. De Jong, F. Nennie, “FMCW radar for life-sign detection,” 2009 IEEE Radar Conference, 1-6, 2009, doi: 10.1109/RADAR .2009.4976934.
- C. Gu, G. Wang, T. Inoue, C. Li, “Doppler radar vital sign detection with random body movement cancellation based on adaptive phase compensation,” 2013 IEEE MTT-S International Microwave Symposium Digest, 1-3, 2013, doi: 10.1109/MWSYM.2013.6697618.
- A. Ahmad, J.C. Roh, D. Wang, A. Dubey, “Vital signs monitoring of multiple people using a FMCW millimeter-wave sensor,” 2018 IEEE Radar Conference (RadarConf18), 4, 1450–1455, 2018, doi:10.1109 /RADA R.2018.8 37 8778.
- M. Alizadeh, G. Shaker, J.C.M. De Almeida, P.P. Morita, S. Safavi-Naeini, “Remote monitoring of human vital signs using mm-Wave FMCW Radar,” IEEE Access, 7(4), 54958–54968, 2019, doi: 10.1109/ACCESS. 2019.2912956.
- M. Mabrouk, S. Rajan, M. Bolic, M. Forouzanfar, H.R. Dajani, I. Batkin, “Human Breathing Rate Estimation from Radar Returns Using Harmonically Related Filters,” Journal of Sensors, 2016, doi: 10.1155/2016/9891852.
- M. I. Skolnik, Radar Systems, New York: McGraw-Hill, 2001.
- M. Mabrouk, W. Mohamed, S. Aly, H.M. Hassan, “MTD Design and Implementation Using Short Coherent Processing Interval Phase Trace,” Proceedings of 172nd ISERD International Conference, Cairo, Egypt ,40-44, 2019.
- R. Sor, J.S. Sathone, S.U. Deoghare, M.S. Sutaone, “OS-CFAR Based on Thresholding Approaches for Target Detection,” Proceedings – 2018 4th International Conference on Computing, Communication Control and Automation, ICCUBEA 2018, 1–6, 2018, doi: 10.1109/ICCUBEA.2018.8697389.
- C. Xu, Y. Li, C. Ji, Y. Huang, H. Wang, Y. Xia, “An improved CFAR algorithm for target detection,” International Symposium on Intelligent Signal Processing and Communication Systems, ISPACS 2017 -Proceedings, 883–888, 2017, doi: 10.1109/ISPACS .2017.8266600.
- X. Meng, Y. He, N. Aeronautical, E. Academy, “Two Generalized Greatest of Selection CFAR Algorithms,” CIE International Conference on Radar Proceedings (Cat No.01TH8559), Beijing, China, 359–362, 2001, 359-362, doi: 10.1109/ICR.2001.984700.
- Meng Xiangwei, Guan Jian, He You, “A generalized smallest of selection CFAR algorithm [radar signal processing],” 130–132, 2004, doi: 10.1109/radar.2003. 1278724.
- M.M. Abdul-atty, M. Mabrouk, S. Elramly, “Design and Implementation of a Low Cost FMCW Radar with Configurable Signal Processor for Human Movement and Breathing Detection,” International Journal of Electrical, Electronics and Data Communication, 7(9), 36–41, 2019, doi: RW.18042019.12277.
- X. Chen, “EM modeling of microstrip conductor losses including surface roughness effect,” IEEE Microwave and Wireless Components Letters, 17 (2), 94–96, 2007, doi: 10.1109/LMWC.2006.890326.
- JIAXI ZHU, “LOW-COST, SOFTWARE DEFINED FMCW RADAR FOR OBSERVATIONS OF DRONES”. M.Sc. thesis, Oklahoma univ., Norman, Oklahoma, 2017.
- A. Anghel, G. Vasile, R. Cacoveanu, C. Ioana, S. Ciochina, “Short-Range wideband FMCW radar for millimetric displacement measurements,” IEEE Transactions on Geoscience and Remote Sensing, 52 (9), 5633–5642, 2014, doi: 10.1109/TGRS.2013.2291573.