
Agricultural Data Fusion for SmartAgro Telemetry System
Volume 5, Issue 5, Page No 1266-1272, 2020
Author’s Name: Ioana Marcu1,a), Ana-Maria Drăgulinescu1, Carmen Florea1, Cristina Bălăceanu2, Marius Alexandru Dobrea2, George Suciu2
View Affiliations
1Telecommunication Department, University Politehnica of Bucharest, 010082, Romania
2R&D Department, Beia Consult International, Bucharest, 010082, Romania
a)Author to whom correspondence should be addressed. E-mail: ioana.marcu@upb.ro
Adv. Sci. Technol. Eng. Syst. J. 5(5), 1266-1272 (2020); ![]() DOI: 10.25046/aj0505152
DOI: 10.25046/aj0505152
Keywords: Precision Agriculture, Data Fusion, Reliability, Sensors

Export Citations
Smart agriculture concept uses innovative solutions including IoT and Cloud storage features, dedicated sensors for monitoring basic agricultural parameters, new communications protocols, etc. SmartAgro architecture comprises a telemetry system for Key Performance Indicators (KPIs) such as air & soil temperature, air & soil relative humidity, leaf wetness, etc. The current paper outlines the reliability of the implemented system by comparing and analyzing data collected in spring 2019 and spring 2020. The relevance of this season consists in great air variations due to the transition from winter to summer. Being monitored in a vine area near Bucharest, these data may be useful for different statistics related to grapes culture in this season and can be used by interested parties for future predictions related to vine crops. Moreover, in this paper, data fusion will allow advanced data management and coherence achievement among collected data.
Received: 16 July 2020, Accepted: 15 October 2020, Published Online: 24 October 2020
1. Introduction
This paper is an extension of work originally presented in SIITME’19 conference [1]. In [1] the authors presented the telemetry system with its main advantages consisting in solar panel supply and data reliability. The current work extends the demonstration of the system’s reliability by processing data from Spring 2019 and Spring 2020. In addition to the previous work, data fusion will be used to fill the gaps between the recorded data and to ensure a proper system’s management.
Considering all climate changes, the evolution of the agriculture plays an important role in the lives and well-being of people, since it represents a source of food for population and, respectively for domestic animals. Climate change influences agriculture in different ways. Changes in temperature and precipitation are already affecting crop yields [2]. Consequently, people must adapt to and implicitly adjust the solutions used to ensure food or water quality, for irrigation and daily use [3]. The health of soils and crop, also, is very important, as it affects the quality and quantity of agricultural crops [4, 5].
When required to evaluate successful analysed crops, the key performance indicators (KPIs) must be considered since they are quantitative, practical, directional, and actionable. Depending on the analysed corps, KPIs differ. For example, based on KPIs crop usage can be tracked to evaluate the production and to monitor the overall costs. The most significant impacts of KPIs on agriculture are increased productivity, profit and time save [6].
An important role in the precision agriculture is played by IoT platforms. Using them, the quality of the crops can be enhanced by real time data acquisition, processing and decision making. These data are converted, thus, in useful information for farmers, and, also, in a facile understandable manner [7]. Capturing, transmitting, storing and processing the volume of information collected by sensors connected on the IoT platform, show a number of challenges, in particular, regarding integration technologies, communications, databases and computing. A middleware platform which alleviates these issues is FIWARE. FIWARE is a technology supported by the European Commission to make possible the IoT in the context of the Future Internet [8].
SmartFarmNet is an IoT platform that automatically collects data from soil, as fertilization and irrigation. The data is then automatically correlated, and the invalid data is filtered-out from the perspective of assessing crop performance. Also, with the help of the platform the crop forecasts can be computed, and the farmers receive personalized crop recommendations for any farm [9].
There are also platforms which are specialised on only one aspect such as SWAMP. Within SWAMP project there was developed and assessed an IoT-based smart water management platform for precision irrigation in agriculture. The platform was built in such manner that it can be configured and deployed in different ways. Thus, the platform can deal with the requirements and limitations of different countries, climate, soils, and crops, which require flexibility to adapt to a range of deployment configurations involving mixed technologies [10].
Data fusion techniques applied on data collected by different sensors used in agricultural area allow a better understanding of parameters’ evolution and advanced data management, especially in cases where the data volume is huge [11], [12]. Yet, the applicability domain is not limited only to agriculture, but it can comprise different applications that are sensor-based and that imply multiple data sources.
The current paper aims to emphasize the role of the implemented SmartAgro telemetry system in ensuring reliable data for further use in statistics and specialized predictions. Data fusion methods will allow additional processing that will offer a global perspective of the monitored parameters. The paper is organized as follows: Section 2 presents the related work on data fusion solution for key parameters monitored in precision agriculture; Section 3 contains the description of SmartAgro telemetry system and in Section 4 system’s setup and relevant monitoring results are presented. Data fusion implications are outlined in Section 5 and Section 6 comprises Conclusions.
2. Data Fusion for Agricultural Area
According to [13], when acquirred data present high and diverse information, data fusion considers the juxtaposition of large set of data to ensure reliable, homogeneously and fair overview of the collected information. The advantage of data fusion of data received from multiple different sensors relies in “an improved estimate of physical phenomenon via redundant observations” [14]. The efficiency of data fusion was previously demonstrated in precision agriculture domain [15-18]. In [15], authors present the benefits on crop monitoring of 2D and 3D data fusion for a vineyard monitoring and use the results in order to classify vines in serveral classes by processing data from multiple sources (different sensors, Unmanned Aerial Vehicle (UAVs), etc). In 2012, in [16] different data fusion methods were used (e.g. multiple linear regression (SMLR), partial least squares regression (PLSR) and principal components analysis combined with stepwise multiple linear regression (PCA+SMLR) techniques) to predict multiple soil properties. Authors’ conclusions indicate that data fusion techniques are more relevant in clayey field and worse in sandy field and, in addition, these methods can improve the quality of soil sensing in precision agriculture if appropriate sensors are selected. Later, in 2017, sensor data fusion for soil health assessment was applied in [17] and, as a result, faster determination of soil health was achieved by merging data gathered from all sensors. In a more advanced manner, in [18] sensing data fusion methods are involved in crop detection. Authors use an efficient method of fusing multi-source remote sensing images with a convolution neural networks (CNN) for semantic segmentation to identify crops (93% succesful rate) in detecting and identifying crops.
In this paper we use data fusion technique on agricultural KPIs to fill the gaps and to create a complete picture of their variation even in the absence of their recording by the telemetry system.
3. ADCON-based Architecture of Telemetry System
Monitoring of KPIs (such as air and soil temperature, crop state, air and soil relative humidity) for a vine located in a residential area close to Bucharest was performed using an ADCON-based telemetry system (called SmartAgro). The selected season was spring since it is a season in which high variations may be observed because of the transition from winter to summer (two seasons with extreme temperatures). Figure 1 illustrates the new concept of SmartAgro telemetry system in which different dedicated agricultural sensors are interconnected for main parameter’s monitoring.

Figure 1: SmartAgro innovative architecture [19]
The data acquired from the agricultural sensors were centralized into a database and were used to highlight the impact of measured parameters on crops [19]. The architecture differs from the traditional ones by introducing two new levels consisting in: The Edge level: at this level telemetry data are passed through a decision-making system based on artificial intelligence techniques for data analysis and detection of abnormal values. Also, at this level, the data are classified as belonging to alert scenarios or simple monitoring. This determines the optimization of communication, in terms of traffic and energy consumption. LoRa technology is proposed for monitoring data, a technology known for extremely low energy consumption and for the field very extensive coverage. For scenarios involving alerts and critical change of parameters, Wi-Fi (short range) or 4G technology can still be used for a large coverage area. Further, the Local Storage level has a role in storing relevant, processed, analysed, and labelled data to reduce latencies in alert scenarios and for applications. on-field, off-line. Additional functionalities of the proposed telemetry system are given in [19].
4. Extended monitoring results
To demonstrate the reliability of the system, extended monitoring results are presented. The measurements were performed in 2019 and 2020 and the data were acquired each 6 hours per day, starting with 8 a.m.
4.1. Air temperature monitoring
Figure 2 illustrates the variation of air temperature during Spring of 2019 and 2020.

Figure 2: Air temperature variation in Spring 2019 (up), Spring 2020 (down)
Based on results in Figure 2, it can be seen the patterns of the day-night air temperature variation, also called Day/Night Differential (DIF). Higher temperature peaks can be observed in Figure 3. DIF value has multiple significances: firstly, DIF values were related to plant growth. Moreover, values of DIF around 8°C were proved to provide the best plant growth, whereas DIF values between 12°C and 22°C showed a low correlation to the predicted results in [20] for Chrysanthemum.
From the air temperature data provided by SmartAgro platform in the two seasons (Spring 2019 and Spring 2020), we can state that in Spring 2019 the plant growing should have been more pronounced, as the DIF was lower than 12°C.

Figure 3: Soil temperature variation in Spring 2019 (up), Spring 2020 (down)
4.2. Soil temperature monitoring
From Figure 3, which outline the variation of soil temperature for Spring 2019 and Spring 2020, there can be observed that the patterns are identical with their correspondent air temperature data in Spring 2019 and, respectively, in Spring 2020, with the exception of a temperature offset of -5°C for both Spring 2019 and for Spring 2020.
4.3. Relative air humidity monitoring
From Figure 4, which depicts the variation of relative air humidity for Spring 2019 and Spring 2020, it can be observed that the supersaturation phenomenon was similarly frequent in both years. This is related to the prediction of the rainfall and appears when the air humidity reaches 100%.
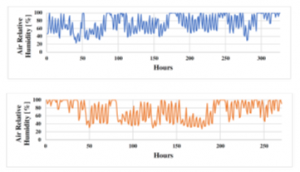
Figure 4: Relative air humidity variation in Spring 2019 (up), Spring 2020 (down)
4.4. Relative soil humidity monitoring
Figure 5 emphasizes the variation of relative soil humidity for Spring 2019 and 2020.
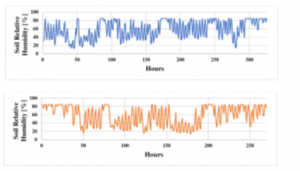
Figure 5: Relative soil humidity variation in Spring 2019 (up), Spring 2020 (down)
From Figure 5, it can be noticed that, similar to the soil and ambient temperature, the soil and ambient humidity follows the same pattern, with an offset of -15% both in Spring 2019 and in Spring 2020.
4.5. Leaf wetness monitoring
Figure 6 presents the leaf wetness variation for Spring 2019 and 2020. It can be observed that several peaks occur especially after 21:00 p.m. From the analysed data, there is no evidence of correlation between the air humidity and the leaf wetness, nor between air temperature and leaf wetness.
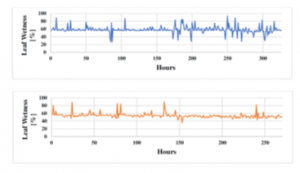
Figure 6: Leaf wetness variation in Spring 2019 (up), Spring 2020 (down)
5. Agricultural Data Analysis
The previous graphical representations did not reveal the absence of some data or the heterogeneity of the data. For example, from the previous graphs there cannot be noticed the absence of the samples for certain moments of the day or even the fact that the samples were not acquired at the same moment every day. Moreover, the data were not acquired each day.
The time intervals for data collection are March 4th, 2019 and May 31st, 2019 (Spring 2019) and March 1st, 2020 and May 28th, 2020 (Spring 2020), respectively. Analysing data of a real acquisition, it can be remarked that the samples were collected at the time moments given in Table 1.
Table 1: Classification of the samples based on the moment of acquisition
| Hours (0-24) | No. of Days (ND) | ND (2019) | ND (2020) | Total Samples |
| 3, 9, 15, 21 | 98 | 57 | 41 | 392 |
| 2, 8, 14, 20 | 48 | 23 | 25 | 192 |
| 3, 9 | 1 | 0 | 1 | 2 |
| 9, 15, 21 | 3 | 2 | 1 | 9 |
| 2 | 1 | 0 | 1 | 1 |
| Total | 596 | |||
Unfortunately, missing data determine different issues concerning the predictions and forecasts or the decisions taken by the support decision systems integrated in the overall architecture. Nevertheless, sensor data fusion techniques can bring many benefits such that the faults triggered by the data gaps can be mitigated. For exemplification, two variables are considered: air temperature and soil temperature. They were chosen after the analysis of the samples acquired because the vectors storing their values comprise NaN values, that is, there are missing samples in air temperature and soil temperature data because of system failures.
In Figure 7, it is illustrated the graphical representation of the air temperature variation at 3 a.m. and 2 a.m. for each of the days in which the data were collected, more precisely, in the intervals March 4th, 2019 and May 31st, 2019 (88 days) and March 1st, 2020 and May 28th, 2020 (88 days). Figure 7 highlights small, but important, data gaps.

Figure 7: Air temperature measured at 2am and 3am in Spring 2019
and Spring 2020
In Figure 8, it is highlighted the soil temperature variation during the same seasons, and it can be noticed that also soil temperature data is missing. In addition, as previously mentioned, the soil temperature follows the same variation pattern as in the case of air temperature and, by computing the difference between air and soil temperature, a constant value of 5°C is determined. Therefore, finding a method to determine an approximate value for air temperature will also succeed in determining the approximate value for soil temperature, too, and vice versa.

Figure 8: Soil temperature measured at 2am and 3am in Spring 2019
and Spring 2020
Further, the choice of soil temperature and air temperature variables will be justified with respect to the variation of the other parameters. Analyzing the graphical representation of air relative humidity (Figure 9), soil humidity (Figure 10) and leaf wetness (Figure 11) variations, missing data can be also observed (samples missing before and after March 13, 2019), but the data gaps are affecting all variables. The only variables that experience isolated data gaps when all the other parameters are represented are soil temperature and air temperature.
In Figure 9, air relative humidity variation for the same moment of day for Spring 2019 and Spring 2020 is represented. It can be observed that the minimum air relative humidity recorded in Spring 2019, at 2 a.m., is 37.78 % and it was recorded on March 24th, 2019, while the maximum value of 100% was reached 7 times (March 11-12, 2019; March 15, 2019; April 11th-12,2019; May 11th-12,2019).
Regarding the air relative humidity measured at 3 a.m., in Spring 2019, the minimum value was 55.74% on March 9th, 2019, while the maximum value (100%) was reached 10 times (10% in March, 40% in April, 50% in May).

Figure 9: Air relative humidity measured at 2am and 3am in Spring 2019 and Spring 2020
In Spring 2020, the minimum value of the air relative humidity measured at 2 am was 47.45% on March 16, 2020, whereas the maximum value (100%) recorded at 2 a.m. was reached 10 times (40% in March, 30% in April and 30% in May).
Concerning the samples acquired at 3 a.m. in Spring 2020, the minimum value of air relative humidity was recorded on 13.04.2020 (48.57%), whereas the maximum value of 100% was reached 9 times (22.2 % in March, 11.1% in April and 66.7% in May).
Computing the difference between soil humidity and air humidity, a constant difference of 15% is achieved and it can be seen that the variations patterns are identical (Figure 10). This can be proven also by computing the standard deviation (SD) for each season for the two possible time moments of acquisition (2 a.m. and 3 a.m.) for both variables. For both soil and air humidity variables, the values of the standard deviation coincide and are given in Table 2.
Table 2: Standard deviation of soil and air humidity for Spring 2019 and Spring 2020 (at 2am and 3 am)
| Season | SD (2am) | SD (3am) |
| Spring 2019 | 19.49 | 10.92 |
| Spring 2020 | 15.76 | 16.85 |
Therefore, by finding the approximate value of the air relative humidity, the approximate value of the soil humidity can also be determined.
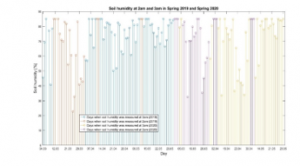
Figure 10: Soil humidity measured at 2am and 3am in Spring 2019
and Spring 2020
Finally, in Figure 11, the variation of the leaf wetness is depicted. The standard deviation (STD) of the leaf wetness parameter was computed.

Figure 11: Leaf wetness measured at 2am and 3am in Spring 2019
and Spring 2020
The lowest values of SD were obtained for Spring 2020 3 a.m. (a small value with respect to Spring 2019 was also obtained for 2 a.m.), while the highest one is obtained for Spring 2019 (2 a.m.). The small variation of leaf wetness values in Spring 2020 is highlighted in the graphical representation, too. All values of the standard deviation are given in Table .
Table 3: Standard deviation of leaf wetness for Spring 2019 and Spring 2020
(at 2am and 3 am)
| Season | SD (2am) | SD (3am) |
| Spring 2019 | 11.66 | 10.00 |
| Spring 2020 | 8.64 | 6.04 |
6. Proposed data fusion algorithm
Next, based on the data analysis performed in Section 5, we proposed a data fusion algorithm based on a hybrid decision tree.
Here, the hybrid attribute is given due to the fact that, with respect to the traditional binary tree approach, in the proposed algorithm three cases may arise: the value of the parameter is in range (1), the value of the parameter is out of range (2), the value of the parameter is not available (3). When a sample of a parameter is not available at the querying moment (case 3), the algorithm commands the estimation block that computes an estimated value of the parameter based on current samples of the other parameters and based on previous samples of the required parameter. In Figure 12, the proposed algorithm was depicted. In Table 4, the parameters acronyms and their meanings are given.
Table 4: Parameters acronyms and significance
| Acronym | Significance |
| t_air | Normal air temperature range |
| t_soil | Normal soil temperature range |
| rh_air | Normal air relative humidity range |
| rh_soil | Normal soil relative humidity range |
| leaf_wet | Normal leaf wetness range |
| T_air | Current air temperature sample |
| T_soil | Current soil temperature sample |
| RH_air | Current air relative humidity sample |
| RH_soil | Current soil relative humidity sample |
| Leaf_w | Current leaf wetness sample |
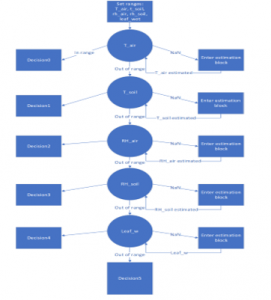
Figure 12: Hybrid decision tree for data fusion-based decision making
The correlation between the parameters is depicted in Figure 13-18.
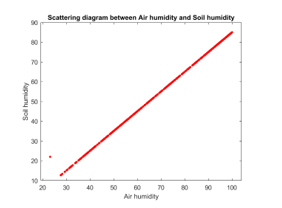
Figure 13: Scattering diagram of air humidity and soil humidity

Figure 14: Scattering diagram of air temperature and leaf wetness
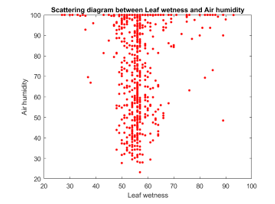
Figure 15: Scattering diagram of leaf wetness and air humidity

Figure 16: Scattering diagram of leaf wetness and soil humidity

Figure 17: Scattering diagram of soil temperature and air temperature
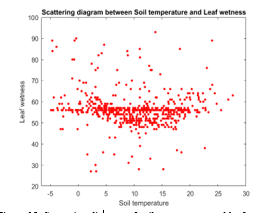
Figure 18: Scattering diagram of soil temperature and leaf wetness
7. Conclusions
Agriculture is an on-going evolving domain since worldwide survival depends in on it a great manner. Telemetry systems developed for crop and field monitoring (such as SmartAgro) play important roles in providing crucial KPIs related to air & soil temperature and/or air & soil humidity, as well as crop diseases detection. The architecture of the implemented SmartAgro system is highlighted by two relevant levels: The Edge level and the Local Storage level. They enable data classification and use parameters improvement in various cases such as alert scenarios and for applications. on-field, off-line.
Being equipped with multiple different, SmartAgro provides massive quantity of data for the monitored parameters. In this paper, the reliability of the recorded data provided by the telemetry system is outlined by performing measurements in 2 consecutive years (2019 and 2020) with a frequency of 6h/ day.
Based on the collected data related to the air temperature in Spring 2019 and Spring 2020, it can be noticed that Spring 2019 was a more favourable season for plant growing since the DIF was lower than 12°C. The variation of soil temperature led to the observation that the patterns are identical with their correspondent air temperature data in both seasons (Spring 2019 and Spring 2020). Further, by recording data on relative soil humidity and leaf wetness there was observed that there is no evidence of correlation between the monitored parameters. Yet, the similarities in variations during Spring 2019 and Spring 2020 demonstrates the reliability of the data recorded using SmartAgro telemetry system.
Since it was noticed that the monitored parameters have not been collected at the same moment in time with regularity, data fusion technique was used to fill the gaps and to provide a global overview on the behaviour of the system. Two KPIs have been considered: air temperature and soil temperature. Using data fusion, it was proven that:
- By finding a method to determine an approximate value for air temperature will also succeed in determining the approximate value for soil temperature, too, and vice versa.
- By finding the approximate value of the air relative humidity, the approximate value of the soil humidity can also be determined.
As conclusion, the goals of data fusion referring to advanced data management and coherence achievement among collected data were achieved within this research.
Conflict of Interest
The authors declare no conflict of interest.
Acknowledgment
The work presented in this paper was funded by SmartAgro project subsidiary contract no. 8592/08.05.2018, from the NETIO project ID: P_40_270, MySmis Code: 105976 and DISAVIT project, code EUROSTARS-2019-E!113655-DISAVIT/2020 and Operational Programme Human Capital of the Ministry of European Funds through Financial Agreement 51675/09.07.2019, SMIS Code 125125.
- I. Marcu, G. Suciu, C. Balaceanu, A.-M. Dragulinescu, M. A. Dobrea, “IoT Solution for Plant Monitoring in Smart Agriculture”, 2019 IEEE 25th International Symposium for Design and Technology in Electronic Packaging (SIITME), Cluj-Napoca, Romania, Romania, Oct. 2019, DOI: 10.1109/ECAI46879.2019.9041952
- European Environment Agency, Climate change adaptation in the agriculture sector in Europe, EEA Report No 04/2019 (ISBN 978-92-9480-072-5)
- M. Uzunoglu, M. S. Alam, “Dynamic modeling, design, and simulation of a combined PEM fuel cell and ultracapacitor system for stand-alone residential applications” in IEEE Trans. Ener. Conv., 21(3), 767–775, 2006. https://doi.org/10.1109/TEC.2006.875468
- I. Hadade, T. M. Jones, F. Wang, L. di Mare, “Software Prefetching for Unstructured Mesh Applications” in 2018 IEEE/ACM 8th Workshop on Irregular Applications: Architectures and Algorithms (IA3), Dallas, TX, USA, 2018. https://doi.org/10.1109/IA3.2018.00009
- H. Lihua, “Analysis of Fuel Cell Generation System Application,” Ph.D Thesis, Chongqing University, 2005.
- https://blog.agrivi.com/post/measuring-kpis-for-increasing-productivity
- M. H. Nehrir, C. Wang, Modeling and Control of Fuel Cells: Distributed Generation Applications, Wiley-IEEE Press, 2009.
- R. Martínez, JÁ Pastor, B. Álvarez, A. Iborra, “A Testbed to Evaluate the FIWARE-Based IoT Platform in the Domain of Precision Agriculture” Sensors (Basel). 2016; 16(11):1979, 2016. doi:10.3390/s16111979
- F.J. Ferrández-Pastor, J.M. García-Chamizo, M. Nieto-Hidalgo, J. Mora-Martínez, “Precision Agriculture Design Method Using a Distributed Computing Architecture on Internet of Things Context” Sensors (Basel). 18(6):1731, 2018. doi:10.3390/s18061731
- C. Kamienski, J.P. Soininen, M. Taumberger, et al. “Smart Water Management Platform: IoT-Based Precision Irrigation for Agriculture” Sensors (Basel). 2019; 19(2), 276. Published 2019. doi:10.3390/s19020276
- E-agriculture in Action: Big Data for Agriculture. Bangkok, FAO and ITU. 2019. Available online: http://www.fao.org/3/ca5427en/ca5427en.pdf
- X. Shi, X. An, Q. Zhao, H. Liu, L. Xia, X. Sun, Y. Guo, “State-of-the-Art Internet of Things in Protected Agriculture”, Sensors (Basel). 2019 Apr; 19(8): 1833, 2019
- A. de Juan, R. Tauler, Data Fusion Methodology and Applications, Elsevier, 2019
- P. Rashinkar, V. S. Krushnasamy, “An overview of data fusion techniques” in 2017 International Conference on Innovative Mechanisms for Industry Applications (ICIMIA), Bangalore, India, 2017, DOI: 10.1109/ICIMIA.2017.7975553
- L. Comba, A. Biglia, D. Ricauda Aimonino, P. Barge, C. Tortia, P. Gay, “2D and 3D data fusion for crop monitoring in precision agriculture” in 2019 IEEE International Workshop on Metrology for Agriculture and Forestry (MetroAgriFor), Portici, Italy, 2019, DOI: 10.1109/MetroAgriFor.2019.8909219
- H. S. Mahmood, W. B. Hoogmoed, E. J. van Henten, “Sensor data fusion to predict multiple soil properties”, Precision Agric 13, 628–645, 2012. DOI 10.1007/s11119-012-9280-7
- K. S. Veuma, K. A. Suddutha, R. J. Kremerb, N. R. Kitchena “Sensor data fusion for soil health assessment” Geoderma 305, 53–61, 2017.
- J. Pena, Y. Tan, W. Boonpook, “Semantic segmentation based remote sensing data fusion on crops detection”, Journal of Computer and Communications, 7(7), 53-64., 2019 DOI: 10.4236/jcc.2019.77006
- I. Marcu, G. Suciu, C. Bălăceanu, A. Vulpe, and A.-M. Drăgulinescu, “Arrowhead Technology for Digitalization and Automation Solution: Smart Cities and Smart Agriculture” Sensors, 20(5), 1464, Mar. 2020.
- SM Carvalho, E Heuvelink, R Cascais, O. van Kooten. Effect of day and night temperature on internode and stem length in chrysanthemum: is everything explained by DIF?. Ann Bot. 90(1):111-118, 2002. doi:10.1093/aob/mcf154