Resilience Assessment of System Process Through Fuzzy Logic: Case of COVID-19 Context

Adv. Sci. Technol. Eng. Syst. J. 5(5), 1247–1260 (2020);
 DOI: 10.25046/aj0505150
The present work is undertaken as part of research studies aiming to provide sociotechnical systems with a decision-making tool that supports them in assessing the resilience of their processes. The ultimate objective is to fix the identified imperfections in order to steadily gain strength and effectiveness to cope with new and existing threats and challenges. In that respect, this paper presents a framework called 3R process whose goal is to calculate the resilience score for a process based on several parameters and grade it on the resilience scale. In order to achieve this, a fuzzy model has been put in place and graphic user interfaces have been designed so that the 3R process becomes an integral part of daily working practices. Finally, a real case company example in the context of COVID-19 is exposed towards putting into practice the proposed model.
1. Introduction
In an increasingly uncertain and volatile world, sociotechnical systems, which are complex systems incorporating technical (machines and technology that provide an authentic link between the user input and the system’s output) and social (people and society) systems that both have interactions between them, and those interactions are a key factor in the success or failure of system performance [1], are bending over backwards to become more resilient in order to be able to react to change as quickly as possible and to treat challenges and mistakes as a learning opportunity. An obvious case in point is the Nokia organization. This company, at one point, had 32% of the global market share in smartphones and mobile phones [2]. However, as it is well known, Nokia fell from grace with respect to the mobile phones market. They misread the North American market and they did not respond correctly when Apple and Samsung introduced new products and it took them too long to catch up. Eventually, they had to sell their mobile phone business to Microsoft, and effectively had to exit the mobile phone market, which they dominated only a few years earlier. Nevertheless, what makes Nokia such an interesting case of resilient organization is that despite the fact that Nokia made a mistake, it has been putting back together an organization. They refocused on their core transmission on business, they have been thinking how to position their navigational services and connecting with other organizations to produce new software, new kinds of handsets. The organization did not fall apart and was able to remake itself. In fact, their stock price, from the time they sold the business to Microsoft to recently, doubled. Indeed, what is important for every system is to develop resilience capabilities such as the ability to sense what is happening out in its environment and to compare that with what is done inside the organization, and, as necessary make the changes [3]. The question now being asked is how a system can assess its own resilience level so it can take stock of its strengths and weaknesses, threats and opportunities in terms of dealing with disturbances and returning to normal function.
In fact, several attempts have been made to find new approaches and frameworks that help in the resilience assessment. Amongst these, there are methods established to evaluate resilience of critical infrastructures, such as defining a generalized index that serves for quantifying the resilience under various scenarios [4], or designing a quantitative method to assess distinct elements in a critical infrastructure system [5].
Furthermore, different frameworks were proposed for the assessment of supply chain resilience, for example, elaborating an assessment model in order to measure organizational, business and labor resilience performance of supply chain [6], or developing a framework that integrates the concepts of resilience with risk management techniques in order to understand how a supply chain reacts to disruptions as a function of time [7].
Idem for urban communities as establishing a methodology for evaluating the earthquake resilience [8], or putting into place a workbook that helps urban areas incorporate resilience thinking into their planning practice [9], and so forth.
Moreover, measuring and quantifying resilience has proved challenging and research works in this field are not so numerous. However, some researchers have sought to contribute to fill this gap by developing methods aimed at calculating resilience. For example, we can find quantitative models explaining how to compute resilience of manufacturing [10] or nuclear power [11] plants, physical networks [12], mass railway transportation [13], and the list goes on.
In this same perspective, the 3R process dedicated to assigning a resilience level to sociotechnical system processes is described in this paper. This framework is based on the resilience scale [14], a scoring system, which is composed of five echelons: 0.Unconscious (Processes belonging to this category have no resilience processes associated with them), 1.Informed (These processes are warned of resilience without any elaborated resilience processes), 2.Aspiring (These processes are beginners and try to set up resilience processes), 3.Progressing (These processes overcome less serious disruptions within a reasonable time. However, the consequences can be more devastating in serious situations), 4.Expert (For this kind of processes, the anticipated situations are perfectly manageable. As per the unforeseen situations, they try to adapt to changes), and which aims to assess the level of resilience of a given process. The present work will go beyond this qualitative description to find out how this scale can be used by a sociotechnical system in order to assess the resilience of its own processes by attributing a resilience score to each process.
For this purpose, the first section will be devoted to the selection of needed indicators. This step is of such importance since the indicators provide the necessary information for decision-making and constitute a basis for our calculation model. However, in order to be able to accomplish these missions, the indicators should be relevant. This means that they should be specific so that the results can be clearly identified, measurable and quantified, practical and useable, available (it should be possible to collect the data), be transparent in methodology and selection and well-grounded in scientifically [15]. After this, the “3R” process will be defined in the second section. This method relies mainly on three concepts, which are (1) resources that can be considered, among others (time, budget, regulations…) as a constraint that may limit the achievement of the process objective [16], (2) risks, which are undesirable events that may happen several times can have a negative impact on the process [17], (3) Resilience, which is the ability of a system to manage disturbances and to adapt to changes without ceasing the activity[18]. In this section, a model explaining extensively the 3R process that is divided into two steps (Definition of parameters and resilience assessment) will be derived, the way of calculating the resilience score using fuzzy logic, a procedure that has already proved its effectiveness in many fields, will be explicitly shown, and graphic user interfaces will be developed. Then, a real case company example in the context of COVID-19 is presented in the penultimate section. The purpose is to check the reliability of the proposed method through assessing the resilience of a process of a huge company in face of this exceptional crisis. At the end of this paper, conclusions and opportunities for further work will be exposed.
2. Selection of indicators
The role of resilience processes is to ensure the continued availability of resources, in case of disruptions, in order to avoid failures. This objective can be achieved through resistance, recovery, and anticipation [19]. Thus, the selection of indicators will be in relation with these three missions.
As per resistance, a variety of metrics can be considered [20]:
- The meantime between failures (MTBF), which indicates the expected time between consecutive failures.
- The operational availability that expresses the percentage of time a process is available to users.
- The operational reliability, which is defined as the ability of a processto operate at the normal service levelfor a specified period of time.
- The Maximum Tolerable Period of Disruption (MTPD) that measures the time for which a process can be available before entirely stopping the system activity. It depends on the system business objectives and thus determined by the organization. The importance of this indicator lies in the fact that it has an impact on the recovery metrics [21]. Furthermore, the MTPD is identified as one of the inputs used to prepare the response plans [22].
In the light of the foregoing, the MTPD is picked up and the criticality of processes will be defined according to the value of MTPD.
Table 1: The selected indicators
| Resilience process mission | Indicator | Description |
| Resistance | MTPD | Time after which operations of the site are critically impacted, in case of a full process unavailability. |
| Recovery | RT | Time required for the system to resume normal operation after a disruption. |
| Anticipation | WIT | The time needed to implement an anticipated workaround for a disturbance. |
| Anticipation | WMTTL | The period during which a workaround perform normally. |
Regarding recovery, the following metrics can be listed [23]:
- Recovery Point Objective (RPO) describes the period of time in which data must be restored after a disruption.
- Recovery Time Objective (RTO) is the period during which the system must recover.
- Mean Down Time (MDT) is the mean time that a system is not operational.
- Recovery time, which is the time it takes for a process to return to normal operation after a failure is occurred. It is shown in a research work about the relationship between recovery and resilience that the recovery time depends on, among others, the resilience of the system and the scale of the perturbation [24]. It is considered also as the period within which it takes a system to return to a stable state [25]. This metric is chosen as one of the parameters used to define the process criticality.
As for anticipation, the notion of “workaround” is addressed. It may be defined, according to the Cambridge Dictionary, as “a way of dealing with a problem or making something work despite the problem, without completely solving it”. In other words, it is an alternative solution, which allows continuing the operation in short term. For instance, we can define, as workaround, for raw material shortage, borrowing from the stock of another plant. In terms of indicators, Workaround Implementation Time (WIT) and Workaround Maximum Tolerable Time Length (WMTTL) are selected. WIT is the amount of time it takes to implement an anticipated workaround for the present situation, and WMTTL is the absolute maximum length of time for which an implemented workaround can be maintained.
The featured indicators are presented in the table 1.
3. 3R process
The 3R process is a novel method and an instrument for decision-making aimed at assessing the resilience of sociotechnical systems processes. This process is built on three essential concepts: Resource, Risk, and Resilience, and is conducted in two stages, which are the definition of parameters and the resilience assessment. A model of the 3R process is proposed in figure 1.
This begins with the selection of a sociotechnical system process for which resilience will be assessed. Thereafter, the concerned resource is identified. This latter may fall under one of the following categories: (1) Infrastructures (Buildings, Racks, Dock lanes, Doors…), (2) Devices/Equipment (Pick-to-light, Conveyer Belt, Tape machine, Forklift…), (3) People (Management, Certified staff, External Human Resources…), (4) IT/Hardware (Computer, Printer, Server, Network…), (5) IT/Software (ERP, Local applications…), (6) Consumables (Box, Plastic film, Labels, Pallet…), (7) Utilities (Electricity, Water, Stream, Gas…). Then, a potential risk that threaten the selected resource is chosen. In general, there are six types of risks: (1) General resources (All risks directly impacting facilities and services (Supplier Bankrupt, Power outage…), (2) Internal staff (All events impacting human resources (Loss of key personnel, Strike, Epidemic…)), (3) IT (All incidents concerning data and IT resources availability (Virus, Hacking…)), (4) Natural disaster (All incidents with natural causes (Earthquake, flood, hurricane…)), (5) Regulation (All incidents impacting the authorization to make business (Lawsuit, Customs issue…), (6) Social (External) (All personal incidents external to the system (Riots, Terrorism, Bomb Threat )).
When this is done, the next step is to define parameters. The aim is to attribute values to the four indicators detailed in the previous section. For each one, time ranges should be defined and the process criticality level should be identified based on these intervals. As regards WIT and WMTTL, before proceeding with this exercise, the existence of workarounds should be checked, and if not found, workarounds must be put in place.
The criticality level helps determine the priority ranking of processes as per their potential risk of failures. In the present work, five process criticality levels are considered: (1) Very low, (2) Low, (3) Medium, (4) High, (5) Very high. An example of intervals for the selected indicators (MTPD, RT, WIT, and WMTTL) is given in the tables below.
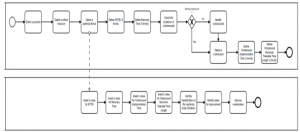
Figure 1: 3R process model
Table 2: The process criticality levels for MTPD
| Level | Process criticality | Description | Comment |
| 5 | Very high | MTPD < 4h | The risk of failure is very high since the process can carry on functioning only 4 hours during the disturbance before completely ceasing its activity. |
| 4 | High | 4h ≤ MTPD < 1 day | The risk of failure is high since the process can carry on functioning between 4 hours and 1 day during the disturbance before completely ceasing its activity. |
| 3 | Medium | 1 day ≤ MTPD < 3 days | The risk of failure is medium since the process can carry on functioning between 1 day and 3 days during the disturbance before completely ceasing its activity. |
| 2 | Low | 3 days ≤ MTPD < 5 days | The risk of failure is low since the process can carry on functioning between 3 and 5 days during the disturbance before completely ceasing its activity. |
| 1 | Very low | 5 days ≤ MTPD < 1 week | The risk of failure is very low since the process can carry on functioning between 5 days and 1 week during the disturbance before completely ceasing its activity. This is a sufficient time for the process to recover. |
Table 3: The process criticality levels for RT
| Level | Process criticality | Description | Comment |
| 1 | Very low | RT < 1 day | The risk brought about by the disruption is very low since the process can recover in less than 1 day. |
| 2 | Low | 1 day ≤ RT < 3 days | The risk brought about by the disruption is low since the process can recover in a period of time between 1 day and 3 days. |
| 3 | Medium | 3 days ≤ RT < 5 days | The risk brought about by the disruption is medium since the process can only recover in a period of time between 3 and 5 days. |
| 4 | High | 5 days ≤ RT < 1 week | The risk brought about by the disruption is high since the process can only recover in a period of time between 5 and 7 days. |
| 5 | Very high | 1 week ≤ RT | The risk brought about by the disruption is very high since the process can only recover in more than 1 week. |
Table 4: The process criticality levels for WIT
| Level | Process criticality | Description | Comment |
| 1 | Very low | WIT < 1 day | The risk of failure is very low since the anticipated workaround can be implemented in less than 1 day. |
| 2 | Low | 1 day ≤ WIT < 3 days | The risk of failure is low since the anticipated workaround can be implemented in a period of time between 1 day and 3 days. |
| 3 | Medium | 3 days ≤ WIT < 5 days | The risk of failure is medium since the anticipated workaround can be implemented only in a period of time between 3 and 5 days. |
| 4 | High | 5 days ≤ WIT < 1 week | The risk of failure is high since the anticipated workaround can be implemented only in a period of time between 5 and 7 days. |
| 5 | Very high | 1 week ≤ WIT | The risk of failure is very high since the anticipated workaround can be implemented only in more than 1 week. |
Table 5: The process criticality levels for WMTTL
| Level | Process criticality | Description | Comment |
| 5 | Very high | WMTTL < 1 day | The risk of failure is very high since the anticipated workaround can be maintained only for less than 1 day. |
| 4 | High | 1 day ≤ WMTTL < 3 days | The risk of failure is high since the anticipated workaround can be maintained only for a period of time between 1 day and 3 days. |
| 3 | Medium | 3 days ≤ WMTTL < 5 days | The risk of failure is medium since the anticipated workaround can be maintained only for a period of time between 3and 5 days. |
| 2 | Low | 5 days ≤ WMTTL < 1 week | The risk of failure is low since the anticipated workaround can be maintained for a period of time between 5 and 7 days. |
| 1 | Very low | 1 week ≤ WMTTL | The risk of failure is very low since the anticipated workaround can be maintained for more than 1 week. |
Table 6: The process criticality levels for the selected indicators
| Criticality level | |||||
| Indicator | Very low | Low | Medium | High | Very high |
| MTPD (days) | [5 , 7[ | [3 , 5[ | [1 , 3[ | [1/6 , 1[ | [0 , 1/6[ |
| RT (days) | [0 , 1[ | [1 , 3[ | [3 , 5[ | [5 , 7[ | [7 , +∞[ |
| WIT (days) | [0 , 1[ | [1 , 3[ | [3 , 5[ | [5 , 7[ | [7 , +∞[ |
| WMTTL (days) | [7 , +∞[ | [5 , 7[ | [3 , 5[ | [1 , 3[ | [0 , 1[ |
Table 7: Definition of parameters: Example of application
| Action | Description |
| Select a process | Quality Control. It includes :
– Raw material control – Finished goods and components control – Microbiology control |
| Select a resource | The critical resources for this process are:
– Infrastructure: Light, air conditioning, fume hood, microlab, raw material sampling booth… – Equipment: Component control equipment, finished goods and packaging control equipment, raw material and assay control equipment, micro control equipment… – People: raw material and assay control: Basic chemical knowledge, micro control: micro knowledge. |
| Select a threat | The potential threats for this process are:
Lab unavailable, reagent supply shortage, scanners or printers unavailable, more than half of the team missing, equipment unavailable… |
| Define MTPD (Five levels) | Cf. Table 6 |
| Define recovery time (Five levels) | Cf. Table 6 |
| Check the existence of workarounds | If No àIdentify workarounds
If Yes àSelect a workaround |
| Identify workarounds | –Lab unavailableàExternalization of quality control to another plant.
– More than half of the team missingàBorrow people from production department. – Reagent supply shortage àBorrow from another plant. – Equipment unavailableàDelegate part of the activity to another plant. |
| Select a workaround | Select one of the workarounds already identified |
| Define WIT (Five levels) | Cf. Table 6 |
| Define WMTTL (Five levels) | Cf. Table 6 |
The process criticality levels for the four selected metrics are gathered in table 6 (1/6 day stands for 4 hours)
An example of application of the first part of the 3R process model is given in the process analysis template hereafter (table 7).
The second and most important step of the 3R process model is “resilience assessment”. Its aim is to explain how to rate sociotechnical system processes on the resilience scale. In figure 1, it can be noticed that this part consists in determining inputs in order to obtain the echelon at the output. This will help the process identify the areas for improvement and afterwards overcome weaknesses.
In order to design the 3R process model, fuzzy logic will be used. This is an approach of data mining, which enables the modelling of a decision process in a situation of uncertain reasoning or incomplete information [26]. A fuzzy inference system (FIS) is defined as a system that uses fuzzy membership functions to make a decision [27]. In our case, Mamdani approach is adopted. This is a nonlinear mapping process on the base of fuzzy logic, which involves three components: fuzzification, inference rules, and defuzzification. The proposed fuzzy model is implemented using the programming language python, which is versatile and easy to use with a large and rich library.
The first step in the fuzzy model is to import scikit-fuzzy, which is a fuzzy logic Python package, using the following code block:
| import numpy as np | |||
| import skfuzzy as fuzz | |||
| from skfuzzy import control as ctrl | |||
Afterwards, the inputs (MTPD, Recovery time (RT), Workaround implementation time (WIT), Workaround maximum tolerable time length (WMTTL)) and the output (Echelon) should be defined. Values included between 0 and 8 for the inputs according to Table 6, and 0 and 5 for the output according to the resilience scale (5 echelons (0, 1, 2, 3 and 4)). The code portion is inserted hereunder:
| MTPD = ctrl.Antecedent (np.arange (8), ‘MTPD’) | |||
| WIT = ctrl.Antecedent (np.arange (8), ‘WIT’) | |||
| WMTTL = ctrl.Antecedent (np.arange (8), ‘WMTTL’) | |||
| RT = ctrl.Antecedent (np.arange (8), ‘RT’)
Echelon = ctrl.Consequent (np.arange (0, 5, 1), ‘echelon’) |
|||
Next, auto-membership function should be populated (Five intervals). Membership functions are used in fuzzy systems to represent input values. The code snippet is added below:
| MTPD.automf (5) | |||
| WIT.automf (5) | |||
| WMTTL.automf (5) | |||
| RT.automf (5) | |||
Then, membership functions are built based on resilience scale and table 6. Our choice was to go with the triangular membership functions (trimf) that are frequently used in many applications of fuzzy sets owing to their simplicity and which are suitable in this case (because they are defined by a lower limit a, an upper limit b, and a value m, where a < m < b) [28], [29]. The functions are shown hereafter
| Echelon[‘Unconscious’] = fuzz.trimf(Echelon.universe, [0, 0, 1]) | |||
| Echelon[‘Informed’] = fuzz.trimf(Echelon.universe, [1, 1, 2]) | |||
| Echelon[‘Aspiring’] = fuzz.trimf(Echelon.universe, [2, 2, 3]) | |||
| Echelon[‘Progressing’] = fuzz.trimf(Echelon.universe, [3, 3, 4]) | |||
| Echelon[‘Expert’] = fuzz.trimf(Echelon.universe, [4, 4, 5]) | |||
| MTPD[‘Very high’] = fuzz.trimf(MTPD.universe, [0, 0, 0.16]) | |||
| MTPD[‘High’] = fuzz.trimf(MTPD.universe, [0.16, 0.16, 1]) | |||
| MTPD[‘Medium’] = fuzz.trimf(MTPD.universe, [1, 3, 3]) | |||
| MTPD[‘Low’] = fuzz.trimf(MTPD.universe, [3, 5, 5]) | |||
| MTPD[‘Very low’] = fuzz.trimf(MTPD.universe, [5, 7, 7]) | |||
| WIT[‘Very low’] = fuzz.trimf(WIT.universe, [0, 0, 1]) | |||
| WIT[‘Low’] = fuzz.trimf(WIT.universe, [1, 1, 3]) | |||
| WIT[‘Medium’] = fuzz.trimf(WIT.universe, [3, 3, 5]) | |||
| WIT[‘High’] = fuzz.trimf(WIT.universe, [5, 5, 7]) | |||
| WIT[‘Very high’] = fuzz.trimf(WIT.universe, [7, 7, 8]) | |||
| WMTTL[‘Very high’] = fuzz.trimf(WMTTL.universe, [0, 0, 1]) | |||
| WMTTL[‘High’] = fuzz.trimf(WMTTL.universe, [1, 1, 3]) | |||
| WMTTL[‘Medium’] = fuzz.trimf(WMTTL.universe, [3, 3, 5]) | |||
| WMTTL[‘Low’] = fuzz.trimf(WMTTL.universe, [5, 5, 7]) | |||
| WMTTL[‘Very low’] = fuzz.trimf(WMTTL.universe, [7, 7, 8]) | |||
| RT[‘Very low’] = fuzz.trimf(RT.universe, [0, 0, 1]) | |||
| RT[‘Low’] = fuzz.trimf(RT.universe, [1, 1, 3]) | |||
| RT[‘Medium’] = fuzz.trimf(RT.universe, [3, 3, 5]) | |||
| RT[‘High’] = fuzz.trimf(RT.universe, [5, 5, 7]) | |||
| RT[‘Very high’] = fuzz.trimf(RT.universe, [7, 7, 8]) | |||
Thereafter, fuzzy rules are defined in order to express pieces of knowledge. Given the large number of identified rules, a few examples are provided in the table hereunder:
Table 8: Examples of Fuzzy rules
| Example 1 | ||||||||||||||||||||||
| MTPD = Very low & RT = Very low | ||||||||||||||||||||||
| Echelon | WIT | |||||||||||||||||||||
| Very low | Low | Medium | High | Very high | ||||||||||||||||||
| WMTTL | Very low | Expert | Expert | Expert | Progressing | Progressing | ||||||||||||||||
| Low | Expert | Expert | Expert | Progressing | Progressing | |||||||||||||||||
| Medium | Expert | Expert | Progressing | Progressing | Progressing | |||||||||||||||||
| High | Progressing | Progressing | Progressing | Progressing | Progressing | |||||||||||||||||
| Very high | Progressing | Progressing | Progressing | Progressing | Progressing | |||||||||||||||||
| Example 2 | ||||||||||||||||||||||
| MTPD = Very low & RT = High | ||||||||||||||||||||||
| Echelon | WIT | |||||||||||||||||||||
| Very low | Low | Medium | High | Very high | ||||||||||||||||||
| WMTTL | Very low | Progressing | Aspiring | Aspiring | Aspiring | Aspiring | ||||||||||||||||
| Low | Aspiring | Aspiring | Aspiring | Aspiring | Aspiring | |||||||||||||||||
| Medium | Aspiring | Aspiring | Aspiring | Aspiring | Aspiring | |||||||||||||||||
| High | Aspiring | Aspiring | Aspiring | Aspiring | Aspiring | |||||||||||||||||
| Very high | Aspiring | Aspiring | Aspiring | Aspiring | Aspiring | |||||||||||||||||
| Example 3 | ||||||||||||||||||||||
| MTPD = High & RT = High | ||||||||||||||||||||||
| Echelon | WIT | |||||||||||||||||||||
| Very low | Low | Medium | High | Very high | ||||||||||||||||||
|
WMTTL |
Very low | Informed | Informed | Informed | Informed | Informed | ||||||||||||||||
| Low | Informed | Informed | Informed | Informed | Informed | |||||||||||||||||
| Medium | Informed | Informed | Informed | Informed | Informed | |||||||||||||||||
| High | Informed | Informed | Informed | Unconscious | Unconscious | |||||||||||||||||
| Very high | Informed | Informed | Informed | Unconscious | Unconscious | |||||||||||||||||
Table 9: Values of inputs
| Indicator | Value | Level | Interpretation |
| MTPD | 3 | Medium | The process can resist for 3 days before failing to function. Then, its criticality is medium. |
| WIT | 5 | High | It takes 5 days to implement the anticipated workaround. This is a long response time to the perturbation. |
| WMTTL | 1 | High | The implemented workaround can remain operational for one day, which is not sufficient. |
| RT | 7 | Very high | The process can reach its normal functioning within 7 days. This means that the duration of the disturbance lasts for a long time. |
In example 1, MTPD and RT are very low, which means that the two first missions of resilience process (resistance and recovery) are perfectly fulfilled. It remains to be seen if the last mission (anticipation) is also fully accomplished or not. Accordingly, the output (Echelon) will oscillate between progressing and expert.
In example 2, the RT decreases, which conveys a much-needed effort to enhance recovery, and thus the process climbs down in the resilience scale from progressing to aspiring. It cannot be informed or unconscious because the resilience process is already set up with at least one mission that really holds water (resistance).
Regarding the last example, MTPD and RT are high, which is to say that resistance and recovery of the process are weak. Therefore, depending on the performance of anticipation, the echelon varies between informed and unconscious.
Subsequently, a control system (a nonlinear Single Input-Single Output (SISO) discrete-time process based on a set of rules [30]) is created using the code block hereunder
| resiliencescale_ctrl = ctrl.ControlSystem ([rule1, rule2,…, rule n]) | |||
Later, this control system is simulated through specifying the inputs. The table hereafter gathers the values attributed to the four indicators in the present example.
| resiliencescale.input [‘MTPD’] = 3 | |||
| resiliencescale.input [‘WIT’] = 5 | |||
| resiliencescale.input [‘WMTTL’] = 1 | |||
| resiliencescale.input [‘RT’] = 7
resiliencescale.compute () |
|||
Finally, simulation results is visualized (cf. Code blow& figure 2)
| print (resiliencescale.output[‘echelon’])
Echelon.view(sim=resiliencescale) |
|||
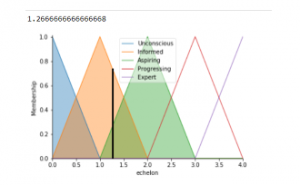
Figure 2: Simulation results
According to the plot above, the resilience echelon is about 1.27. That is to say, by referring to the resilience scale, the process
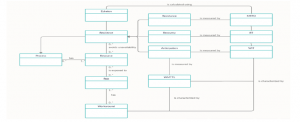
Figure 3: A conceptual metamodel representing the 3R process
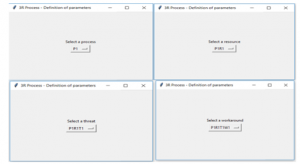
Figure 4: Definition of parameters – User interfaces
under study is informed. It is poorly developed with regard to resilience. An associated resilience process must be set up in order to enhance its resilience. The aim is to improve:
- the resistance of the process and its resource to the disruption through increasing the MTPD
- the recovery through the reduction of the recovery time (RT)
- the anticipation through putting in place well elaborate workarounds, reducing WIT and increasing WMTTL for each workaround.
In order to make this model usable for sociotechnical systems and a core part of their processes, a user interface should be designed. For this purpose, a model is elaborated using UML language (Cf. figure 3).
As can be seen, the metamodel illustrated by figure 3 formulates the following points:
- A process has one or more resources.
- A resource is exposed to one or more risks.
- A risk can have one or several identified workarounds. It may also have no created workarounds.
- There are processes called resilience processes.
- The existence of resilience processes in the sociotechnical systems help avoiding unavailability of resources.
- An echelon (Resilience score) is attributed to each process of the sociotechnical system based on the existence of associated resilience processes.
- The missions of resilience processes are resistance, recovery and anticipation.
- Resistance is measured using MTPD.
- Recovery is measured using RT.
- Anticipation is measured using WIT and WMTTL. These two indicators characterize workarounds.
- The echelon is calculated through MTPD, RT, WIT and WMTTL.
Firstly, the database should be populated with the list of all the processes in a sociotechnical system. Then, for each process, the critical resources should be identified. After this, the potential threats should be presented for each resource. Next, the verification should be carried out, for each risk, to ensure that anticipated workarounds are available. If this is not the case, workarounds should be developed to compensate for the lack. Thereafter, criticality levels (Very high, high, Medium, Low, Very low) should be determined for MTPD, RT, WIT and WMTTL.
In the second place, the parameters can be defined via the user interfaces dedicated for this purpose and which are developed using the framework Tkinter of Python (cf. figure 4)
Then, based on the chosen criteria, the resilience of the selected process can be assessed. Figure 5 illustrates that values of the indicators MTPD, RT, WIT and WMTTL should be inserted to get the resilience score of the process.
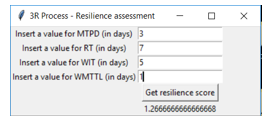
Figure 5. User interface corresponding to resilience assessment
It is clear that for the selected combination ((Process(P1), Resource(P1R1), Threat (P1R1T1), Workaround (P1R1T1W1)), the resilience score is 1.27. That is to say, according to the resilience scale, the process P1 is informed and there is no elaborated resilience process associated with it. The first thing to be done is to try to enhance the resistance of the process/resource to the risk P1R1T1 through increasing the MTPD in order to avoid the activity interruption and at the same time attempt to recover more quickly. Furthermore, the workaround implementation time should be sharply reduced and the functioning of the workaround P1R1T1W1 should last longer at least until recovery.
On the basis of the given example, the 3R process can be considered as a decision-making tool that helps sociotechnical systems assess their processes as per resilience and hence identify improvement opportunities with the aim of building a system capable of weathering the continuing uncertainty surrounding business environment nowadays.
4. A real case company example – COVID-19 context
COVID-19 is having an unprecedented impact on sociotechnical systems (societies, companies…) and people’s livesand will continue to do so into the foreseeable future. Since the first day, the selected company, which is one of the largest and best-known enterprises operating in the cosmetics sector, has been working on the COVID-19 outbreak in order to ensure its employees’ safety. Country by country as well as globally, the evolution of the situation has been carefully monitored and decisive measures to limit everyone’s risk to exposure have been taken. In order to evaluate the resilience of the company processes against this worldwide crisis, the 3R process method will be applied.
First, the physical distribution process (PDP) is chosen as an example. It is a part of the supply chain organization. Its aim is to ensure that the service to the consumer required by the business is met at the best possible costs by optimizing the inbound (reception and returns), internal (putaway and replenishment) and outbound (order preparation and shipping) physical flows whilst guaranteeing quality and safety in a sustainable environment. The table below summarizes all the crisis phases that the PDP has passed through.
Table 10: PDP behavior during pandemic phases
| Crisis step | Events / Country decisions | Supply Chain Impact | PDP Impact | Risk | Workaround |
| Before outbreak | Pre epidemic decisions | Localize Goods close to the market | Increase pallets to Customer & International Affiliates | Storage saturation | Increase storage capacity (internal or external) |
| Before outbreak | Pre epidemic decisions | Business Continuity Plans (BCP) & Secondary backup Distribution Center (DC) | Secondary DC carry additional stock | Storage Saturations/Unable to move product systematically | Work with IT to prioritize Storage location creation needed and Catalog extension; Identify key 3PLs that can support pop-up DCs where needed |
| Before outbreak & Outbreak phase | Epidemic decisions | Lead-time increase | Transport capacity | Lack of carriers and freight-forwarders capacity | Give to suppliers mid-term visibility in order to book slots and capacity + alert Transportation Team if no positive answer from freight-forwarders |
| Before outbreak & Outbreak phase | Epidemic decisions | Costs increase | Transportation costs increase | Spot extra charges for airfreight but also risk on road and sea freight | Inform Transportation Team about requests from freight-forwarders especially for intercontinental flows (sea freight, rail freight & airfreight) |
| Outbreak phase | Shops closing by authorities without proper anticipation /
Population confined at home |
Order delivery not possible as shops are closed | Unusual amount of parcels returns to DCs: Cancellation of orders that could’ve begun picking | Return area capacity saturation
unable to manage the flow |
Define in advance how to manage this unusual return flow: resize return area / outsource? |
| Outbreak phase | Shops closing by authorities without proper anticipation /
Population confined at home |
Customer orders in portfolio not relevant. | Unusual amount of parcels returns to DCs | Useless workload in picking
Return area capacity saturation |
Verify if customer can still receive goods / reprocessing order portfolio (cancel useless orders) |
| Outbreak phase | Shops closing by authorities without proper anticipation /
Population confined at home |
Massive slowdown of order and still inbound flows to come | Increase of pallets to store | storage saturation/”lack of work” for labor on-site | Increase storage capacity (internal or external) Release time while communicating retention bonus plan for future Reduce shift hours throughout day |
| Outbreak phase | Shops closing by authorities without proper anticipation /
Population confined at home |
Online orders booming | Increase of e-commerce orders | Capacity (preparation and delivery) | Labor share where sites are in close proximity
Work through weekends |
| Outbreak phase | School closing | Part of employee obliged to stay at home to baby-sit the children | Part of employee in home office / not working (if home office not feasible) | Capability reduction | Identify what are the key processes, the key customers that have to be prioritized: Set-up daycare alternative & reimbursement : alternate shift schedules |
| Outbreak phase | Health and Safety instructions | Temperature measurement before entering for all employees => delays in workers’ access to the DC | Capability reduction | Several simultaneous controls or with thermal camera
Verify temperature measurement system data privacy compliancy |
|
| Outbreak phase | Health and Safety instructions | Disable fingerprint access control | Less access control | Replaced by personal cards | |
| Outbreak phase | Health and Safety instructions | Flexibility or workforce reduction to lower people concentration.
Keep a minimum distance of 1 m from other operators. Canteen flow regulation. |
Capability reduction | Extra hours/ Extra shifts | |
| Outbreak phase | Health and Safety instructions | A Covid-19 case confirmed for a DC employee | Capability reduction | Identify what are the key processes, the key customers that have to be prioritized; Shutdown area for 3 hours, neighborhood survey & sanitize area;
If site is shutdown, go to secondary DC; Have approved sanitation suppliers confirmed for cleaning support |
|
| Outbreak phase | 3PL crisis management | Ensure 3PLs follow Health and Safety instructions and have a strong crisis management internally | capability reduction / lock down due to inappropriate actions | Ask 3PL to present measures activated and BCP action plan | |
| Outbreak phase | Stop of none essential activity / epidemic situation in the DC | DC Lock down | Stock not available and shipping stopped | Define heroes products
Map heroes products stocks positions worldwide Map twins heroes products worldwide Prepare process to use these twins products |
|
| Outbreak phase | DC closed due to government regulation | DC Lock down | Stock not available and shipping stopped | Unable to load products | Prepare list of key SKUs; Preload trailers where items have sufficient coverage based on risk of local government shutdown |
| Restart period | confine constraints removal | Orders pic | Huge activity at restart | Unable to meet demand | Prepare additional locations for preparation; Offer retention bonus for temporary employees based on seniority |
As mentioned previously, the first step of the 3R process method is the definition of parameters. For such needs, the human factor is picked up as a resource. Then, the threat chosen, based on the table above, is capability reduction due to school closing. Finally, the workaround selected is alternating shift schedules. As per the four indicators, they are determined as follows (table 11)
Table 11: The four indicators time ranges for PDP
| MTPD | |||
| Level | Process criticality | Description | Comment |
| 5 | Very high | MTPD < 1 month | The risk of failure is very high since the PDP can handle the capability reduction only for less than 1 month before completely ceasing its activity. |
| 4 | High | 1 month ≤ MTPD < 3 months | The risk of failure is high since the PDP can handle the capability reduction only for a period of time between 1 month and 3 months before completely ceasing its activity. |
| 3 | Medium | 3 months ≤ MTPD < 5 months | The risk of failure is medium since the PDP can handle the capability reduction only for a period of time between 3 and 5 months before completely ceasing its activity. |
| 2 | Low | 5 months ≤ MTPD < 9 months | The risk of failure is low since the PDP can handle the capability reduction for a period of time between 5 and 9 months before completely ceasing its activity. |
| 1 | Very low | MTPD ≥ 9 months | The risk of failure is very low since the PDP can handle the capability reduction for more than 9 months before completely ceasing its activity. This is a sufficient time for the process to recover. |
| RT | |||
| Level | Process criticality | Description | Comment |
| 1 | Very low | RT < 1 month | The risk brought about by the disruption is very low since the process can recover in less than 1 month. |
| 2 | Low | 1 month ≤ RT < 3 months | The risk brought about by the disruption is low since the process can recover in a period of time between 1 month and 3 months. |
| 3 | Medium | 3 months ≤ RT < 5 months | The risk brought about by the disruption is medium since the process can only recover in a period of time between 3 and 5 months. |
| 4 | High | 5 months ≤ RT < 12 months | The risk brought about by the disruption is high since the process can only recover in a period of time between 5 and 12 months. |
| 5 | Very high | 1 year ≤ RT | The risk brought about by the disruption is very high since the process can only recover in more than 1 year. |
| WIT | |||
| Level | Process criticality | Description | Comment |
| 1 | Very low | WIT < 1 month | The risk of failure is very low since the anticipated workaround can be implemented in less than 1 month. |
| 2 | Low | 1 month ≤ WIT < 3 months | The risk of failure is low since the anticipated workaround can be implemented in a period of time between 1 month and 3 months. |
| 3 | Medium | 3 months ≤ WIT < 5 months | The risk of failure is medium since the anticipated workaround can be implemented only in a period of time between 3 and 5 months. |
| 4 | High | 5 days ≤ WIT < 9 months | The risk of failure is high since the anticipated workaround can be implemented only in a period of time between 5 and 9 months. |
| 5 | Very high | 9 months ≤ WIT | The risk of failure is very high since the anticipated workaround can be implemented only in more than 9 months. |
| WMTTL | |||
| Level | Process criticality | Description | Comment |
| 5 | Very high | WMTTL < 1 month | The risk of failure is very high since the anticipated workaround can be maintained only for less than 1 month. |
| 4 | High | 1 month ≤ WMTTL < 3 months | The risk of failure is high since the anticipated workaround can be maintained only for a period of time between 1 month and 3 months. |
| 3 | Medium | 3 months ≤ WMTTL < 5 months | The risk of failure is medium since the anticipated workaround can be maintained only for a period of time between 3 and 5 months. |
| 2 | Low | 5 months ≤ WMTTL < 9 months | The risk of failure is low since the anticipated workaround can be maintained for a period of time between 5 and 9 months. |
| 1 | Very low | 9 months ≤ WMTTL | The risk of failure is very low since the anticipated workaround can be maintained for more than 9 months. |
Afterwards, the second step, which is the resilience assessment, should be initiated. Therefore, the inputs are specified in the table below.
Table 12: Specification of inputs
| Input | Value (in months) | PDP criticality level |
| MTPD | 12 | Very low |
| RT | Uncertain (Given the fact that there is no visibility concerning the termination of the crisis). For calculation purposes, 12 is taken as value. | Very high |
| WIT | 4 | Medium |
| WMTTL | 8 | Low |
By using the 3R process tool, the plot below (figure 6) is obtained.
By inference, the physical distribution process is aspiring. In fact, the Novel Coronavirus outbreak has some particularities that differentiate it from other disruptions. As a result, the corresponding resilience process is not yet completely set up. The resistance mission is functioning very well and the anticipation mission is under development. However, the recovery mission is still very ambiguous.
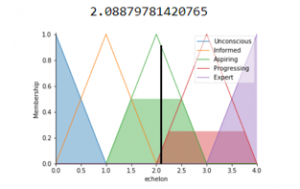
Figure 6: Simulation results for PDP
5. Conclusion
The presented work pointed out a method that can be used by sociotechnical systems to evaluate the resilience of their processes. First and foremost, the resilience scale with its five echelons (0. Unconscious, 1. Informed, 2. Aspired, 3. Progressing, 4. Expert) and three missions (resistance, recovery and anticipation) was introduced. Then, indicators related to these missions have been outlined (MTPD for resistance, RT for recovery, WIT and WMTTL for anticipation). Afterwards, the 3R process was detailed. The 3Rs stand for Resource, Risk and Resilience. This framework is divided into two parts, the first one is the definition of parameters, which consists in determining process criticality levels according on the four selected indicators. Time ranges are defined for the metrics and for each process, critical resources, potential risks and anticipated workarounds are selected and resilience is evaluated for all possible combinations. As for the second part, it is about the resilience assessment. In order to calculate the resilience score (echelon) and rank the process on the resilience scale, fuzzy logic has been used. A fuzzy model has been elaborated and user interfaces have been developed in order to enable decision makers to evaluate their systems and build their resilience. In short, the major advantages of this process are summarized as follows. First, this is a generic method that can apply to any system and help it to define the key indicators, related to resistance (MTPD), recovery (RT) and anticipation (WIT and WMTTL): the three functions of a resilience process, and identify plausible workarounds. Second, it provides a resilience score and a rating as per the resilience scale, which can be useful for detecting and improving weaknesses and also increasing strength and effectiveness to deal with adverse events. Finally, by applying fuzzy logic in the 3R process, the vagueness and uncertainty faced can be overcome. In the last section, a study has been conducted to look at the impact of the COVID19 sanitary crisis on a real case company example and how resilience plays a crucial role in preventing the worst from happening and resuming gradually the normal course of events. In fact, the exposed real case study shows that the pandemic situation has negatively affected the functioning of the studied process. In the aftermath, the process works on improving its resilience, especially, the recovery mission. In the future work, attempts will be made to establish new methods serving to evaluate the resilience of sociotechnical system processes and enhance it.
Conflict of Interest
The authors declare no conflict of interest.
- G. Fischer, T. Herrmann, “Socio-Technical Systems”, International Journal of Sociotechnology and Knowledge Development, 3(1), 1-33, 2011, doi:10.4018/jskd.2011010101
- Nokia reports fourth-quarter 2004 net sales of EUR 9.1 billion, EPS EUR 0.23. (2005, January 27). Retrieved from https://www.nokia.com/system/files/files/q4-2004-earnings-release-pdf.pdf
- C. G. Worley, E. E. Lawler, T. Williams, “The agility factor: Building adaptable organizations for superior performance”, San Francisco, CA: Jossey-Bass, 2014.
- S. A. Argyroudis, S. A. Mitoulis, L. Hofer, M. A. Zanini, E. Tubaldi, D. M. Frangopol, “Resilience assessment framework for critical infrastructure in a multi-hazard environment: Case study on transport assets”, Science of The Total Environment, 714, 2020, 136854, doi:10.1016/j.scitotenv.2020.136854
- D. Rehak, P. Senovsky, M. Hromada, T. Lovecek, “Complex approach to assessing resilience of critical infrastructure elements”, International Journal of Critical Infrastructure Protection, 25, 125–138, 2019, doi: 10.1016/j.ijcip.2019.03.003
- J. Vargas, D. González, “Model to assess supply chain resilience”, International Journal of Safety and Security Engineering, 6(2), 282–292, 2016, doi: 10.2495/safe-v6-n2-282-292
- A. K. Ravulakollu, L. Urciuoli, B. Rukanova, Y.-H. Tan, R. A. Hakvoort, “Risk based framework for assessing resilience in a complex multi-actor supply chain domain”, Supply Chain Forum: An International Journal, 19(4), 266–281, 2018, doi: 10.1080/16258312.2018.1540913
- O. Kammouh, A. Z. Noori, G. P. Cimellaro, S. A. Mahin, “Resilience Assessment of Urban Communities”, ASCE-ASME Journal of Risk and Uncertainty in Engineering Systems, Part A: Civil Engineering, 5(1), 2019, 04019002, doi: 10.1061/ajrua6.0001004
- M. M. Sellberg, C. Wilkinson, G. D. Peterson, “Resilience assessment: a useful approach to navigate urban sustainability challenges”, Ecology and Society, 20(1), 2015, doi: 10.5751/es-07258-200143
- A. C. Caputo, P. M. Pelagagge, P. Salini, “A methodology to estimate resilience of manufacturing plants”, IFAC-PapersOnLine, 52(13), 808–813, 2019, doi: 10.1016/j.ifacol.2019.11.229
- J. T. Kim, J. Park, J. Kim, P. H. Seong, “Development of a quantitative resilience model for nuclear power plants”, Annals of Nuclear Energy, 122, 175–184, 2018, doi: 10.1016/j.anucene.2018.08.042
- N. Ahmadian, G. J. Lim, J. Cho, S. Bora, “A Quantitative Approach for Assessment and Improvement of Network Resilience”, Reliability Engineering & System Safety, 200, 106977, 2020, doi: 10.1016/j.ress.2020.106977
- K. Adjetey-Bahun, B. Birregah, E. Châtelet, J.-L. Planchet, “A model to quantify the resilience of mass railway transportation systems”, Reliability Engineering & System Safety, 153, 1–14, 2016, doi: 10.1016/j.ress.2016.03.015
- S. Said, H. Bouloiz, M. Gallab, “A new structure of sociotechnical system processes using resilience engineering”, International Journal of Engineering Business Management, 11, 2019, 184797901982715, doi: 10.1177/1847979019827151
- V. Cornescu, R. Adam, “Considerations Regarding the Role of Indicators Used in the Analysis and Assessment of Sustainable Development in the E.U”, Procedia Economics and Finance, 8, 10–16, 2014, doi: 10.1016/s2212-5671(14)00056-2
- V. Llamas, T. Coudert, L. Geneste, J. Romero-Bejarano, A. de Valroger, “Proposition of an agile knowledge-based process model”, IFAC-PapersOnLine, 49(12),1092-1097, 2016.
- D. Ristic, “A TOOL FOR RISK ASSESSMENT”, Safety Engineering, 3(3), 2013.
- O. Gluchshenko, “Defnitions of Disturbance, Resilience and Robustness in ATM Context” DLR Report IB 112-2012/28, DLR,Institute of Flight Guidance, Germany, 2012.
- S. Said, H. Bouloiz, M. Gallab, “Resilience Engineering: A Restructuring Of Processes Toward The Building Of Resilient Sociotechnical Systems” in 2019 4th World Conference on Complex Systems (WCCS), doi: 10.1109/icocs.2019.8930797
- ENISA, “Measurement Frameworks and Metrics for Resilient Networks and Services: Technical report”, 2011. Retrieved from https://www.enisa.europa.eu/publications/metrics-tech-report/at_download/fullReport
- E. Zambon, D. Bolzoni, S. Etalle, M. Salvato, “A Model Supporting Business Continuity Auditing and Planning in Information Systems” in Second International Conference on Internet Monitoring and Protection (ICIMP 2007), doi:10.1109/icimp.2007.4
- S. A. Torabi, R. Giahi, N. Sahebjamnia, “An enhanced risk assessment framework for business continuity management systems”, Safety Science, 89, 201-218, 2016, doi:10.1016/j.ssci.2016.06.015
- M. Wiboonrat, K. Kosavisutte, “Optimization strategy for disaster recovery” in 4th IEEE International Conference on Management of Innovation and Technology, 2008, doi:10.1109/icmit.2008.4654446
- I. A. Leemput, V. Dakos, M. Scheffer, E. H. Nes, “Slow Recovery from Local Disturbances as an Indicator for Loss of Ecosystem Resilience”, Ecosystems, 21(1), 141-152, 2017, doi:10.1007/s10021-017-0154-8
- Z. Fu, D. Li, O. Hararuk, C. Schwalm, Y. Luo, L. Yan, S. Niu, “Recovery time and state change of terrestrial carbon cycle after disturbance”, Environmental Research Letters, 12(10), 2017, 104004, doi:10.1088/1748-9326/aa8a5c
- N. H. Chan, H. Y. Wong, “Data mining of resilience indicators”, IIE Transactions, 39(6), 617–627, 2007, doi: 10.1080/07408170600899565
- A. Hossain, A. Rahman, “Sensor-Controlled Intelligent Vehicle Systems: Demand and Needs for a Global Automotive Landscape”, Comprehensive Materials Processing, 473–497, 2014, doi:10.1016/b978-0-08-096532-1.01321-2.
- J. Zhao, B. Bose, “Evaluation of membership functions for fuzzy logic controlled induction motor drive” in IEEE 2002 28th Annual Conference of the Industrial Electronics Society, IECON 02, 2002, doi:10.1109/iecon.2002.1187512
- B. M. Moreno-Cabezali, J. M. Fernandez-Crehuet, “Application of a fuzzy-logic based model for risk assessment in additive manufacturing R&D projects”, Computers & Industrial Engineering, 145, 106529, 2020, doi:10.1016/j.cie.2020.106529
- R.-E. Precup, M.-L. Tomescu, S. Preitl, E. M. Petriu, C.-A. Dragoş, “Stability Analysis of Fuzzy Logic Control Systems for a Class of Nonlinear SISO Discrete-Time Systems”, IFAC Proceedings Volumes, 44(1), 2011, 13612–13617, doi: 10.3182/20110828-6-it-1002.00937