Strategic Model to Assess the Sustainability and Competitiveness of Focal Agri-Food Smes and their Supply Chains: A Vision Beyond COVID 19

Adv. Sci. Technol. Eng. Syst. J. 5(5), 1214–1224 (2020);
 DOI: 10.25046/aj0505147
There have been disruptions in local and global food supply chains around the world due to the COVID-19 pandemic. It has led to rethink various aspects and to consider various trends in the food sector, encourage a more rapid transition and evolution to the Sustainable Supply Chain Management (SSCM), to counteract current problems and to help towards a more sustainable and competitive vision. However, there is a strategic disconnection in SSCM between sustainability and strategies related to competitive advantage. Therefore, the objective of this research is to propose a decision-making model to assess the sustainability and competitiveness strategically of a Mexican agri-food focal SME (Small and Medium-sized Enterprise) that leads its supply chain. It is validated with comparative analysis in the productive taro activity through the Analytic Hierarchy Process (AHP) that contributes to prevent or to face problems such as the COVID-19 pandemic and climate change. This research is based on a case study methodology divided into four stages. Three presented alternatives are assessed and compared by thirty-five criteria: a) A current situation without sustainability, b) Cost leadership strategy considering sustainability, and c) Differentiation strategy considering sustainability. The conclusions indicate more feasibility and compatibility to achieve sustainability with a differentiation strategy than with a cost leadership strategy. The current crisis should lead us to think beyond COVID-19, as we have more challenges ahead, such as climate change, environmental impacts, poverty, among other aspects that could cause instability around the world. Therefore, the current situation should be an impetus to further progress towards the 17 Sustainable Development Goals, in this case, through the theory of SSCM. That is why this model contributes strategically to the SSCM, to develop greater long-term resilience in the Mexican agri-food focal SMEs and their supply chains.
1. Introduction
Currently, there are disruptions in both local and global food supply chains around the world due to the pandemic [1]-[3] caused by the new coronavirus [4], better known as COVID 19. It has led to thinking in various scientific fields and everyday life, as in the present manuscript, which contemplates the acceleration of various changes to move towards Sustainable Supply Chain Management (SSCM) and competitiveness, especially in the food sector. Some adversities that have placed Mexico as one of the countries at the most significant risk to COVID-19 are obesity and overweight [5], mainly caused by poor nutrition from ultra-processed foods [6].
Also, this pandemic has exposed social deficiencies in textile supply chains by the ease of firing employees who have been subcontracted, violating their labor rights [7]. Therefore, after COVID-19, there will be challenges, opportunities, and potential solutions in agri-food supply chains considering some sustainable aspects, among which climate change stands out [8]. A climate shock would place food supply chains in vulnerable circumstances, exacerbating poverty, food insecurity, and the impact on the environment [9] aspects considered by the SSCM.
However, there are few studies on SSCM, especially on its environmental and social aspects [10], [11]. There is little implementation of the SSCM theory in emerging economies [12], [13], as in Mexico [14]. The SSCM theory also has several theoretical gaps derived from the disconnection between sustainability and strategies related to competitive advantage, known as this combination as Sustainable Competitive Advantage (SCA). SCA is challenging to evaluate and measure since there is no factual theoretical basis [15]. The poor results of the implementation of sustainable strategies to improve competitiveness [16] make it difficult to introduce them into regular SSCM practice [17].
In emerging countries, the SSCM practices adoption does not necessarily imply improved cost performance or short-term profitability [18]. Likewise, a case was found where clients do not necessarily accept higher prices for acquiring sustainable products [17]. Therefore, the SSCM theory seems to be incompatible in some cases between the economic part and the social and environmental parts [17]. That is, if sustainability is considered together with Porter’s cost leadership strategy [19], there may not be compatible. Hence, this discordance is reflected in the supply chains of both large, and Small and Medium Enterprises (SMEs), with an even greater emphasis on emerging countries such as Mexico. As a result, decision making becomes a challenge at the strategic level in SSCM, since there are no well-established metrics, as pointed out in the literature review [20]. Therefore, the objective of the research is to propose a decision-making model to assess the sustainability and competitiveness strategically of a Mexican agri-food focal SME that leads its supply chain, validated with comparative analysis in the productive taro activity through the Analytic Hierarchy Process (AHP) that contributes to prevent or face problems such as the COVID-19 pandemic and climate change. It is expected that the results of the strategic model contribute with knowledge at a strategic level to the SSCM, in order to understand the generic strategies and their relationship with sustainability, demonstrating their possible compatibilities.
2. Literature review
2.1. Sustainable Supply Chain Management
Sustainability is a term derived from Sustainable Development, being an increasingly important instrument for economic growth. Sustainable Development is defined as [21]:
“A development that meets the needs of the present without compromising the ability of future generations to meet their own needs ” [21].
Sustainability must be taken into account in the design of supply chains [22]. Certain aspects of Supply Chain Management (SCM) are related to the environmental, social, and economic aspects of Sustainable Development, conceptualizing SSCM as [10]:
“The strategic, transparent integration and achievement of an organization’s social, environmental, and economic goals in the systemic coordination of key interorganizational business processes for improving the long-term economic performance of the individual company and its supply chains” [10].
That is why SSCM is based on long-term partnerships [23], even if these are difficult to achieve [24] and also costly [17]. Likewise, the level of interest in SSCM practices by companies or organizations is different and depends on what they are producing [25]. To replace SCM with SSCM, companies or organizations need both conventional performance criteria and sustainability requirements [11]. Besides, as it is known, both SCM and SSCM have three levels of planning; strategic planning, tactical planning, and operational planning [26], so when sustainability is integrated into SCM, it causes changes at each level, making strategic planning more relevant.
2.2. Sustainable Supply Chain Management and Competitiveness
On the one hand, there are no signs where competitiveness is strategically considered within the central SSCM literature reviews [20], [23]. On the other hand, the theory of Creating Shared Value (CSV) [27] from the theory of Competitive Advantage [19] does not consider sustainability in-depth, nor does it consider external pressures. However, it has happened that legal norms and sanctions applied (external pressures) to companies become the primary motivations for companies to implement SSCM initiatives [28], which contradicts the internal motivation of the companies [27]. Furthermore, CSV, a relatively new theory, focuses more on large companies, even multinationals, leaving considerable research opportunities in SMEs.
Hence, this research proposes a model for Mexican agri-food focal SMEs that integrates sustainable and competitive strategies within the SSCM theory. These strategies will be based on Porter’s two generic strategies [19]: 1) Cost leadership; consists of low costs and economies of scale, and 2) Differentiation; consists of being unique in some value need for clients. It is essential to clarify that it is challenging to achieve a low-cost and differentiation strategy simultaneously, although this does not mean that it is impossible [19].
2.3. Analytic Hierarchy Process and Supply Chains
The AHP is a general theory of measurement developed by Saaty in 1971-1975; this method is used to make a consistent measurement of physical and psychological events, giving them equal importance without sacrificing anything [29]. Therefore, the AHP is a technique for decision making where certain situations with ideas, feelings, and emotions are quantified, which affect the decision-making process, thus obtaining a numerical scale to prioritize the decision alternatives [30].
This tool has also been applied in various areas such as assessment of risk factors in agriculture [31]; natural resources management [32]; location of an SME [33]; benchmarking [34]; among others. According to the literature review [35], there are no applications of AHP for strategic decision-making in sustainable agri-food supply chain models.
2.4. The Sustainable Supply Chain and Mexican Agri-food SMEs
The percentage of SMEs in Mexico is 99.8%, contributing 34.7% to the Gross Domestic Product (GDP) and creating 73.8% of jobs [36], [37]. The productivity of SMEs is at a lower level than expected, so their entry into the international market and their permanence in the local or national market is difficult [37] due to changes in globalization. Therefore, in order to improve the SMEs, it is necessary to provide strategies that contribute to the current economic panorama, since there are companies where a conservative attitude persists, waiting to introduce structural changes [38].
The performance of focal companies in encouraging sustainable supply chains is vital because they drive and govern the supply chain [23]. There are few studies of Mexican agri-food focus companies that lead a sustainable supply chain [14]. It is normal since, SSCM theory is in an early stage of research [11]. However, some research has been found in the Mexican agri-food sector that includes only aspects of sustainability without considering supply chains, where they show how to develop sustainable enterprises through local networks of eco-farmers [39]. Likewise, the implications of fair trade and inclusion of local people in cooperatives or farmers’ associations, trying to connect producers directly with clients [40]. Other studies have a more theoretical scope, a model [41] and a methodological proposal [42], focusing on sustainable agri-food SMEs without considering supply chains. In other words, agribusinesses still individualize their efforts without realizing that they are part of a supply chain.
In Mexico, there are studies on Clean Production and SMEs that contribute to the theory of SSCM. These point out that SMEs mostly play the role of suppliers for large companies; that is, they are not leaders in supply chains, so they are not focal companies [43]- [46]. However, there are projects that try to include the local population in competitive businesses with environmental and social aspects [47], [48]. Nevertheless, according to a literature review in [14], all these attempts are still far from achieving sustainability [14].
2.5. The malanga (Colocasia esculenta) production
The malanga, taro or Colocasia esculenta, is a plant that is cultivated for its corms, which are used in human and animal food and has various industrial uses [49], [50].
There are several ways to transform malanga into food; regional nutritionists have even recommended it as a valuable food; however, more in-depth research is required [51]. One of the most remarkable ways to consume it is in the meal. The nutritional value that taro provides through a meal is highlighted in a study [52], where it is obtained that according to fiber fractions, the meal is an alternative for the elaboration of balanced foods.
The volume of national production in 2015 was 16,552,000 kilograms, equivalent to $66,364,000 national current pesos, and the price was 15,800 Mexican pesos per thousand kilograms [53]. The leading producers are in the states of Oaxaca, Tabasco, and Veracruz [54]. Mexican malanga production is used for self-consumption and is sold to the domestic market [54] and the United States and Canada [54], [55].
3. Methodology
Several research methods are used in SSCM theory, as SSCM is at an early stage, these methods are seen as a complement to others to gain diverse theoretical perspectives [11]. This study is mainly based on the case study methodology [56], to research a phenomenon in its context. It allows selecting and studying an economically successful Mexican agri-food focal SME within its productive activity to relate its situation to the theoretical gaps and thus propose a strategic decision-making model.
Three experts participate in the development of this methodology and model. They propose the following four methodological stages through Figure 1.
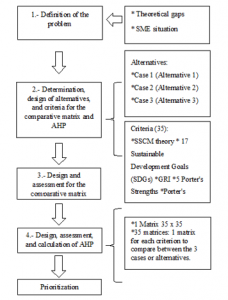
Figure 1: Methodological scheme.
Stage 1. Definition of the problem: It consists of creating a team of experts to know the essential characteristics of the company and to define the problem theoretically.
This research was carried out in a Mexican agri-food focal SME that leads its supply chain in the productive taro activity. This Veracruz-based company, the most economically successful one, is classified in Mexico as a medium-sized company by its number of employees [57], so it is also classified as an SME.
According to the information collected, this SME has been developed without any planning of strategies without considering competitive and sustainable strategies. The collaboration between the members of its supply chain is not ideal, so it is far from being a sustainable supply chain. This SME does not have a generic strategy, according to Porter’s positioning matrix [19]. However, this company involuntarily competes with low prices to perform its exports; it is based on a cost leadership strategy. Its competitive situation is threatened when other competitors replace taro with lower prices in the foreign market. For this reason, a model is designed to integrate strategies of competitiveness and sustainability, and then be assessed with the AHP.
Stage 2. Determination, design of alternatives, and criteria for the comparative matrix and AHP: It consists of identifying the alternatives and criteria used in the AHP methodology. In this stage, the participation of experts is essential to provide feedback and consensus on the alternatives and criteria used in strategic, competitive, sustainable, and SSCM issues.
Stage 3. Design and assessment for the comparative matrix: It is a based analysis process on the logic of the experts, to compare two or more cases, to assimilate their reciprocal differences so that the attributes or criteria for comparing the case studies are established in [58], [59]. In this research, the case studies are considered as alternatives. Each attribute or criterion is assigned a weight or percentage value and then a value from 1 to 5 (1. Very low, 2. Low, 3. Medium, 4. High, 5. Very high) between each case and each criterion.
Stage 4. Design, assessment, and calculation of AHP: The matrix is designed to develop the calculations of AHP [60], the determined criteria are compared A1…An with their respective weights w1,…,wn, this allows to formalize a square matrix, as shown in Figure 2:
| A1 | A2 | … | An | ||
| A1 | w1/w1 | w1/w2 | … | w1/wn | |
| A= | A2 | w2/w1 | w2/w2 | w2/wn | |
| ⁞ | ⁞ | ⁞ | ⁞ | ||
| An | wn/w1 | wn/w2 | wn/wn |
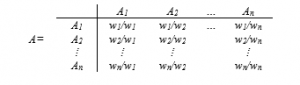
Figure 2: Square matrix. Source: Saaty [60].
The Saaty scale is used to assign the weights for each criterion [61, 62], shown in Table 1.
Table 1: AHP Fundamental Scale. Source: Saaty [61], [62].
| Intensity of importance | Definition | Explanation |
| 1 | Equally important. | Both elements contribute equally to ownership or judgment. |
| 3 | Moderately more important one element than the other. | Judgment and prior experience favor one element over the other. |
| 5 | Strongly more important one element than the other. | Judgment and prior experience favor one element over the other strongly. |
| 7 | Much more vital importance of one element over the other. | One element dominates strongly. Its dominance is proven in practice. |
| 9 | The extreme importance of one element over the other. | One element dominates the other with the most significant possible order of magnitude. |
The values 2, 4, 6 and 8 are used when the degree of importance is intermediate between two odd numbers in the scale; and when the definition and explanation, is inverted, the reciprocal values of the scale are used (1/2, 1/3, 1/4, 1/5…1/9) [61], [62].
Then, Equation 1, because it is a reciprocal matrix, has positive inputs, that is, . So, if this matrix is multiplied by the transposition of the vector , the vector is obtained. In this way, Equation 1 is obtained:
![]()
However, with the Saaty technique, it is only possible to work with a limited number of “n” criteria [61], [62]; for that reason, the Alonso and Lamata’s technique [63], [64] is used since it allows to work with a matrix that has a more significant number of “n” criteria, allowing different degrees “α,” to fulfill the requirement of consistency of the AHP technique.
3.1. Proposed model
Figure 3 shows the sequence of the proposed model, designed for SMEs through the productive taro activity, applied in a medium-sized company. This model, through the AHP technique, assesses the sustainability and competitiveness strategically of a Mexican agri-food focal SME that is the leader of its supply chain in the productive taro activity.
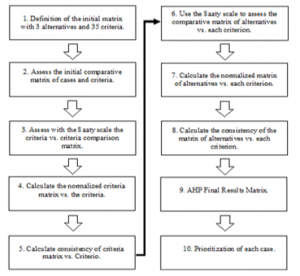
Figure 3: Sequence of the proposed model
Table 2: Model alternatives or cases.
| Alternatives (Cases) | ||
| Alternative 1 | Alternative 2 | Alternative 3 |
| a) The current state without sustainability (Case 1) | b) Cost leadership strategy with the possibility of sustainability (Case 2) | c) Differentiation strategy with the possibility of sustainability (Case 3) |
Step 1. Definition of the initial matrix with three alternatives and 35 criteria.
Table 2 presents the three proposed alternatives, which represent three cases: a) case 1; it is the current state of the SME and its supply chain without considering sustainability, b) case 2; it is the strategy of cost leadership with the possibility of involving sustainability and c) case 3; it is the strategy of differentiation with the possibility of involving sustainability. These last two alternatives are taken from Porter’s two main generic strategies [19].
Table 3 shows the 35 criteria related to economic, competitive, environmental, social, and sustainable aspects from a strategic perspective. These criteria were determined and designed based on the five competitive forces [65], the Porter diamond [66], the SSCM theory [20], [23], the 17 Sustainable Development Goals [67] and the Sustainability Reporting Guidelines [68]. The authors selected these 35 criteria through an exhaustive analysis, representing the most updated and essential aspects of each theory. The theories reflected in these 35 criteria are SSCM, Competitive Advantage, and Sustainable Development.
Table 3: Classification of criteria.
| Aspects | Criteria | |
| Economic and competitive | C1 | Scale Economies |
| C2 | Product differentiation | |
| C3 | Brand positioning | |
| C4 | Input differentiation | |
| C5 | Impact of inputs on cost or differentiation | |
| C6 | The relative price performance of substitutes | |
| C7 | The propensity of buyers to substitute | |
| C8 | High negotiating power of the buyer | |
| C9 | Industry Rivalry (High, considering that the competition is international) | |
| C10 | Low labor cost | |
| C11 | Horizontal and vertical cooperation | |
| C12 | Technology and Innovation | |
| C13 | Administrative and production knowledge | |
| C14 | Government policy (No intervention) | |
| C15 | Consumer’s level of acquisition | |
| Environmental | C16 | Materials |
| C17 | Energy | |
| C18 | Water | |
| C19 | Biodiversity | |
| C20 | Emissions | |
| C21 | Regulatory compliance and environmental standards | |
| C22 | Supplier selection based on environmental performance | |
| Social | C23 | Labor Practices, Decent Work, Health and Safety at Work |
| C24 | Investment in training and education based on labor practices, human rights, and social impact | |
| C25 | Diversity and equality of opportunity and redistribution | |
| C26 | Supplier selection based on labor practices, human rights, and social impact | |
| C27 | Child and forced labor | |
| C28 | Rights of the indigenous population | |
| C29 | Local communities | |
| C30 | Fight against corruption | |
| C31 | Regulatory compliance and social standards | |
| C32 | Product Responsibility | |
| C33 | Consumer Awareness of Sustainability | |
| C34 | Food security, improved nutrition, and promotion of sustainable agriculture | |
| Sustainable | C35 | Partnerships to Achieve the Goals: Strengthening the Means of Implementation and Revitalizing the Global Partnership for Sustainable Development |
Table 4 shows the initial matrix, which contains the three alternatives or cases, and the thirty-five criteria.
Table 4: Initial matrix.
| Criteria | Alternatives (Cases) | ||
| a) Alternative 1 (Case 1) | b) Alternative 2 (Case 2) | c) Alternative 3 (Case 3) | |
| a) The current state without sustainability | b) Cost leadership strategy with the possibility of sustainability | (Case 2) c) Differentiation strategy with the possibility of sustainability | |
| C1 | Assessment 1/a | Assessment 1/b | Assessment 1/c |
| C2 | Assessment 2/a | Assessment 2/b | Assessment 2/c |
| … | … | … | … |
| … | … | … | … |
| C35 | Assessment 35/a | Assessment 35/b | Assessment 35/c |
Step 2. Assess the initial comparative matrix of cases and criteria
In Table 5, the importance of each criterion is assessed according to a scale of 1 to 100 points, then the weight (percentage) of each criterion is calculated, and finally, the assessment is made between each case and each criterion, assigning values of 1, 2, 3, 4, and 5 (where 1 equals very low, 2 = low, 3 = medium, 4 = high, and 5 = very high).
Table 5: Initial assessment of cases and criteria.
| Criteria | Alternatives (Cases) | Points for each criterion (From 1 to 100) | Weight (Percentage) | ||
| a) Alternative 1 (Case 1) | b) Alternative 2 (Case 2) | c) Alternative 3 (Case 3) | |||
| C1 | Assessment 1/a | Assessment 1/b | Assessment 1/c | ||
| C2 | Assessment 2/a | Assessment 2/b | Assessment 2/c | ||
| ⁞ | … | … | … | ||
| ⁞ | … | … | … | ||
| C35 | Assessment 35/a | Assessment 35/b | Assessment 35/c | ||
Step 3. Assess with the Saaty scale the criteria vs. criteria comparison matrix.
In Table 6, the criteria versus criteria assessment are made according to the Saaty scale [61], [62], taking as reference the weight (percentage) of Table 5.
Table 6: Assessment with Saaty scale [61], [62].
| Criteria | Criteria | |||
| C1 | C2 | …. | C35 | |
| C1 | Saaty assessment w1/w1 | Saaty assessment w1/w2 | …. | Saaty assessment w1/w35 |
| C2 | Saaty assessment w2/w1 | Saaty assessment w2/w2 | …. | Saaty assessment w2/w35 |
| ⁞ | ⁞ | ⁞ | …. | ⁞ |
| ⁞ | ⁞ | ⁞ | …. | ⁞ |
| C35 | Saaty assessment w35/w1 | Saaty assessment w35/w2 | …. | Saaty assessment w35/w35 |
| …. | ||||
Step 4. Calculate the normalized criteria matrix vs. the criteria.
Performing the normalization of Table 6, each assessment is divided by the total sum of each criterion. Once the normalization is done, the next step is to calculate the weighting of each criterion, which is obtained by averaging each criterion, see Table 7.
Table 7: Normalized matrix.
| Criteria | Criteria | Weighting | |||
| C1 | C2 | … | C35 | ||
| C1 | (Saaty assessment w1/w1)/ ( ) | (Saaty assessment w1/w2)/ ( ) | … | (Saaty assessment w1/w35)/ ( ) | Row average C1 |
| C2 | (Saaty assessment w2/w1)/ ( ) | (Saaty assessment w2/w2)/ ( ) | … | (Saaty assessment w2/w35)/ ( ) | Row average C2 |
| ⁞ | ⁞ | ⁞ | ⁞ | ⁞ | |
| ⁞ | ⁞ | ⁞ | ⁞ | ⁞ | |
| C35 | (Saaty assessment w35/w1)/
( ) |
(Saaty assessment w35/w2)/ ( ) | (Saaty assessment w35/w35)/ ( ) | Row average C35 | |
Step 5. Calculate consistency of criteria matrix vs. criteria
Multiply the evaluated matrix (Table 6) by the weighting vector in Table 7, then add the products to obtain the λmax “o” nmax, which indicates if there is consistency in the matrix, according to α [63], [64].
Step 6. Use the Saaty scale to assess the comparative matrix of alternatives vs. each criterion.
In Table 8, each alternative is evaluated and compared with the alternative of each criterion. In this case, 35 matrices will be obtained, representing each criterion; each matrix is 3×3.
Table 8: Assessment with Saaty scale [61], [62].
| Criterion C1 | |||
| Alternatives vs. alternatives comparison matrix (3×3) | |||
| Alternatives | a) Alternative 1 (Case 1) | b) Alternative 2 (Case 2) | c) Alternative 3 (Case 3) |
| Alternative 1 (Case 1) | Saaty assessment w1/w1 | Saaty assessment w1/w2 | Saaty assessment w1/w3 |
| Alternative 2 (Case 2) | Saaty assessment w2/w1 | Saaty assessment w2/w2 | Saaty assessment w2/w3 |
| Alternative 3 (Case 3) | Saaty assessment w3/w1 | Saaty assessment w3/w2 | Saaty assessment w3/w3 |
| Total (Sum) | |||
Step 7. Calculate the normalized matrix of alternatives vs. each criterion.
This normalization consists of dividing each assessment by the sums in Table 8, then averaging the normalization of each alternative, to obtain the weighting, as shown in Table 9.
Table 9: Normalized matrix.
| Criterion C1 | ||||
| Normalized matrix (3×3) | ||||
| Alternatives | Alternative 1 (Case 1) | Alternative 2 (Case 2) | Alternative 3 (Case 3) | Average Vector C1/An |
| Alternative 1 (Case 1) | (Saaty assessment w1/w1)/ ( ) | (Saaty assessment w1/w2)/ ( ) | (Saaty assessment w1/w3)/ ( ) | Row average Alternative 1 (C1/A1) |
| Alternative 2 (Case 2) | (Saaty assessment w2/w1)/ ( ) | (Saaty assessment w2/w2)/ ( ) | (Saaty assessment w2/w3)/ ( ) | Row average Alternative 2 (C1/A2) |
| Alternative 3 (Case 3) | (Saaty assessment w3/w1)/ ( ) | (Saaty assessment w3/w2)/ ( ) | (Saaty assessment w3/w3)/ ( ) | Row average Alternative 3 (C1/A3) |
Step 8. Calculate the consistency of the matrix of alternatives vs. each criterion
This calculation is done in the same way as in step 5. The matrix in Table 8 is taken by the average vector in Table 9. This procedure is done for all 35 criteria.
Step 9. AHP Final Results Matrix.
Making this matrix, only the average vectors of the 35 matrices calculated in step 7 are taken, and finally, the weights of step 4 are taken from Table 10.
Step 10. Prioritization of each case.
It is the last step in our proposed model to obtain the prioritization of each case or alternative. First, each of the average vectors of each alternative is multiplied by the weighting with the same criterion, resulting in 35 products. Then, the resulting products are added up to obtain the prioritization of each alternative (Table 10).
Table 10: Normalized matrix (3×3).
| Criteria/Cases (Alternatives) | Alternative 1 (Case 1) | Alternative 2 (Case 2) | Alternative 3 (Case 3) | Weighting |
| C1 | Average Vector C1/A1 | Average Vector C1/A2 | Average Vector C1/A3 | Weighting C1 |
| C2 | ⁞ | ⁞ | ⁞ | Weighting C2 |
| ⁞ | ⁞ | ⁞ | ⁞ | ⁞ |
| ⁞ | ⁞ | ⁞ | ⁞ | ⁞ |
| C35 | Average Vector C35/A1 | Average Vector C35/A2 | Average Vector C35/A3 | Weighting C35 |
| Prioritization | Prioritization 1 | Prioritization 2 | Prioritization 3 |
4. Results
Table 11 shows the comparative matrix of the three alternatives against the thirty-five criteria. This table is the beginning of the application of the AHP technique.
Table 11: Initial comparative matrix of cases and criteria.
| Criteria | Alternatives (Cases) | Points for each criterion (From 1 to 100) | Weight (Percentage) | |||
| a) The current state without sustainability (Case 1) | b) Cost leadership strategy with the possibility of sustainability (Case 2) | c) Differentiation strategy with the possibility of sustainability (Case 3) | ||||
| C1 | Scale Economies | 3 | 3 | 1 | 66 | 2.84% |
| C2 | Product differentiation | 1 | 1 | 5 | 66 | 2.84% |
| C3 | Brand positioning | 1 | 3 | 5 | 60 | 2.58% |
| C4 | Input differentiation | 1 | 3 | 5 | 40 | 1.72% |
| C5 | Impact of inputs on cost or differentiation | 1 | 4 | 4 | 40 | 1.72% |
| C6 | The relative price performance of substitutes | 1 | 3 | 3 | 62 | 2.67% |
| C7 | The propensity of buyers to substitute | 1 | 1 | 5 | 75 | 3.23% |
| C8 | High negotiating power of the buyer | 1 | 1 | 5 | 80 | 3.44% |
| C9 | Industry Rivalry (High, considering that the competition is international) | 1 | 1 | 5 | 80 | 3.44% |
| C10 | Low labor cost | 2 | 3 | 3 | 38 | 1.64% |
| C11 | Horizontal and vertical cooperation | 1 | 2 | 5 | 90 | 3.87% |
| C12 | Technology and Innovation | 2 | 3 | 5 | 72 | 3.10% |
| C13 | Administrative and production knowledge | 2 | 3 | 5 | 73 | 3.14% |
| C14 | Government policy (No intervention) | 3 | 2 | 5 | 79 | 3.40% |
| C15 | Consumer’s level of acquisition | 1 | 2 | 5 | 81 | 3.49% |
| C16 | Materials | 1 | 2 | 5 | 45 | 1.94% |
| C17 | Energy | 1 | 2 | 5 | 68 | 2.93% |
| C18 | Water | 1 | 2 | 5 | 67 | 2.88% |
| C19 | Biodiversity | 2 | 2 | 5 | 56 | 2.41% |
| C20 | Emissions | 2 | 2 | 5 | 57 | 2.45% |
| C21 | Regulatory compliance and environmental standards | 2 | 3 | 5 | 89 | 3.83% |
| C22 | Supplier selection based on environmental performance | 1 | 2 | 5 | 90 | 3.87% |
| C23 | Labor Practices, Decent Work, Health and Safety at Work | 2 | 3 | 5 | 40 | 1.72% |
| C24 | Investment in training and education based on labor practices, human rights, and social impact | 1 | 3 | 5 | 39 | 1.68% |
| C25 | Diversity and equality of opportunity and redistribution | 1 | 3 | 5 | 41 | 1.76% |
| C26 | Supplier selection based on labor practices, human rights, and social impact | 1 | 3 | 5 | 90 | 3.87% |
| C27 | Child and forced labor | 4 | 4 | 5 | 57 | 2.45% |
| C28 | Rights of the indigenous population | 3 | 3 | 5 | 56 | 2.41% |
| C29 | Local communities | 3 | 3 | 5 | 53 | 2.28% |
| C30 | Fight against corruption | 2 | 3 | 5 | 67 | 2.88% |
| C31 | Regulatory compliance and social standards | 2 | 3 | 5 | 89 | 3.83% |
| C32 | Product Responsibility | 3 | 3 | 5 | 68 | 2.93% |
| C33 | Consumer Awareness of Sustainability | 1 | 2 | 5 | 85 | 3.66% |
| C34 | Food security, improved nutrition, and promotion of sustainable agriculture | 3 | 3 | 4 | 67 | 2.88% |
| C35 | Partnerships to Achieve the Goals: Strengthening the Means of Implementation and Revitalizing the Global Partnership for Sustainable Development | 1 | 2 | 4 | 97 | 4.18% |
| 2323 | 100% | |||||
Continuing with the AHP technique, it is essential to know the consistency of the matrix. Since it is too large (35 x 35), it requires using the Alonso and Lamata’s consistency criteria [63], [64], where λmax is considered to accept or reject the consistency. According to calculations made with an α of 0.1, λmax has a value of 38,845, which indicates that this matrix has an adequate consistency, allowing the continuation of the AHP technique.
In Table 12, the comparison between the alternatives is made according to criterion 1 (C1), then it is normalized (average vector); this procedure is performed for the 35 criteria.
Table 12: Comparative matrix of cases for each criterion.
| Criterion C1: Scale Economies | Normalized matrix | ||||||
| Alternatives | Case 1 (Alternative 1) | Case 2 (Alternative 2) | Case 3 (Alternative 3) | Case 1 | Case 2 | Case 3 | Average Vector |
| Case 1 (Alternative 1) | 1 | 1 | 5 | 4/9 | 4/9 | 4/9 | 0.45 |
| Case 2 (Alternative 2) | 1 | 1 | 5 | 4/9 | 4/9 | 4/9 | 0.45 |
| Case 3 (Alternative 3) | 1/5 | 1/5 | 1 | 0.09 | 0.09 | 0.09 | 0.09 |
| Total ( ) | 2.20 | 2.20 | 11.00 | ||||
In Table 13, the final result of AHP can be seen, where the weights of the 35 x 35 matrix and the average vectors of the 35 comparative matrices of the three cases by criterion are shown. The final result is the prioritization of each case. This prioritization can be interpreted as the final assessment or evaluation that each case has according to the 35 criteria.
Case 1 (alternative 1) has a low value (9.49%) because its current situation is casual, here there are no defined strategies, the collaboration of the supply chain is not ideal, sustainability is not contemplated, among other aspects defined in stage 1.
While case 2 (alternative 2), with the strategy of cost leadership with the possibility of sustainability, shows a percentage of 17.30%. Based on the current situation, this percentage indicates that the combination of this strategy with sustainability would be more challenging to carry out compared to case 3. It does not mean that it is impossible, but it would be more challenging to shift to sustainability. It is difficult for organizations to compete with unsustainable low-cost products in the foreign market in the current situation, making it somewhat unfeasible to have this strategy along with sustainability. It could increase their costs and lead to unequal competition.
Finally, case 3 (alternative 3), referring to the strategy of differentiation with the possibility of sustainability, has the highest value (73.21%). It indicates better compatibility and strategic feasibility between competitiveness and sustainability. It is because sustainability could be more easily aligned while providing a competitive advantage. However, a more significant challenge to achieving full sustainability can be seen in the supply chain of this SME because it is in the agri-food sector. If it goes more in-depth at the farmer level, it is difficult to achieve 100 % sustainability because it would need to reach a natural ecosystem to do so [69].
Table 13: AHP final results.
| Criteria / Cases (Alternatives) | Case 1 (Alternative 1) | Case 2 (Alternative 2) | Case 3 (Alternative 3) | Weighting |
| C1 | 0.4545 | 0.4545 | 0.0909 | 0.0178 |
| C2 | 0.0909 | 0.0909 | 0.8182 | 0.0178 |
| C3 | 0.0612 | 0.2157 | 0.7231 | 0.0106 |
| C4 | 0.0612 | 0.2157 | 0.7231 | 0.0050 |
| C5 | 0.0667 | 0.4667 | 0.4667 | 0.0050 |
| C6 | 0.0909 | 0.4545 | 0.4545 | 0.0110 |
| C7 | 0.0909 | 0.0909 | 0.8182 | 0.0362 |
| C8 | 0.0909 | 0.0909 | 0.8182 | 0.0391 |
| C9 | 0.0909 | 0.0909 | 0.8182 | 0.0391 |
| C10 | 0.1429 | 0.4286 | 0.4286 | 0.0044 |
| C11 | 0.0685 | 0.1549 | 0.7766 | 0.0737 |
| C12 | 0.0833 | 0.1932 | 0.7235 | 0.0339 |
| C13 | 0.0833 | 0.1932 | 0.7235 | 0.0350 |
| C14 | 0.1932 | 0.0833 | 0.7235 | 0.0374 |
| C15 | 0.0685 | 0.1549 | 0.7766 | 0.0414 |
| C16 | 0.0685 | 0.1549 | 0.7766 | 0.0058 |
| C17 | 0.0685 | 0.1549 | 0.7766 | 0.0209 |
| C18 | 0.0685 | 0.1549 | 0.7766 | 0.0192 |
| C19 | 0.1111 | 0.1111 | 0.7778 | 0.0095 |
| C20 | 0.1111 | 0.1111 | 0.7778 | 0.0097 |
| C21 | 0.0833 | 0.1932 | 0.7235 | 0.0665 |
| C22 | 0.0685 | 0.1549 | 0.7766 | 0.0737 |
| C23 | 0.0833 | 0.1932 | 0.7235 | 0.0050 |
| C24 | 0.0612 | 0.2157 | 0.7231 | 0.0046 |
| C25 | 0.0612 | 0.2157 | 0.7231 | 0.0056 |
| C26 | 0.0612 | 0.2157 | 0.7231 | 0.0737 |
| C27 | 0.2000 | 0.2000 | 0.6000 | 0.0097 |
| C28 | 0.1429 | 0.1429 | 0.7143 | 0.0091 |
| C29 | 0.1429 | 0.1429 | 0.7143 | 0.0087 |
| C30 | 0.0833 | 0.1932 | 0.7235 | 0.0192 |
| C31 | 0.0833 | 0.1932 | 0.7235 | 0.0665 |
| C32 | 0.1429 | 0.1429 | 0.7143 | 0.0209 |
| C33 | 0.0685 | 0.1549 | 0.7766 | 0.0632 |
| C34 | 0.2000 | 0.2000 | 0.6000 | 0.0192 |
| C35 | 0.0833 | 0.1932 | 0.7235 | 0.0823 |
| Prioritization | 0.0949 | 0.1730 | 0.7321 | 1 |
5. Discussion
This study shows that there are more compatibility and feasibility between the differentiation strategy and sustainability, causing at the same time a competitive advantage. While some strategic incompatibilities can be observed with the cost leadership strategy and sustainability, the effects are presented in the costs and, consequently, the competitiveness. It coincides that SSCM practices do not necessarily reduce costs related to sustainability [17], [18].
The proposed model shows a high degree of difficulty in assessing sustainability and competitiveness strategically. It was validated through a Mexican agri-food focal SME. The model demonstrates that it is possible a large number of criteria for decision-making, considering Alonso and Lamata’s terms [63], [64]. To carry out this assessment, it is necessary to have an in-depth and particular knowledge of the company’s situation, its environment, and its supply chain. It agrees that particular circumstances of each supply chain must be assessed, considering all factors, both internal and external, which may vary over time [20].
Everything indicates that the effects of the COVID-19 pandemic will drive and accelerate a change in people’s eating habits [70], prioritizing consumption in local food supply chains [71]. All of the above, together with climate change and its effects [8], [9], as well as changes in the governmental agendas of various countries due to the COVID-19 pandemic [1], such as Mexico, would lead to an increase of SSCM practices in local, national and international food sector.
The COVID-19 pandemic can be taken as a reference for issues such as food insecurity and ultra-processed food products that affect the health and welfare of people. The crisis that has brought this pandemic should lead us to think further, as we have more challenges ahead, such as climate change, environmental impacts, poverty, among other aspects that could cause instability around the world. Thus, the current situation should be a lesson on what is wrong, and an impetus to further progress towards the 17 Sustainable Development Goals, in this case, through the SSCM theory. The SSCM must continue to evolve in order to improve food supply chains, so this model contributes to the strategic planning of the SSCM in order to develop greater long-term resilience in Mexican agri-food SMEs.
6. Conclusions
This study finds more feasibility and compatibility to achieve sustainability with a differentiation strategy than with a cost leadership strategy. As could be seen, strategies have an essential role in promoting sustainability and competitiveness. Therefore, they must be considered in SSCM’s strategic planning and tactical and operational planning, aligning them and fitting them to the core business of the focal companies and the supply chain members. It is also found that the proposed strategic initiatives in SSCM would lead to a competitive advantage due to the difficulty of replicating them.
The proposed model provides support to assess and develop the sustainable and competitive part of the strategic planning in SSCM, without running the economic risks that an implementation represents. It highlights how complex it may be to assess an SME and its supply chain strategically due to the high number of criteria used, but at the same time, these criteria provide important aspects for decision making.
This strategic model contributes to prevent or face problems such as the COVID-19 pandemic and climate change, providing knowledge to the SSCM. It is designed to apply to both small and medium-sized focal companies that lead their supply chain in the food sector, considering sustainability and competitiveness strategically through specific metrics.
In future research, it is intended to apply the model to more small and medium Mexican agri-food companies that lead their supply chains to carry out comparative case studies to contribute knowledge to the SSCM theory and, at the same time to continue executing and improving the proposed model.
Conflict of Interest
The authors declare no conflict of interest.
Acknowledgment
The authors are thankful to the Instituto Tecnológico Superior de Tepexi de Rodríguez, and to the UPAEP (Universidad Popular Autónoma del Estado de Puebla) for the support and collaboration of this research. Likewise, Dr. Yonatan thanks CONACYT (Consejo Nacional de Ciencia y Tecnología) from Mexico for the support during his doctoral studies.