Tolerance of Characteristics and Attributes in Developing Student’s Academic Achievements

Adv. Sci. Technol. Eng. Syst. J. 5(5), 1126–1136 (2020);
 DOI: 10.25046/aj0505137
The purpose of this research is to study the relevance of factors for the analysis of the effectiveness of suitable educational institutions that illustrate the significance of the characteristics and attributes of the student’s academic achievements and to identify the acceptance and tolerance of each attribute, which supports lifelong learning. The data used in this research is 1109 students who used and tested the institution recommender system based on student context and educational institution application. The research methodology focuses on the study of user involvement and application analysis. There are six significant phases of the research: business understanding, data understanding, data preparation, modeling, evaluation, and deployment. The machine learning tools and data mining techniques are k-means, k-medoids, decision trees, cross-validation methods, and confusion matrix. From the data analysis, it can be concluded that the overall level of satisfaction with the application is accepted (average = 3.70, S.D. = 0.84). In addition, the prototype model has been developed for predicting and recommending appropriate institutions for the learner has moderate accuracy levels (92.25%), and the results of the self-test data model are very accurate at the highest level, which is equal to 93.78%. Finally, this research demonstrates the relevance and success of education engineering projects. It demonstrates a worthy accomplishment. For future research, the researchers aim to construct and develop applications that promote and support the findings of this research.
1. Introduction
Education and learner sustainability are the main goals of Thailand’s government and the United Nations (UN) as defined in the Sustainable Development Goals (SDGs) [1,2], which are aimed and set as the world target success in 2030 [1]. The results are from an extensive research related to the development in quality of education. Numerous research studies showed a variety of educational outcomes [3–5], such as the development of learners’ theories, learning styles, educational models, and educational technology.
Most of the research results is abstract and difficult to develop into a model or method that can be effectively implemented. In addition, there are many ways to take the next step towards student achievement, as shown in Figure 1. The question asked is “what is truly reasonable in theoretical practice for student characteristics?”
While there are many theories for the development of learning, there seems to be no technology and method to present reasonable and appropriate models, tools and strategies for learners. The combination of the two academic domains between engineering and education that had occurred is called Education Engineering (EE). In addition, it has completely changed the current radical educational system to be known as “Disruptive Technology” [6,7]. However, the researchers tried to study and carry out the research by applying the two knowledge together [8–14]. The discovery was that there were too many research areas that have yet to be explored. Figure 2 shows the studies and research related to the research results of the past researchers.
From Figure 2, the researchers gathered the hot issues, critical problems, data set, student information, research models, and research results in many perspective [2,8]. Preliminary studies have driven the researchers to conduct research studies to develop learners’ potential and significantly increase the learners’ academic achievement. Therefore, this research has important objectives and goals for studying the relevance and success of

Figure 1: World of Learning Theory

Figure 2: Areas of research being offered

Figure 3: Research Progress
research that demonstrate the significant attributes of the student’s academic achievements, and to identify the acceptance and tolerance of each attribute.
The important process of this research is therefore aimed at the model chosen from the previous research to improve the application that had been developed [10,15]. After that, the data collected from 1109 actual users were analyzed and searched for factors that supported and encouraged learners to meet the needs and suitability between the learners and the educational institutions. This is the main objective of the research.
The outline of this research is divided into four sections. Section 1 leads the reader to understand the problem. Section 2 is the presentation of literature, related work and research methods. Section 3 is a summary of the research results and discussions. Finally, the last section is the summarized conclusion.
2. Literature Reviews and Related Works
This section summarizes the overview of research related to the moment of research in engineering education. Areas of education engineering in the paper are scoped into five stages: traditional problems, students’ academic achievement, engineering education, technology of education engineering, and how can education engineering work.
2.1. Thailand’s educational policy and problems
Since 1999, education in Thailand has been improved and educational opportunities have presented for the public. The system provides the learning process for personal and social development with factors available conducive to continuous lifelong learning [5]. Everything seems beautiful for Thai students [6]. While twenty years have passed, Thailand’s education system is still hopeful that there is light at the end of the tunnel. The failure of a test to measure students’ achievement is a good example [16]. However, when considering the factors, learners are most important for developing because no matter how the system has changed, the end result should be the learner’s achievement. Finding the identity of the learner to present what is worthy for her/him is the first priority [10].
2.2. Student’s Academic Achievements
Certifications and degrees are not a measure of a person’s achievements, but it is a tool that helps everyone find what they want and expect in life. Academic results are an opportunity for learners to find what they are. At the same time, grading the exam and testing can be used to determine the advancement and recognition of students’ knowledge, however there is a need on considering what determines to be for success as the process may require more testing.
Student’s academic achievements can be judged from many perspectives, such as the dimension of learning styles, student’s emotions, academic motivation, and hidden academic relationship [2,9,17]. Considering the reasonableness of the individual is more important than anything.
2.3. Education Engineering
Education and Engineering has changed over time, where the desire to achieve “the best practices” requires a clear framework. For the best, finding the answer requires research, which also requires a method, technology, theoretical, and application that depends on the researcher’s needs [17,18].
It is only a minority researcher that mentions engineering education [3,19]. To combine the education and engineering requires a step by step framework for developing the best practice models. In addition, in-depth research using modern technology also supports learning theory by finding and developing models that are sensible to learners. No matter how smart and important the technology is, the emphasis of educational development is to develop the learning processes, analytical thinking, and ability to apply their knowledge to solve problems and increase knowledge [10].
2.4. Education Engineering Technology
Educational engineering technology is the use of technology for effective education for learners. It resulted from a change known as disruptive technology [7, 8]. There are many programs and applications that support Thailand’s education, which bring in novel and advanced technology for managing in order to achieve better student performance [4,20,21]. The results show different aspects of the development in the education process.
2.5. Implemented Education Technology
A good example is on how the application of engineering knowledge is integrated into the educational process [5]. It provides and explains the advanced technology application, which consists of five steps: requirement definition, system and software design, implementation and unit testing, integration and system testing, and operation and maintenance. All steps are the key principles in the development of knowledge, research, and discoveries to be practically usable [5, 11, 16].
2.6. Thailand’s educational policy and problems
This research was conducted and studied logically, as illustrated in the study period in Figure 3. Their research has started to focus on education engineering since the year 2016 and has proposed concepts of applied engineering and education for the education models in Thailand. At this stage, it presented their research from the past to the future, which consists of six main steps. The first step is defining the research problems. The second step is finding the significant and appropriate attributes. The third step is development of the model. The fourth step is building the application. The fifth step is testing and deploying the application. Finally, the sixth step is applying the application to the targets
2.6.1. Defining the Research Problems
It started in early 2016, which presented the idea of matching students to universities [5]. The research problem is “how to introduce and match diverse students to different contexts of educational institutions” as shown in Figure 4.
The results of their research found that Thailand’s education system and interest to study are important factors in choosing universities and influencing the decision of studying at a higher education level [16]. The data used in their research was 256 students from two universities: (1) the Rajabhat Mahasarakham University, Maha Sarakham, Thailand and (2) the University of Phayao, Phayao, Thailand.
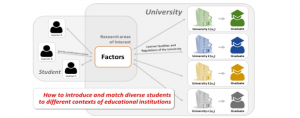
Figure 4: Matching Students to Universities
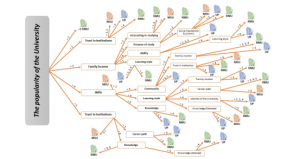
Figure 5: Appropriate Model with Decision Tree [23]
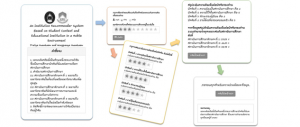
Figure 6: Institution Recommender Mobile Application
2.6.2. Finding Significant and Appropriate Attributes
After the success of the study in the problems of the decision to study at a higher level, the researchers conducted the study to find factors that are important matching components between the learners and the educational institutions [22]. The data used in the research was 885 students from three universities: (1) the Rajabhat Mahasarakham University, Maha Sarakham, Thailand, (2) the Maha Sarakham University, Maha Sarakham, Thailand, and (3) the University of Phayao, Phayao, Thailand.
The result is the acceptance of the factors studied. It was found that the factors associated with their research consisted of 19 significant factors including 15 factors of student’s context and 4 factors of program’s context, as shown in Table 1.
Table 1: Significant and Appropriate Attributes [23]
| Perception and Perspective | Statement and Details |
| Student’s Context | Student’s Interests |
| Stage 1.1 Interest in studying
Stage 1.2 Career path Stage 1.3 Identity of the University Stage 1.4 Knowledge obtained Stage 1.5 Education system |
|
| Student’s Characteristics | |
| Stage 2.1 Student Abilities
Stage 2.2 Student Skills Stage 2.3 Student Knowledge Stage 2.4 Learning Styles of Student |
|
| Student’s Environment | |
| Stage 3.1 Social capital and Economic
Stage 3.2 Trust in institutions Stage 3.3 Personal decision Stage 3.4 Family income Stage 3.5 Community Stage 3.6 Purpose of study |
|
| Program’s Context | Program’s Context |
| Stage 4.1 The popularity of the University
Stage 4.2 Curriculum Stage 4.3 Education standard Stage 4.4 Quality assurance |
2.6.3. Model Development
After studying and analyzing perceptions of factors that are important to the choice of continuing education between students and institutions [23], the data collected the satisfaction level with factors having been analyzed and developed by data mining techniques and machine learning tools. The result is a decision tree model that is shown in Figure 5. Figure 5 illustrates the decision tree obtained from the appropriate model.
All among 19 factors, 15 factors can determine whether the students are suitable to learn at that particular university.
2.6.4. The Application Development
After modeling success, the mobile applications have been developed [5]. Their application consists of three important steps: (1) introduction of the application, (2) prediction of interest at a higher education level, and (3) recommendation of an appropriate institution for the user. The structure and working process of the application is shown in Figure 6.
2.6.5. Testing and Deployment
The application in the previous section was searched for performance, which used a satisfaction questionnaire from 431 samples [5]. It consisted of 186 high school students, 191 university students, 12 staffs and 42 lectures in the universities. The testing process consisted of four main stages: functional requirement testing, functional testing, usability testing, and security testing. According to their results, it indicated that the total satisfaction toward the application are highest, which is equal to 4.32, and the groups with the highest levels of satisfaction are university students, which is equal to 4.43. It can be concluded that the application is appropriate and reasonable for students who wish to study at a higher education level [5].
2.6.6. Applied Application to the Targets
After the prototype application was created [5], it was applied to 1,109 students from the three universities; Rajabhat Mahasarakham University, Mahasarakham University, and University of Phayao to test the application [11]. Based on the data collected, they found that the relationships were more expected and exceeded that was supported by Thailand’s educational system. It is defined as a “Nest Relationship” or “Hidden Relationship”. The results of their research demonstrate the different levels of relationships that are influenced by the Grade Point Average (GPA), school size, community environment, and school friends. It is consistent with the hypothesis that was predicted as shown in Figure 7.
From the findings and additional information collected, the research studied on matching the right students with the most appropriate institutions. The research aimed on developing the knowledge and seeking the best tools for the learner, which have research related to the development tools in education engineering, machine learning, active learning theory, and data mining in education [2, 5, 9, 12].
3. Research Methodology
The purpose of this research is to study the relevance of factors for the analysis of the effectiveness of suitable educational institutions that illustrate the significant of the characteristics and attributes of the student’s academic achievements, and to identify the acceptance and tolerance of each attribute, which supports lifelong learning. The data collection used in this research is 1109 students who used and tested the institution recommender system based on student context and educational institution application [11]. The research methodology focused on the study of user involvement and application analysis. It consisted of six main steps in data analysis for data mining management [23,24]: business understanding, data understanding, data preparation, modeling, evaluation, and deployment.
3.1. Business Understanding
The business understanding presents the viewpoint of research problems [24]. Understanding the overview of the problem will enable the research goals to be defined clearly. Thus, the research problem of this research is to screen the groups of testers who tested the applications [11], and to use the data collected to study the group’s behavior.

Figure 7: Thinking cycle of students toward the institution
3.2. Data Understanding
Data understanding is closely linked to the business understanding of activities which are aimed at identifying data quality problems, discovering the insight into the data, and examining the attractiveness of problems from hidden data [24]. Therefore, the research designed the data collection to be consistent with the research objectives. The characteristics of the data consisted of specifying the educational institution of the data providers and showing the level of attitude towards the factors that the researcher is studying.
3.3. Data Preparation
Data preparation is a process of data management for use in the development of prototype models. In addition, it prepares data in formats such as tables and records, including feature selection, feature management, data cleaning, construction of the new attributes, and so on [24]. In this research, it was compiled and prepared as summarized in Table 2 to Table 3.
Table 2: Data Collection
| Institutions | Data Collection | |
| Providers | Percentage | |
| MSU: Maha Sarakham University | 345 | 31.11% |
| RMU: Rajabhat Mahasarakham University | 478 | 43.10% |
| UP: University of Phayao | 286 | 25.79% |
| Total: | 1109 | 100% |
From Table 2, it shows that the largest number of tester who provided the data was Rajabhat Mahasarakham University, which had 478 tester or equal to 43.10 percent of all data providers. In addition, the summary of general statistics from data collection is shown in Table 3, referring to the accepted factors from Table 1.
From Table 3, it can be concluded that the overall perception and perspective on the overall factors averages at 3.70 (S.D. = 0.84), which is the most accepted point of view is program’s context. It has an average of 4.00 (S.D. = 0.89). Therefore, it can be concluded that the providers accept all factors as a whole, with particular emphasis on the program’s context.
Table 3: Data Analysis
| Perception and Perspective | Data Collection (n = 1109) | ||
| Stages | Means | S.D. | |
| Student’s Context | Student’s Interests | ||
| Stage 1.1 | 3.80 | 0.81 | |
| Stage 1.2 | 3.74 | 0.85 | |
| Stage 1.3 | 3.85 | 0.79 | |
| Stage 1.4 | 3.82 | 0.74 | |
| Stage 1.5 | 3.63 | 0.87 | |
| Average | 3.77 | 0.82 | |
| Student’s Characteristics | |||
| Stage 2.1 | 3.75 | 0.81 | |
| Stage 2.2 | 3.63 | 0.74 | |
| Stage 2.3 | 3.71 | 0.69 | |
| Stage 2.4 | 3.40 | 0.78 | |
| Average | 3.63 | 0.77 | |
| Student’s Environment | |||
| Stage 3.1 | 3.61 | 0.81 | |
| Stage 3.2 | 4.03 | 0.72 | |
| Stage 3.3 | 3.27 | 0.90 | |
| Stage 3.4 | 3.49 | 0.89 | |
| Stage 3.5 | 3.20 | 0.84 | |
| Stage 3.6 | 3.41 | 0.93 | |
| Average | 3.50 | 0.89 | |
| Program’s Context | Program’s Context | ||
| Stage 4.1 | 4.08 | 0.83 | |
| Stage 4.2 | 4.12 | 0.74 | |
| Stage 4.3 | 4.00 | 0.67 | |
| Stage 4.4 | 3.79 | 0.70 | |
| Average | 4.00 | 0.75 | |
| Total Average
|
3.70 | 0.84 | |
3.4. Modeling
The modeling phase is the selection of tools suitable for the data collected to meet the research questions and goals [24]. Therefore, the researchers selected the machine learning tools and data mining techniques, which consisted of two types of tools: clustering tools consisting of k-means [25] and k-medoids [26], and classification tools consisting of decision tree [5, 11, 12].
The k-means is the most common algorithm used in an iterative refinement technique. It is also called Lloyd’s algorithm [26], especially in the computer science community. The k-mean algorithm is performed by switching between two steps: (1) the assignment step, which assigns each observation to the cluster with the closest mean. (2) updates the procedure which is calculated a new means to be a centroid of observations in a cluster.
The k-medoids algorithm is a clustering algorithm that is associated with the k-means and the medoid shift algorithm. Both the k-means and k-medoids algorithms have some characteristics which divide the data set into groups. K-means is an attempt to reduce the total squared error, while the k-medoids reduce the sum of the dissimilarities between the points labeled in the cluster and the point that determines the center of that cluster [27].
The decision tree is one of the learning methods used in statistics, machine learning, and data mining. It works by determining data from observations and separating data for use in data consideration and finding predictive results. The benefit is getting important factors, which are caused by the nodes or the decision-making part of the model [5, 11, 12].
3.5. Evaluation
The goal of the evaluation is to assess the results and review the process [14,23]. The tools that are used in the research include cross-validation methods as shown in Figure 8, and confusion matrix as mentioned in Figure 9. Figure 8 displays the separation of data for evaluating the model. The cross-validation method divides the data into two parts. The first part is used for modeling and the remainder to test the model. In addition, model evaluation requires a tool called a confusion matrix [12, 14, 15, 24] to test the model’s performance, with the principles shown in Figure 9.
Figure 9 presents the composition of the confusion matrix performance, which is composed of the actual class and the predicted class. An important benefit of the performance of the confusion matrix is the ability to determine the model’s ability to predict results, such as the predictive ability or accuracy, model precision, model sensitivity, and model specificity (recall measurement). These values are used to determine the actual performance model. Moreover, Figure 9 also demonstrates the formulas and methods for calculating the various performance parameters in detail.
3.6. Deployment
The implementation is intended to be used in further applications [24]. The researcher aims to improve and use it in the next academic year (academic year 2021). It has been described in applying an activity recommendation as the following:
3.6.1. Testing Model Results
As mentioned above, the tools used to evaluate the model consist of two parts: cross-validation method, and confusion matrix. This section describes the implementation of assessment tools in the research.
The testing process divides the data into two parts according to the cross-validation method principles, but the division is divided into three types. The first type is 5-Fold cross-validation, which used 4-Fold (80%) for modeling and 1-Fold (20%) for testing. The second type is 10-Fold cross-validation, which used 9-Fold (90%) for modeling and 1-Fold (10%) for testing. The last type is leave-one-out cross-validation, which used 99% of data for modeling and 1% of data for testing. However, each time the cross-validation test is reported, the model results are also tested using the confusion matrix too.
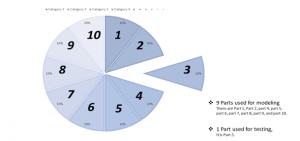
Figure 8: Cross-Validation Method
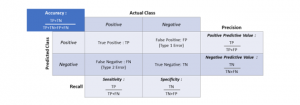
Figure 9: Confusion Matrix Performance
3.6.2. Applying Model Results
The applying model results are in three parts: generate a decision tree model for decision-making, test the decision tree model with data collection, and conclude the centroid of k-means. All details are presented on the section of research results and discussion.
4. Research Results and Discussion
In the research results, the researchers classified the research report into three parts which are modeling results, model testing results, and model applying results.
4.1. Modeling Results
Modeling results are the various models on different criteria, such as defining the unequal depth of the decision tree, and determining the different types of cross-validation method tests, which have the results shown in Table 4 and Table 5.
Table 4: Modelling Results from k-Means Clustering
| Cluster Number | Decision Tree Depth | Cross-Validation Method Types | ||
| 5-Fold | 10-Fold | Leave-one-out | ||
| 3 Clusters | Level 3 | 88.10% | 88.46% | 88.64% |
| Level 4 | 88.73% | 88.55% | 89.00% | |
| Level 5 | 89.27% | 89.18% | 88.91% | |
| Level 6 | 89.63% | 89.90% | 89.90% | |
| Level 7* | 91.07% | 91.16% | 92.25%* | |
| Level 8 | 91.52% | 92.24% | 92.25% | |
| Level 9 | 91.61% | 92.24% | 91.88% | |
| 4 Clusters | Level 3 | 47.61% | 47.43% | 47.07% |
| Level 4 | 47.97% | 47.88% | 47.79% | |
| Level 5 | 58.97% | 59.24% | 59.24% | |
| Level 6 | 60.32% | 61.59% | 60.50% | |
| Level 7 | 65.10% | 63.30% | 63.39% | |
| Level 8 | 80.61% | 79.44% | 78.72% | |
| Level 9* | 88.28%* | 87.65% | 87.65% | |
| 5 Clusters | Level 3 | 54.82% | 54.73% | 54.64% |
| Level 4 | 55.46% | 55.82% | 55.91% | |
| Level 5 | 60.50% | 59.87% | 60.23% | |
| Level 6 | 63.12% | 62.13% | 60.50% | |
| Level 7 | 68.98% | 66.72% | 65.46% | |
| Level 8* | 83.94%* | 74.56% | 66.28% | |
| Level 9 | 87.91% | 85.12% | 83.95% | |
From Table 4, it shows that the k-means model with the highest accuracy is the decision tree model that is classified into 3 clusters by dividing the model testing into the leave-one-out cross-validation method with a depth of 7 levels of the decision tree model and has an accuracy of 92.25%.
However, the test results classified by other clusters yielded a lower accuracy. For example, the 4 clusters with the highest results are 88.28% and the 5 clusters have the highest results of 83.94%.
Table 5: Modelling Results from k-Medoids Clustering
| Cluster Number | Decision Tree Depth | Cross-Validation Method Types | ||
| 5-Fold | 10-Fold | Leave-one-out | ||
| 3 Clusters | Level 3 | 78.00% | 77.37% | 76.01% |
| Level 4 | 80.25% | 81.24% | 81.61% | |
| Level 5 | 84.67% | 83.50% | 77.37% | |
| Level 6 | 88.10% | 86.83% | 91.52% | |
| Level 7 | 90.62% | 89.72% | 90.35% | |
| Level 8 | 91.25% | 91.25% | 91.07% | |
| Level 9* | 91.62% | 91.97%* | 91.61% | |
| 4 Clusters | Level 3 | 77.37% | 76.38% | 75.74% |
| Level 4 | 78.08% | 80.08% | 81.33% | |
| Level 5 | 81.96% | 83.32% | 81.70% | |
| Level 6 | 84.49% | 86.30% | 86.93% | |
| Level 7 | 88.19% | 89.18% | 90.08% | |
| Level 8 | 90.26% | 90.72% | 91.52% | |
| Level 9 | 91.61% | 91.62%* | 90.62% | |
| 5 Clusters | Level 3 | 78.99% | 78.54% | 77.01% |
| Level 4 | 82.23% | 82.42% | 81.15% | |
| Level 5 | 84.76% | 85.39% | 85.57% | |
| Level 6 | 86.65% | 86.66% | 86.38% | |
| Level 7 | 88.73% | 88.73% | 88.73% | |
| Level 8 | 90.53% | 89.36% | 88.64% | |
| Level 9 | 91.96%* | 90.81% | 90.98% | |
From Table 5, it shows that the k-medoids model with the highest accuracy is the decision tree model that is classified into 3 clusters by dividing the model testing into the 10-fold cross-validation method with a depth of 9 levels of the decision tree model and has an accuracy of 91.97%.
However, the test results classified by other clusters yielded a lower accuracy. For example, the 4 clusters with the highest results are 91.62% and the 5 clusters have the highest results of 91.96%.
Table 6: Model Testing Results
| Accuracy: 92.25% | Actual Class | Precision Class | |||
| True Cluster_0 | True Cluster_1 | True Cluster_2 | |||
| Predicted Class | Pred. Cluster_0 | 185 | 4 | 7 | 94.39% |
| Pred. Cluster_1 | 7 | 423 | 31 | 91.76% | |
| Pred. Cluster_2 | 21 | 16 | 415 | 91.81% | |
| Recall Class | 86.85% | 95.49% | 91.61% | ||
Table 7: Decision Tree Model
| Stage 4.1 > 3.5
| Stage 3.6 > 3.5 | | Stage 3.1 > 2.5 | | | Stage 3.5 > 3.5: cluster_2 {cluster_2=268} | | | Stage 3.5 ≤ 3.5 | | | | Stage 3.3 > 3.5: cluster_2 {cluster_0=1, cluster_2=56, cluster_1=3} | | | | Stage 3.3 ≤ 3.5 | | | | | Stage 3.1 > 3.5: cluster_2 {cluster_2=11, cluster_1=3} | | | | | Stage 3.1 ≤ 3.5: cluster_1 {cluster_1=3} | | Stage 3.1 ≤ 2.5: cluster_2 {cluster_0=1, cluster_2=3} | Stage 3.6 ≤ 3.5 | | Stage 1.4 > 2.5 | | | Stage 1.3 > 2.5 | | | | Stage 3.2 > 2.5 | | | | | Stage 3.5 > 3.5: cluster_2 {cluster_0=1, cluster_2=25, cluster_1=5} | | | | | Stage 3.5 ≤ 3.5: cluster_1 {cluster_0=6, cluster_2=30, cluster_1=423} | | | | Stage 3.2 ≤ 2.5: cluster_0 {cluster_0=3} | | | Stage 1.3 ≤ 2.5 | | | | Stage 1.4 > 4: cluster_2 {cluster_2=2} | | | | Stage 1.4 ≤ 4: cluster_0 {cluster_0=8} | | Stage 1.4 ≤ 2.5: cluster_0 {cluster_0=4} Stage 4.1 ≤ 3.5 | Stage 4.4 > 4.5: cluster_2 {cluster_0=1, cluster_2=29, cluster_1=1} | Stage 4.4 ≤ 4.5 | | Stage 1.4 > 4.5 | | | Stage 3.2 > 3.5: cluster_2 {cluster_2=9} | | | Stage 3.2 ≤ 3.5: cluster_0 {cluster_0=2,} | | Stage 1.4 ≤ 4.5 | | | Stage 2.3 > 4.5: cluster_2 {cluster_0=1, cluster_2=3} | | | Stage 2.3 ≤ 4.5 | | | | Stage 1.2 > 3.5 | | | | | Stage 3.1 > 3.5: cluster_2 {cluster_0=10, cluster_2=16, cluster_1=1} | | | | | Stage 3.1 ≤ 3.5: cluster_0 {cluster_0=18, cluster_1=1} | | | | Stage 1.2 ≤ 3.5: cluster_0 {cluster_0=157, cluster_2=1, cluster_1=3} |
4.2. Model Testing Results
From the results of the prototype model development, it can be concluded that the model with the highest accuracy is the development of the model from k-means clustering, with the appropriate number of 3 clusters and the leave-one-out cross-validation result with an accuracy of 92.25%. Details of the testing developed model are shown in Table 6.
4.3. Model Applying Results
From the model that has been selected and demonstrated the performance of the model, this section shows the decision tree model in Table 7; the decision tree rules for self-testing is shown in Table 8, and the centroid of each cluster is shown in Table 9. In addition, a summary of the members from the collected datasets described by source classified by cluster. It is shown in Table 10.
Table 7 shows the decision tree models, which are the selected models from the tests in Table 8 and Table 9.
Table 8: Model Applying Results
| Rule | Condition (If) | Prediction (Then) |
| 1 | If Stage 4.1 > 3.5 and Stage 3.6 > 3.5 and Stage 3.1 > 2.5 and Stage 3.5 > 3.5 | Then, suitable for cluster_2 = 100% |
| 2 | If Stage 4.1 > 3.5 and Stage 3.6 > 3.5 and Stage 3.1 > 2.5 and Stage 3.5 ≤ 3.5 and Stage 3.3 > 3.5 | Then, suitable for cluster_0 = 1.67%, suitable for cluster_1 = 5.00%, and suitable for cluster_2 = 93.33%. |
| 3 | If Stage 4.1 > 3.5 and Stage 3.6 > 3.5 and Stage 3.1 > 2.5 and Stage 3.5 ≤ 3.5 and Stage 3.3 ≤ 3.5 and Stage 3.1 > 3.5 | Then, suitable for cluster_1 = 21.43%, and suitable for cluster_2 = 78.57%. |
| 4 | If Stage 4.1 > 3.5 and Stage 3.6 > 3.5 and Stage 3.1 > 2.5 and Stage 3.5 ≤ 3.5 and Stage 3.3 ≤ 3.5 and Stage 3.1 ≤ 3.5 | Then, suitable for cluster_1 = 100% |
| 5 | If Stage 4.1 > 3.5 and Stage 3.6 > 3.5 and Stage 3.1 ≤ 2.5 | Then, suitable for cluster_0 = 25.00%, and suitable for cluster_2 = 75.00%. |
| 6 | If Stage 4.1 > 3.5 and Stage 3.6 ≤ 3.5 and Stage 1.4 > 2.5 and Stage 1.3 > 2.5 and Stage 3.2 > 2.5 and Stage 3.5 > 3.5 | Then, suitable for cluster_0 = 3.23%, suitable for cluster_1 = 16.13%, and suitable for cluster_2 = 80.65%. |
| 7 | If Stage 4.1 > 3.5 and Stage 3.6 ≤ 3.5 and Stage 1.4 > 2.5 and Stage 1.3 > 2.5 and Stage 3.2 > 2.5 and Stage 3.5 ≤ 3.5 | Then, suitable for cluster_0 = 1.31%, suitable for cluster_1 = 92.16%, and suitable for cluster_2 = 6.54%. |
| 8 | If Stage 4.1 > 3.5 and Stage 3.6 ≤ 3.5 and Stage 1.4 > 2.5 and Stage 1.3 > 2.5 and Stage 3.2 ≤ 2.5 | Then, suitable for cluster_0 = 100% |
| 9 | If Stage 4.1 > 3.5 and Stage 3.6 ≤ 3.5 and Stage 1.4 > 2.5 and Stage 1.3 ≤ 2.5 and Stage 1.4 > 4.0 | Then, suitable for cluster_2 = 100% |
| 10 | If Stage 4.1 > 3.5 and Stage 3.6 ≤ 3.5 and Stage 1.4 > 2.5 and Stage 1.3 ≤ 2.5 and Stage 1.4 ≤ 4.0 | Then, suitable for cluster_0 = 100% |
| 11 | If Stage 4.1 > 3.5 and Stage 3.6 ≤ 3.5 and Stage 1.4 ≤ 2.5 | Then, suitable for cluster_0 = 100% |
| 12 | If Stage 4.1 ≤ 3.5 and Stage 4.4 > 4.5 | Then, suitable for cluster_0 = 3.23%, suitable for cluster_1 = 3.23%, and suitable for cluster_2 = 93.55%. |
| 13 | If Stage 4.1 ≤ 3.5 and Stage 4.4 ≤ 4.5 and Stage 1.4 > 4.5 and Stage 3.2 > 3.5 | Then, suitable for cluster_2 = 100% |
| 14 | If Stage 4.1 ≤ 3.5 and Stage 4.4 ≤ 4.5 and Stage 1.4 > 4.5 and Stage 3.2 ≤ 3.5 | Then, suitable for cluster_0 = 100% |
| 15 | If Stage 4.1 ≤ 3.5 and Stage 4.4 ≤ 4.5 and Stage 1.4 ≤ 4.5 and Stage 2.3 > 4.5 | Then, suitable for cluster_0 = 25.00%, and suitable for cluster_2 = 75.00%. |
| 16 | If Stage 4.1 ≤ 3.5 and Stage 4.4 ≤ 4.5 and Stage 1.4 ≤ 4.5 and Stage 2.3 ≤ 4.5 and Stage 1.2 > 3.5 and Stage 3.1 > 3.5 | Then, suitable for cluster_0 = 37.04%, suitable for cluster_1 = 3.70%, and suitable for cluster_2 = 59.26%. |
| 17 | If Stage 4.1 ≤ 3.5 and Stage 4.4 ≤ 4.5 and Stage 1.4 ≤ 4.5 and Stage 2.3 ≤ 4.5 and Stage 1.2 > 3.5 and Stage 3.1 ≤ 3.5 | Then, suitable for cluster_0 = 94.74%, and suitable for cluster_1 = 5.26%. |
| 18 | If Stage 4.1 ≤ 3.5 and Stage 4.4 ≤ 4.5 and Stage 1.4 ≤ 4.5 and Stage 2.3 ≤ 4.5 and Stage 1.2 ≤ 3.5 | Then, suitable for cluster_0 = 97.52%, suitable for cluster_1 = 1.86%, and suitable for cluster_2 = 0.62%. |
Correct: 1040 out of 1109 training examples (93.78%).
Table 8 shows the model test results using the collected data. It shows the validity and suitability of the model at 93.78%, which concludes nicely that the selected model is reasonable.
Table 9: Average within Centroid for each cluster
| Stage and Cluster | ||||
| Stages | Cluster_0 | Cluster_1 | Cluster_2 | |
| Student’s Context | Student’s Interests | |||
| Stage 1.1 | 3.19 | 3.72 | 4.15 | |
| Stage 1.2 | 2.94 | 3.62 | 4.23 | |
| Stage 1.3 | 3.03 | 4.24 | 3.85 | |
| Stage 1.4 | 3.11 | 3.81 | 4.16 | |
| Stage 1.5 | 3.15 | 3.60 | 3.88 | |
| Student’s Characteristics | ||||
| Stage 2.1 | 3.20 | 3.72 | 4.04 | |
| Stage 2.2 | 3.15 | 3.52 | 3.98 | |
| Stage 2.3 | 3.30 | 3.58 | 4.04 | |
| Stage 2.4 | 2.81 | 3.06 | 4.03 | |
| Student’s Environment | ||||
| Stage 3.1 | 2.87 | 3.48 | 4.09 | |
| Stage 3.2 | 3.14 | 4.33 | 4.15 | |
| Stage 3.3 | 2.94 | 2.88 | 3.81 | |
| Stage 3.4 | 3.07 | 3.04 | 4.13 | |
| Stage 3.5 | 3.00 | 2.67 | 3.83 | |
| Stage 3.6 | 3.11 | 2.72 | 4.23 | |
| Program’s Context | Program’s Context | |||
| Stage 4.1 | 3.01 | 4.36 | 4.29 | |
| Stage 4.2 | 3.54 | 4.18 | 4.33 | |
| Stage 4.3 | 3.37 | 4.08 | 4.22 | |
| Stage 4.4 | 3.23 | 3.67 | 4.17 | |
| Total Number of Items: 1109 | 213 Items | 443 Items | 453 Items | |
Table 9 shows the average within centroid for each cluster. The benefit of this study and Table 9 is that it can be used to recommend suitable educational institutions according to the learner interest clusters. In addition, a classification of interest clusters by educational institutions is presented in Table 10.
Table 10 shows the details of the data collected by classification for the groups analyzed in the study. It was discovered that clusters of members from the collected datasets were unclearly distributed. Therefore, in future research, the researcher should suggest research tools to improve the more balanced distribution of datasets.
Table 10: Details of Each Cluster from Data Collection
| Institutions | Data Collection | ||
| Cluster_0 | Cluster_1 | Cluster_2 | |
| MSU: Maha Sarakham University |
72 Items | 171 Items | 103 Items |
| RMU: Rajabhat Mahasarakham University |
58 Items | 223 Items | 197 Items |
| UP: University of Phayao |
83 Items | 49 Items | 153 Items |
| Total Number of Items: 1109 | 213 Items | 443 items | 453 items |
However, the data collection were 1109 people who provided attitudes and satisfaction to the research. It can be concluded that the overall level of satisfaction with the study is accepted (average = 3.70, S.D. = 0.84), as shown in Table 3.
In addition, the prototype model has been developed for predicting and recommending the appropriate institutions for the learner, which has moderate accuracy levels (92.25%) shown in Table 4 and Table 6. Moreover, the results of the self-test data model are very accurate at the highest level, which is equal to 93.78% (Correct: 1040 out of 1109 training examples) as shown in Table 7. Therefore, it can be concluded that this study was successful. It can develop highly accurate models and also have high performance model testers.
5. Conclusions
From this research, the researcher can summarize according to the research objectives as follows: (1) to study the relevance of factors for the analysis of the effectiveness of suitable educational institutions, and (2) to identify the acceptance and tolerance of each attribute, which supports lifelong learning.
The conclusion was obtained from the study of the relevance of factors by using machine learning tools and data mining techniques in the development of prototype models. It was discovered that the developed model is highly effective, with the ability to summarize 11 predictive factors: stage 1.2, stage 1.3, stage 1.4, stage 2.3, stage 3.1, stage 3.2, stage 3.3, stage 3.5, stage 3.6, stage 4.1, and stage 4.4 as shown in Table 7. While studying factors acceptance, it was found that the overall level of acceptance was at a medium level (average = 3.70, S.D. = 0.84). When the researcher has considered all dimensions, it was found that all factors had been accepted, as shown in Table 3. With the research study by collecting a total data of 1109 people from three universities (Rajabhat Mahasarakham University, the Maha Sarakham University, and the University of Phayao), the researcher concluded that this research achieved its objectives with five machine learning tools and data mining techniques: k-means, k-medoids, decision tree, cross-validation methods, and confusion matrix.
For future research, the researchers aim to construct and develop applications that promote and support the findings of this research.
Conflict of Interest
The authors declare no conflict of interest.
Acknowledgment
This research is supported by the two organizations: (1) The Faculty of Information Technology, Rajabhat Mahasarakham University, Maha Sarakham, Thailand. (2) The School of Information and Communication Technology, University of Phayao, Phayao, Thailand. The researchers would like to thank the advisor, lecturers, students, technicians, and all respondents for their entire support.
- U.N. Desa, “Transforming our world: The 2030 agenda for sustainable development,” 2016.
- W. Nuankaew, P. Nuankaew, S. Bussaman, P. Tanasirathum, “Hidden academic relationship between academic achievement and higher education institutions,” in 2017 International Conference on Digital Arts, Media and Technology (ICDAMT), 308–313, 2017, doi:10.1109/ICDAMT.2017.7904982.
- F. Bellotti, R. Berta, A. De Gloria, E. Lavagnino, A. Antonaci, F. Dagnino, M. Ott, M. Romero, M. Usart, I.S. Mayer, “Serious games and the development of an entrepreneurial mindset in higher education engineering students,” Entertainment Computing, 5(4), 357–366, 2014.
- S. Fungchomchoei, U. -maporn Kardkarnklai, “Exploring the intercultural competence of Thai secondary education teachers and its implications in English language teaching,” Procedia-Social and Behavioral Sciences, 236, 240–247, 2016.
- A. Navy, “Higher Education Reform In Thailand: Toward Quality Improvement And University Autonomy,” KATHA-The Official Journal of the Centre for Civilisational Dialogue, 9(1), 1–16, 2013.
- M. Flavin, “Disruptive technologies in higher education,” Research in Learning Technology, 20, 2012, doi:10.3402/rlt.v20i0.19184.
- S. Gallagher, G. Garrett, “Disruptive education: Technology-enabled universities,” The United States Studies Centre at the University of Sydney, 2013.
- P. Nuankaew, P. Temdee, “Online Mentoring Model by Using Compatible Different Attributes,” Wireless Personal Communications, 85(2), 565–584, 2015, doi:10.1007/s11277-015-2755-x.
- P. Nuankaew, P. Temdee, “Determining of compatible different attributes for online mentoring model,” in 2014 4th International Conference on Wireless Communications, Vehicular Technology, Information Theory and Aerospace Electronic Systems (VITAE), 1–5, 2014, doi:10.1109/VITAE.2014.6934434.
- K. Pupara, W. Nuankaew, P. Nuankaew, “An institution recommender system based on student context and educational institution in a mobile environment,” in 2016 International Computer Science and Engineering Conference (ICSEC), 1–6, 2016, doi:10.1109/ICSEC.2016.7859877.
- P. Nuankaew, “Dropout Situation of Business Computer Students, University of Phayao,” International Journal of Emerging Technologies in Learning (IJET), 14(19), 115–131, 2019.
- P. Nuankaew, W. Nuankaew, K. Phanniphong, S. Imwut, S. Bussaman, “Students Model in Different Learning Styles of Academic Achievement at the University of Phayao, Thailand,” International Journal of Emerging Technologies in Learning (IJET), 14(12), 133–157, 2019.
- W.S. Nuankaew, P. Nuankaew, D. Teeraputon, K. Phanniphong, S. Bussaman, “Perception and Attitude Toward Self-Regulated Learning of Thailand’s Students in Educational Data Mining Perspective,” International Journal of Emerging Technologies in Learning (IJET), 14(09), 34–49, 2019.
- P. Nuankaew, W. Nuankaew, K. Phanniphong, R. Fooprateepsiri, S. Bussaman, “Analysis Dropout Situation of Business Computer Students at University of Phayao,” in: Auer, M. E., Hortsch, H., and Sethakul, P., eds., in The Impact of the 4th Industrial Revolution on Engineering Education, Springer International Publishing, Cham: 419–432, 2020, doi:10.1007/978-3-030-40274-7_42.
- P. Nuankaew, W. Nuankaew, T. Thamma, “The Recommended System for the Relationship between Educational Programs and Students’ Interests,” in International Conference on Digital Arts, Media and Technology, 2-3A-4: 34, 2016.
- J. Witte, “Education in Thailand after the crisis: A balancing act between globalization and national self-contemplation,” International Journal of Educational Development, 20(3), 223–245, 2000.
- N. Omar, M.M. Mohamad, A.N. Paimin, “Dimension of learning styles and students’ academic achievement,” Procedia-Social and Behavioral Sciences, 204, 172–182, 2015.
- P.R. Medwell, P.N. Grimshaw, W.S. Robertson, R.M. Kelso, “Developing sports engineering education in Australia,” Procedia Engineering, 34, 260–265, 2012.
- A. Rezvanfar, M. Ghorbanian, F. Shafiee, “An investigation of the behaviour of agricultural extension and education engineering students in Tehran University towards employability,” Procedia-Social and Behavioral Sciences, 152, 65–69, 2014.
- S. Rongraung, S. Kanokorn, “Soft skills for private Ba,” Procedia-Social and Behavioral Sciences, 112, 956–961, 2014.
- W. Techataweewan, U. Prasertsin, “Development of digital literacy indicators for Thai undergraduate students using mixed method research,” Kasetsart Journal of Social Sciences, 39(2), 215–221, 2018.
- P. Nuankaew, W. Nuankaew, P. Temdee, “Institution recommendation using relationship optimisation between program and student context,” International Journal of Higher Education and Sustainability, 2(4), 279–302, 2019.
- R. Wirth, J. Hipp, “CRISP-DM: Towards a standard process model for data mining,” in Proceedings of the 4th international conference on the practical applications of knowledge discovery and data mining, Citeseer: 29–39, 2000.
- P. Chapman, J. Clinton, R. Kerber, T. Khabaza, T. Reinartz, C. Shearer, R. Wirth, “CRISP-DM 1.0: Step-by-step data mining guide,” SPSS Inc, 9, 13, 2000.
- G. Hamerly, J. Drake, Accelerating Lloyd’s algorithm for k-means clustering, Springer: 41–78, 2015.
- H.-S. Park, C.-H. Jun, “A simple and fast algorithm for K-medoids clustering,” Expert Systems with Applications, 36(2), 3336–3341, 2009.
- Silhouettes: A graphical aid to the interpretation and validation of cluster analysis, Journal of Computational and Applied Mathematics, 20, 53–65, 1987, doi:10.1016/0377-0427(87)90125-7.