Comparison by Correlation Metric the TOPSIS and ELECTRE II Multi-Criteria Decision Aid Methods: Application to the Environmental Preservation in the European Union Countries

Adv. Sci. Technol. Eng. Syst. J. 5(5), 1064–1074 (2020);
 DOI: 10.25046/aj0505131
This article is part of the field of Multi-Criteria Decision Aid (MCDA), where several criteria must be considered in decision making. All criteria are generally as varied as possible and express different dimensions, and aspects of the decision problem posed. For more than four decades, several MCDA methods have emerged and have been applied perfectly to solve a large number of multi-criteria decision problems. Several studies have tried to compare these methods directly with one another. Since each method has its disadvantages and advantages, a direct comparison between the two methods is normally far from common sense and becomes subjective. In this article, we propose a rational and objective approach that will be used to compare the methods between them. This approach consists of using the famous correlation measure to evaluate the quality of the results obtained by different MCDA approaches. To prove the effectiveness of the proposed approach, experimental examples, as well as a study of real cases, will be studied. Indeed, a set of indicators, known as The Europe 2020 indicators, are defined by the European Commission (EC) to control the smart, sustainable and inclusive growth performance of the European Union countries (EU). In this proposed real study, a subset of indicators is used to compare the performance of environmental preservation and protection of the EU states. For this, the two-renowned methods MCDA ELECTRE II and TOPSIS are used to classify from the best to the worst CE countries with regard to environmental preservation. The results of the experiment that the proposed ranking quality measure is significant. For the case study shows that the ELECTRE II method results in a better ranking than that obtained by the TOPSIS method.
1. Introduction
This present article is an extension of the paper published at the international conference IRASET’20 [1]. In this article, we have shown the importance of the correlation metric to evaluate the quality of the ranking results of the MCDA methods. In this paper, we will suggest an extension of the measurement of quality, this time considering the relative importance of the criteria selected. Indeed, in numerous multi-criteria decision problems, the decision-makers (DMs) do not have the same vision and the same levels of importance of the criteria, which is naturally given the priorities of the choices are not always equal and even sometimes conflicting.
For taking into consideration the criteria importance, the MCDA methods use a weighting system, represented by a set W, in which the highest weight is assigned to the most important criterion, and the lowest weight is assigned to the least important criterion. The difference between the MCDA methods lies in the approach used to aggregate the criteria with their weights to select the best choice with regard to the criteria considered.
Nowadays, the field of MCDA has known a remarkable abundance of methods which have emerged and applied to several areas [2], [3] such as Human Resources, Health, Industry and Logistic Management, Economy Management, Energy Management, Water Resources Management, the Environment Management, and recently some methods are used in applications on the fight against Covid19 [4]. Generally, an MCDA problem is defined by considering a finite set A of n alternatives, where each alternative is described by a family F of m criteria. In MCDA discipline, three obvious problematics are possible. The first allows ranking the set A from the best to the bad alternative, known as Ranking Problematic. The second consists in classifying the set A into predefined classes, called Sorting Problematic. Finally, in the third decision problem, we find to select the best alternative, known as Choice Problematic. In this article, we discuss the ranking problematic. Prospects are possible to apply the results of this paper to the other two problematics.
For the same ranking problematic, there are many MCDA methods are proposed in multi-criteria analysis literature, each with its resolution process as well as its advantages and disadvantages [5]. Thus, for a given multi-criteria ranking problem, the DM obtains several proposals for ranking solutions, and it becomes not obvious to opt objectively for a single solution.
The approach proposed in this work allows us to remedy this inconvenience of the choice embarrassment of ranking solutions. Indeed, a metric will be defined to evaluate the quality of each ranking solution obtained. The ranking which gives a better quality will, therefore, be retained. In the first version of the proposed metric [1] no reference was made to the importance of the criteria. It was supposed that all the criteria are treated with the same importance, i.e. each criterion is not considered more interesting than others. In this paper, we extend this metric for measuring the quality of a ranking to the general case where all the criteria do not necessarily have the same importance.
The proposed correlation metric not only can be used to distinguish the best ranking among several results of the MCDA methods, but it can also be used to guide and help the DM to perform the robustness analysis. The latter is a primordial activity and highly recommended in the multi-criteria analysis [6]. Indeed, the primary motivation for this activity is since the data provided by the DMs are often subject to uncertainty and imprecision, in particular at the level of the choice of the parameters required by specific MCDA methods is not sometimes obvious for DMs, as in the case of criteria weights [7]. The uncertain and imprecise choices of parameters will undoubtedly have repercussions on the quality of the final result. The robustness analysis then consists in verifying the stability of the results by testing a set of slightly different values of parameters. The metric thus proposed could help to compare objectively all the results obtained by the robustness analysis.
Intending to prove and illustrate the significance and importance of the ranking quality measure, we propose a real case study that aims to rank the European Union countries according to the level of preservation environmental. In fact, a set of indicators are defined and monitored by the European Commission, known as Europe 2020 indicators, to compare and control the smart sustainable and inclusive growth performance of all the EU countries (http://epp.eurostat.ec.europa.eu/portal/page/portal/europe_2020_indicators/headline_indicators). In the proposed case study, a subset of indicators is selected as criteria, and all relate to environmental performance. As for the example of these indicators: “Waste generated except main mineral waste”, “Recycling rate of e-waste”, “Exposure to PM10 pollution”, “Exposure of the urban population to air pollution by fine particles”, “Final energy consumption”, “Greenhouse gas emissions”, “Share of renewable energies”, and etc. A total of 11 indicators are selected. In first exploitation, these indicators are used by the two-popular methods MCDA ELECTRE II and TOPSIS to rank and evaluate the environmental performance of the EU countries. All results obtained are compared based on quality measurement.
The case study remains valid and open to all other MCDA ranking methods. The choice of methods used in this paper is only illustrative.
The rest of the article is structured as follows. In the second section, a brief reminder will be given on MCMA methods. In section III, a reminder of the ELECTRE II and TOPSIS methods will be presented. Section IV presents the case study to rank the EU countries according to the environmental preservation performance. In section V, we will present the extension of the ranking quality measurement approach. In section VI, all the numerical experiments for the test example and the case study will be detailed. Lastly, the paper will be concluded with new and possible research axes.
2. Overview of MCDA methods
2.1. Background
Certainly, the decision-making is often multi-criteria, where several criteria are considered to find a solution, such as a better choice, a ranking or a sorting, according to the problematics mentioned above. The criteria adopted are often contradictory insofar as a better choice in relation to one criterion is not necessarily so for another criterion, as price and quality are two contradictory criteria. In addition, the criteria are not always expressed on the same measurement scale and can represent from different points of view [8]: such as political, military, economic, comfort, social, education, investment cost, environmental impact, etc.
In some MCDA methods, such as the Weighted Sum method [9] and TOPSIS method [3] all criteria are normalized and aggregated into a single criterion, called synthesis criterion, on the basis of which the final decision will be made. Note that any transformation of the criteria by normalization will not be innocent and will have an influence on the final solution. Indeed, the final solution may depend on the normalization operation used, so these methods are to be used with recklessness [10].
Nowadays, the MCDA field has experienced great progress both in theory and in application [11]. Many methods have emerged, each has its own approach to aggregate criteria, and each has its advantages and disadvantages. There are currently two main resolution processes [12].
The first process is known as the Synthesis Criteria Approach. The principle of the methods of this approach is to transform the multi-criteria problem into a simple mono-criterion problem, by the first normalization of all the criteria, and then an aggregation of all the normalized criteria into a single decision criterion. As an example of these methods, we find the method of the weighted sum (WSM) [7], [9], the method of programming by objective [13], TOPSIS method [3] and many other methods. In this paper, the TOPSIS method will be used. The second resolution process takes the name of outranking approach. Whose main idea is to develop a relationship, by comparing the alternatives two by two, named outranking relation and denoted by S. This relation S will be used in a second step of the process to find the compromise solution according to the problem to be solved: problematic choice, classification or sorting. There are numerous methods which are based on the principle of this approach, of which we cite the two popular methods: the methods family PROMETHEE (Preference Ranking Organization METHod for Enrichment of Evaluations) [14], and the methods family ELECTRE (Elimination And Choice Translating Reality) [15], [16]. In this paper, the ELECTRE method will be used and compared to the method TOPSIS.
The principal objective of the presented paper is to propose a rational tool to compare MCDA methods objectively. Several authors have tackled this question, but for the majority of them, they have tried to compare the methods directly according to their resolution processes. For example, we cite the works [17], [18]. The direct comparison between methods, for example, based on their own characteristics and the approach to which they belong, will undoubtedly be a devoid comparison of objectivity, as each method has its limitations and advantages. We propose to use the correlation metric as a tool to compare the results obtained by the ranking methods instead of a direct comparison.
2.2. The data necessary for an MCDA method
The data hypotheses of an MCDA problem are at least the set of n alternatives A, which contains all the possible solutions, and a set of m criteria F, which are the dimensions along which the alternatives will be evaluated.
The following Table 1, called the performance matrix M [16], summarizes all the data which we need in a decision problem.
Table 1: Sample Table
| Criteria | |||||||
| Weights | g1 | … | gj | … | gm | ||
| w1 | … | wj | … | wm | |||
| Min/Max | … | Min/Max | … | Min/Max | |||
| Alternatives | X1 | g1(X1) | … | gj(X1) | … | gm(X1) | |
| … | … | … | … | … | … | ||
| Xi | g1(Xi) | … | gj(Xi) | … | gm(Xi) | ||
| … | … | … | … | … | … | ||
| Xn | g1(Xn) | … | gj(Xn) | … | gm(Xn) | ||
In this paper, the following notations will be deployed:
- A = {X1, …, Xi, …,Xn} are the n
- F = {g1, …, gj, …, gm} are the m criteria, m ≥ 2.
- Min means that the criterion to be minimized
- Max means that the criterion to be maximized
- W ={w1, …, wj, …, wm} are the weights of criteria.
- gj(Xi) is the evaluation of the alternative Xi on the criterion gj.
3. The remainder of the MCDA ELECTRE II and TOPSIS methods
The ELECTRE II and TOPSIS methods are considered among the most widely used methods in the MCDA field. Several research works and real applications have successfully deployed these two methods [8], [19]. However, the two methods proceed differently. The ELECTRE II method is a method which is the basis of the outranking approach, while the TOPSIS method is a method which is part of the approach of the unique synthesis criterion. The common point between the two methods is that both are able to rank the alternatives of set A from the best alternative(s) to the bad alternative(s); moreover, they take as starting data the decision matrix M and a set W of criteria weights.
In this section, we present the algorithms of the two methods, which we will need for the case study.
3.1. The TOPSIS method
The TOPSIS method (Technique for Order Preference by Similarity to Ideal Solution) [3] is developed to rank all the alternatives of the set A from the best alternative(s) to the bad alternative(s). As shown in Figure 1, the TOPSIS method starts with a normalization of the decision matrix M, then it calculates a Euclidean distance between all the alternatives and two reference solutions Ab, and Aw, respectively called Ideal Solution and Anti-Ideal Solution. Then the similarity Swi, called the relative closeness, is calculated between each alternative Xi and the tow solutions Ab and Aw. Lastly, the alternatives are ranked according to the similarities Sw, thus calculated.
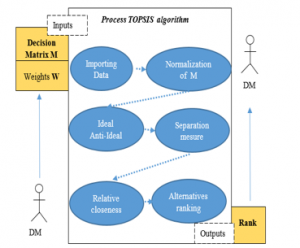
Figure 1: Process TOPSIS algorithm
TOPSIS algorithm proceeds in the following seven steps:
- Step 1: Establishment of the performance matrix
In the first step, we build the decision matrix M which is composed of m criteria and n alternatives, as shown in Table 1.
- Step 2: Normalization of the performance matrix
To compare the performances of the alternatives by the Euclidean distance, one of the conditions imposed by the TOPSIS method is that all the performances must be expressed on the same measurement scale. In this step, a normalization is then calculated. This normalization consists of replacing each performance gj(Xi) by an equivalent normalized performance calculated by the following equation 1.
![]()
For the rest of the decision process, the decision matrix M is therefore replaced by the new normalized matrix .
- Step 3: Construction of weighted normalized decision matrix T.
For taking into account the importance wj of criteria in the decision-making process, the matrix R is again replaced by a new matrix which is obtained by the following equation 2:
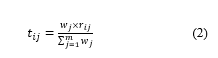
In equation 2, the performance of alternative Xi on criterion gj is reinforced by the weight of criterion gj. The performance will, therefore, be multiple depending on the importance of the criterion.
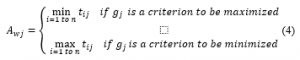
- Step 4: Calculation of the Ideal solution Ab and the anti-ideal solution Aw
In step 4, we determinate the worst solution Aw and the best solution Ab. For each criterion gj, we calculate the performances Abj and Awj by the following equations 3 and 4.
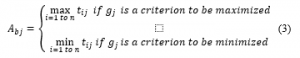
The worst solution Aw is calculated in an opposite way to the best solution Ab, it is obtained by the following formula 4.
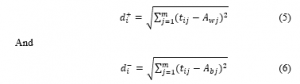
- Step 5: Calculation of the Euclidian distance between each action Xi and the Ab and Aw
We calculate by equations (5) and (6) the Euclidean distance between all the alternatives Xi and the solutions Aw and Ab.
- Step 6: Calculation the similitude coefficient Sw to Aw and Ab
For each action Xi, the similarity Swi, called the relative closeness, is calculated, by equation 7, between each action Xi and the Ideal Ab solution and the Anti-Ideal solution Aw. This similarity is the Euclidean distance between the action Xi and the Anti-Ideal Aw attenuated by the sum of the two distances from Xi to the solutions Aw and Ab. An alternative obtains so the best ranking when its similarity is better.
![]()
- Step 7: Rank the actions in descending order by similitude coefficient
Lastly, the actions are ranked from the best action to the bad action according to similarities swi (i=1,…, n) calculated.
In summary, the main idea of the TOPSIS method is an alternative will be better when it is closer to the Ideal Ab solution and further from the Anti-Ideal Aw solution.
2.3. ELECTRE II method
The ELECTRE family of methods currently has 6 different methods ELECTRE I, IS, II, III, VI, and ELECTRE TRI [8][10]. The six versions have the same principle of constructing an outranking relation in the first step of the method, and then its exploitation in the second step. However, the six ELECTRE methods are distinguished by the problem posed (choice, sorting or ranking), and whether the DM hesitates to prefer an alternative x to another alternative y, in the case where the alternatives have very similar performances.
In this article, we will compare the ELECTRE II method and the TOPSIS method on the basis of the real case study on environment preservation and the quality measurement of ranking.
The ELECTRE II method [10][12], like all the other versions, proceeds in two phases. In the first phase, two outranking relations S1 and S2 are developed. In the second phase, the relations S1 and S2 are exploited to rank the alternatives.
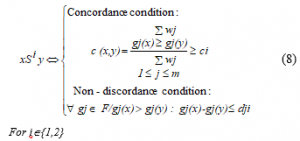
In the approach to developing the outranking relation, pairwise comparisons between pairs of alternatives (x, y) are performed. For all ELECTRE versions, the outranking relation S is developed as follows:
xSy, if two conditions are satisfied:
- x is better than y for most criteria (majority principle)
- without there being a criterion for which y has a preference much greater than that of x (principle of minority).
The two conditions of majority and minority are known as the concordance condition and the non-discordance condition.
- Step 1: Construction of relations S1 and S2
In ELECTRE II method, we construct two relations S1 and S2, such that S1 is included in S2, i.e.: if xS1y then x S2y. To do this we require two thresholds of concordance c1 and c2, and two thresholds of discordance, which all verify: c1>c2 and d1<d2.
The relation S1 is, therefore, more stringent than the relation S2, because the majority of criteria required to satisfy the condition of concordance in relation S1 is much larger than that required for the relation S2: c1>c2. In addition, the maximum acceptable difference to reject the discordance effect is too small in S1 and larger in S2: d1<d2.
The S1 and S2 outranking relations are called respectively the “strong outranking” relation and the “weak outranking” relation: x S1y ==> x S2y.
The concordance threshold defines the minimum majority required of the criteria that match the assertion of the outranking relation. As an example, a concordance threshold of 0.6 requires a majority of more than 60% of criteria to accept the concordance test.
However, the discordance threshold defines the maximum difference supported between the performance of two alternatives on a given criterion to accept the second discordance test.
The construction of the two outranking relations S1 and S2 is formulated by the following equation 8.
- Step 2: Exploitation of relations S1 and S2
After the construction in the first step of the two relations S1 and S2, we calculate two reverse pre-orders, the first, named P1, is obtained by exploring the graph, corresponding to the relation S1, from the root to the leaves. A second pre-order, named P2, is obtained by exploring the graph in the reverse direction, this time starting from the leaves towards the root. Then the two pre-orders P1 and P2 are combined to give a final median pre-order P of the form .
Lastly, the alternatives having obtained the same rank in the ranking median P, will be separated according to the second relation S2.
4. A real case application
The Europe 2020 indicators (http://epp.eurostat.ec.europa.eu/portal/page/portal/europe_2020_indicators/headline_indicators
) are set up and deployed by the European Commission (EC) in order to control the objectives of the strategy set out for smart, sustainable and inclusive growth in the member states of the European Union (EU). The objectives of sustainable growth aim for a more resource-efficient, greener, and more competitive economy. It is decided to achieve a 20% reduction in greenhouse gas emissions from 1990 levels, in addition, an increase in the share of renewable energy sources in energy consumption. All of the above objectives must be measurable and comparable. This is why the main indicators have been defined by the EC to facilitate the monitoring of the progress of the indicators in each member state, of which we cite:
- Greenhouse gas emissions;
- Share of renewable energies in gross final energy consumption;
- Contributions to eco-innovation;
- Waste management and recycling;
- Water management and production;
- Energy intensity of the economy;
- Employment rate by sex;
- Early leavers from education and training;
- The population at risk of poverty or exclusion;
- Integration rate of emigrants;
The different indicators can reflect the diversity of performance in each country. Also, they measure the level of progress of the goals over time and can, therefore, be used for comparison purposes at the European and international level.
In the case study presented in this paper, the study focuses on the level of ecological conservation performance and environmental preservation in the EU. For this, a subset of the Europe 2020 indicators is used. More precisely, all the indicators having a direct and indirect relationship with the environmental dimension are retained. The list of indicators selected is not exhaustive and remains the first exploitation of the institutional database developed and put online by Eurostat (https://ec.europa.eu/eurostat/).
The annual values recorded on the indicators cover several years from the years 1990 to the year 2018. For the indicators selected for the evaluation of environmental performance, we have deployed the latest data available on each indicator and each country. Some countries are excluded from the study because they lack information on certain indicators, such as Switzerland.
As shown below, there are a multitude and varied of conflicting indicators and not necessarily reducible into a single indicator. The multi-criteria approach is, therefore, essential to compare and classify European countries according to the different indicators. The European countries represent the set A of the alternatives, and the indicators constitute the set F of the criteria. The proposed problematic consists of ranking the EU member states, according to environmental performance. The decision matrix M is shown in Table 2, and a brief description of the criteria is given below.
Table 2: Performance matrix for selected indicators
| Country | Indicators | Criterion
g1 |
Criterion
g2 |
Criterion
g3 |
Criterion
g4 |
Criterion
g5 |
Criterion
g6 |
Criterion
g7 |
Criterion
g8 |
Criterion
g9 |
Criterion
g10 |
Criterion
g11 |
| Weights | MIN | MAX | MIN | MIN | MAX | MIN | MIN | MIN | MIN | MAX | MAX | |
| 1 | 1 | 1 | 1 | 1 | 1 | 1 | 1 | 1 | 1 | 1 | ||
| X1 | Germany | 1897 | 38.7 | 0.06 | 12.7 | 7.34 | 215.37 | 291.75 | 441.22 | 70.44 | 16.481 | 137 |
| X2 | Austria | 1886 | 50.1 | 3.77 | 13.8 | 24.08 | 27.91 | 31.8 | 50.65 | 102.66 | 33.426 | 119 |
| X3 | Belgium | 3383 | 38.6 | 0 | 12.9 | 6.56 | 36.33 | 46.84 | 71.37 | 82.67 | 9.423 | 83 |
| X4 | Bulgaria | 2527 | 68.8 | 77.59 | 23.8 | 2.56 | 9.91 | 18.36 | 26.76 | 57.16 | 20.528 | 50 |
| X5 | Croatia | 828 | 81.3 | 99.08 | 19 | 6.94 | 6.85 | 8.18 | 17.21 | 75.23 | 28.024 | 88 |
| X6 | Denmark | 1657 | 38.5 | 0 | 9.2 | 9.75 | 14.96 | 17.96 | 32.44 | 70.69 | 35.708 | 115 |
| X7 | Spain | 1480 | 41 | 1.32 | 12.1 | 9.28 | 86.84 | 124.63 | 202.66 | 119.74 | 17.453 | 105 |
| X8 | Estonia | 8965 | 69.8 | 0 | 5.3 | 20.57 | 2.96 | 6.17 | 6.34 | 49.98 | 29.996 | 81 |
| X9 | Finland | 2595 | 48.2 | 0 | 4.9 | 13.09 | 25.84 | 32.99 | 30.04 | 81.41 | 41.162 | 121 |
| X10 | France | 1455 | 36.6 | 0.39 | 12 | 7.01 | 146.61 | 238.91 | 343.07 | 83.1 | 16.593 | 112 |
| X11 | Greece | 1328 | 32.9 | 28.64 | 14.7 | 9.32 | 15.95 | 22.42 | 44.88 | 90.84 | 18.002 | 83 |
| X12 | Hungary | 1119 | 51.1 | 58.88 | 20.9 | 3.92 | 18.54 | 24.49 | 43.33 | 67.82 | 12.489 | 73 |
| X13 | Ireland | 1765 | 47.7 | 0 | 7.7 | 2.63 | 12.27 | 14.54 | 45.37 | 113.6 | 11.061 | 94 |
| X14 | Italy | 1799 | 32.1 | 49.28 | 19.4 | 15.17 | 116.47 | 147.24 | 274.75 | 84.41 | 17.775 | 112 |
| X15 | Latvia | 1065 | 40.6 | 3.78 | 13.6 | 14.47 | 4.18 | 4.69 | 9.18 | 45.95 | 40.292 | 82 |
| X16 | Luxembourg | 2697 | 45.5 | 0 | 11.2 | 4.39 | 4.35 | 4.46 | 9.09 | 94.16 | 9.059 | 138 |
| X17 | Netherlands | 2539 | 42.1 | 0 | 11.3 | 3.18 | 50.27 | 64.71 | 101.8 | 88.58 | 7.385 | 92 |
| X18 | Poland | 2090 | 36.1 | 70.09 | 23.8 | 3.33 | 71.93 | 101.06 | 217.98 | 87.42 | 11.284 | 59 |
| X19 | Portugal | 1148 | 43.5 | 0.89 | 12 | 5.93 | 16.91 | 22.64 | 40.75 | 118.9 | 30.322 | 101 |
| X20 | Romania | 1084 | 25 | 21.55 | 20.4 | 2.43 | 23.53 | 32.48 | 74.27 | 46.84 | 23.875 | 66 |
| X21 | United-Kingdom | 1813 | 42.2 | 0 | 10 | 2.64 | 134.67 | 176.27 | 329.4 | 61.59 | 11.017 | 110 |
| X22 | Slovakia | 1459 | 46.5 | 40.2 | 17.5 | 9.85 | 11.11 | 15.79 | 21.92 | 59.16 | 11.896 | 68 |
| X23 | Slovenia | 1457 | 33.4 | 4.81 | 19.7 | 10.01 | 4.98 | 6.67 | 10.98 | 94.35 | 21.149 | 107 |
| X24 | Sweden | 2136 | 47 | 0.16 | 5.4 | 20.29 | 32 | 46.78 | 32.69 | 75.28 | 54.645 | 132 |
| X25 | Czechia | 1214 | 46.5 | 31.12 | 18.4 | 14.76 | 25.32 | 40.39 | 64.11 | 64.82 | 15.15 | 100 |
* Source: The institutional sources of data are European Commission – Directorate-General for Environment (DG ENV)- Eco-innovation Observatory.
In this first analysis of the indicators, we consider that no criterion is privileged over the others. In other words, all the criteria have a weight equal to 1.
- Criterion 1: Waste generated except main mineral waste
This indicator is defined as all hazardous and non-hazardous waste produced in a country per year and per capita. The total annual number of kilograms of waste produced per person measures the indicator.
- Criterion 2: Recycling of electronic waste (e-waste)
This criterion e-waste is a rate which is estimated by multiplying the “collection rate” by the “reuse and recycling rate”.
The indicator is expressed as a percentage (%).
- Criterion 3: Exposure to PM10 pollution
This criterion expresses the percentage of citizens living in urban areas exposed to concentrations of particles <10 µm (PM10) exceeding the daily limit value (50 µg / m3).
The European Environment Agency collects air quality data on an annual basis.
- Criterion 4: Exposure of urban citizens to atmospheric pollution by fine particles
This criterion expresses the concentration of suspended particles PM10 and PM2.5 weighted according to the urban population potentially exposed to air pollution.
The particles PM10 and PM2.5 are harmful, and they can cause serious lung inflammation.
- Criterion 5: Agricultural area covered by organic farming
The criterion is expressed in terms of the share of the agricultural area using only organic farming. It is a criterion that we choose to maximize in the ranking.
- Criterion 6: Final energy consumption
By “final energy consumption” we mean the sum of the energy consumption of the transport industry in the residential sector, services, and agriculture. This quantity is relevant for measuring energy consumption in the last resort of energy use and for comparing it with the objectives of the Europe 2020 strategy. More information can be found on the statistics of energy savings on Statistics Explained.
This indicator is measured in millions of tons of oil equivalent (TOE)
- Criterion 7: Primary energy consumption
By “primary energy consumption” is meant gross domestic consumption with the exception of any non-energy use of energy products (e.g. natural gas used not for combustion but for the production of chemicals). This quantity is relevant for measuring actual energy consumption and for comparing it with the Europe 2020 targets.
This indicator is measured in millions of tons of oil equivalent (TOE)
- Criterion 8: Greenhouse gas emissions in the sectors included in the effort distribution decision
The calculation of the indicator is based on the emissions covered by the decision on shared effort 406/2009 / EC. The decision on the shared effort provides for annual quantified commitments for emissions not covered by the emissions trading system (ETS). The emissions governed by the decision are calculated by deducting the verified emissions relating to the ETS from the CO2 emissions associated with domestic flights and the NH3 emissions from the total national emissions.
- Criterion 9: Greenhouse gas emissions to the base year 1990
This indicator shows trends in total anthropogenic greenhouse gas emissions contained in the “Kyoto basket”. It presents the total annual emissions compared to 1990 emissions. The “Kyoto basket” includes the following greenhouse gases: carbon dioxide (CO2), methane (CH4), nitrous oxide (N2O), and so-called fluorinated gases (hydrofluorocarbons, per-fluorinated hydrocarbons, nitrogen trifluoride (NF3) and sulfur hexafluoride – SF6). These gases are grouped into a single unit according to specific factors corresponding to their global warming potential (GWP). Aggregate greenhouse gas emissions are expressed in CO2 equivalent units.
The EU as a whole is committed to reducing its greenhouse gas emissions by at least 20% by 2020 compared to 1990.
- Criterion 10: Use of renewable energies
This criterion expresses the level of use of renewable energies.
This indicator is then to be maximized in the ranking.
- Criterion 11: The eco-innovation index
The criterion is calculated on the basis of 16 sub-indicators from 8 data sources in 5 thematic areas: contributions to eco-innovation, eco-innovation activities, consequences of eco-innovation, results in terms of ‘efficient use of resources and socio-economic results.
The overall index of an EU country is evaluated by the average of these 16 sub-indicators. It shows how each country practices eco-innovation compared to the EU average.
This indicator is then to be maximized in the ranking.
5. The proposed approach to measure the quality of rankings
5.1. Process of the extension approach
For the extension of the quality measure of any ranking P, we propose to compare this ranking P to all the rankings induced by the criteria. Indeed, it is so easy to rank the alternatives on each criterion gk, and we baptize this rank by Pk. The quality measurement then makes it possible to measure the correlations between the P ranking and the various Pk rankings.
In practice, the rankings Pk and P are replaced by the comparison matrices Rk and R given by the equations 9 and 10. In order to consider the differences between the importance of the criteria, the final result of the comparisons is aggregated by a weighted average of the correlations between the R and Rk.
The approach proceeds in three steps: In the first step, the comparison matrices Rk induced by the different criteria gk are evaluated. In the second step, the comparison matrix R induced by the ranking P result of the MCDA method is evaluated. In the last step, all the matrices Rk are compared to the matrix R. The results of the comparison are then aggregated with the weighted average. The approach is presented as follows.
- Step 1: Compute the comparisons matrix Rk induced by the criterion gk
Let be the comparison matrix Rk induced by the criterion gk. This matrix is calculated by the formula 9.
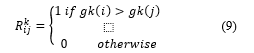
The matrix RK contains only the numbers 0 and 1. The value 1 means that the alternative i is preferred to the alternative j according to the criterion gk.
- Step 2: Compute the comparisons matrix R induced to the ranking P
The matrix R is calculated by formula 10.
![]()
The value 1 indicates that the action i is ranked before the action j for the MCDA method used.
- Step 3: Evaluate the quality for the ranking P
As the example E1 of the experiment section proves, a P ranking will be better if it follows the same direction of all the Pk rankings of the gk criteria. This amounts to measuring the dependence between the matrix R and each matrix Rk. The dependence between the matrices is measured mathematically by the correlation coefficient [1]. To take into account all the correlations calculated as well as the relative importance of the criteria W, the quality measure Q(P) is then calculated by a weighted average, which is given by the following formula (11).
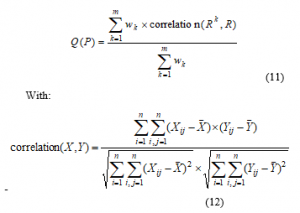
–X and Y are two square matrices of order n.
– is the empirical average a square matrix X of order n.
5.2. Propriety: Equivalence between P and R
Let P be a ranking and R the comparison matrix deduced from P. The matrix is given by the equations (1) or (2) and let Xi be any alternative of A.
The rank of Xi in P can be deduced from the matrix R and conversely. In other words, the vector P and the matrix R are equivalent. Indeed, by definition, from ranking P we can build the matrix R. Now, we suppose that we only have the matrix R. If for the alternative Xi we calculate the sum of all the values 1 on its line of the matrix R. Let L be this value, so we have L(Xi)= .
The value L(Xi) gives the number of alternatives that are classified behind Xi. The ranking P is obtained by sorting the alternatives Xi in decreasing order of the values L(Xi).
As an essential result of this propriety, it is that the comparison between two any comparison matrices R1 and R2 gives the same result as the direct comparison of the rankings P1 and P2 associated because as we have just demonstrated, the comparison matrices of and rankings are equivalent.
We will show in the discussion paragraph this equivalence at the base of the numerical results obtained by the case study.
6. Numerical experimentation and discussion
6.1. Numerical results of the experimentation example
To show that the metric of correlation proposed gives a significant result for the measurement of the quality of the rankings, we propose a sample of 15 varied rankings. In this example, we consider an MCDA problem of 3 criteria: F={g1, g2, g3}, and a set of four alternatives A={A1, A2, A3, A4}. For the simplification of the example, we propose that the three criteria give the same ranking: A1> A2> A3> A4, as shown in Table 2 below. This ranking expresses that the alternatives A1, A2, A3 and A4 are respectively in rank 1, 2, 3 and 4.
Moreover, we choose the three criteria with the same weighting w1=w2=w3=1.
Table 3: The criteria rankings P1, P2, and P3
| Alternatives/Rankings | P1(g1) | P2(g2) | P3(g3) |
| X1 | 1 | 1 | 1 |
| X2 | 2 | 2 | 2 |
| X3 | 3 | 3 | 3 |
| X4 | 4 | 4 | 4 |
The matrices R1, R2 and R3 induced by the three criteria g1, g2 and g3 are given by Table 4.
Table 4: Matrices induced by the criteria R1, R2, and R3
| X1 | X2 | X3 | X4 | |
| X1 | 0 | 1 | 1 | 1 |
| X2 | 0 | 0 | 1 | 1 |
| X3 | 0 | 0 | 0 | 1 |
| X4 | 0 | 0 | 0 | 0 |
The 15 rankings are chosen as an experiment to determine the significance of the proposed correlation metric. We have carefully chosen these rankings in order to cover almost all possible cases. Moreover, to show how the quality can vary according to these classifications choices. Table 4 gives all the rankings selected for the test.
In total, we propose two borderline cases of rankings with other intermediate cases. The first limit ranking is the ranking E1: X1>X2>X3>X4 which is the same as all the rankings given by the criteria g1, g2 and g3. The second limit ranking is the E15 ranking: X4> X3> X2> X1, which is the opposite of the three classifications given by the three criteria. The 13 other cases are the rankings intermediate where the alternatives permute their ranks between cases E1 and E15.
In this experiment, we also consider the case where the rankings can contain alternatives obtained from the same ranks. It is the case of the rankings E11, E12, E13 and E14.
Table 5 summarizes the calculated quality results for the 15 selected rankings. An interpretation of the results will be given in the following discussion section.
Table 5: Quality measurement for the 15 rankings
| Example number | Ranking P | Q(P) |
| E1 | X1>X2>X3>X4 | 1.0000 |
| E2 | X1>X3>X4>X2 | 0.4667 |
| E3 | X2>X1>X3>X4 | 0.7333 |
| E4 | X2>X3>X1>X4 | 0.4667 |
| E5 | X2>X3>X4>X1 | 0.2000 |
| E6 | X3>X1>X2>X4 | 0.4667 |
| E7 | X3>X2>X4>X1 | -0.0667 |
| E8 | X3>X4>X2>X1 | -0.3333 |
| E9 | X4>X1>X3>X2 | -0.0667 |
| E10 | X4>X2>X1>X3 | -0.0667 |
| E11 | X1>X2>X3=X4 | 0.8704 |
| E12 | X1>X2=X3=X4 | 0.6202 |
| E13 | X1=X2>X3>X4 | 0.8704 |
| E14 | X1=X2>X3=X4 | 0.7454 |
| E15 | X4>X3>X2>X1 | -0.6000 |
The graph illustrated by Figure 2 below represents the variation in the quality Q(P) of the 15 selected test rankings.
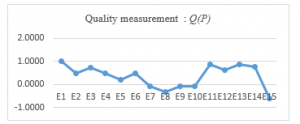
Figure 2: Graphical representation of variations of the quality measurement of rankings
The graph undoubtedly proves that the quality measure Q(P) is significant. Indeed, for the ideal-ranking, E1: X1>X2>X3>X4, which coincides with the three rankings induced by the three supposed criteria g1, g2 and g3, gives a maximum quality, which is worth Q(E1)=1. From more, the ranking E15: X4>X3>X2>X1, which is opposed to the three rankings induced by the three criteria g1, g2 and g3, gives the most inferior quality which is worth Q(E15)=-0.63. For all other cases of rankings, even for rankings with equal rank, the quality varies between 1 and -0.63. In addition, that depends on the ranks of the alternatives.
In summary, the quality remains close to the maximum value when the alternatives keep almost the same ranks of the rankings induced by the criteria. And, the quality becomes poorer when the alternatives score far from the ranks of the rankings induced by the criteria.
6.2. Numerical results of the study case
For the comparison and ranking of European countries according to performance and environmental preservation, we use the two methods TOPSIS and ELECTRE II at the base of the decision matrix M illustrated by Table 2. The rankings obtained by the two methods are given in Table 8.
Ranking of countries by the TOPSIS method
We calculate the swi similarities, given by equation 7, for each country. Then we rank the countries in descending order according to the swi scores thus calculated. The result of the ranking obtained by the TOPSIS method is given in Table 8.
Ranking of countries by the ELECTRE II method
The first step of the ELECTRE II method consists of calculating the matrix of concordance indices C(Xi, Xk), given by equation 8, for all pairs (Xi, Xk) of countries. Then, in the second step of the method, we build the two outranking relations S1 and S2, as indicated previously in the method remainder paragraph. For the concordance thresholds to be provided, we choose c1=0.8 and c2= 0.6. These values are the standard choices of several MCDA software. Moreover, for the discordance thresholds, we choose d1=60% of the extent of each criterion. Furthermore, d2=80% of the extent for each criterion, see Table 6.
The extent of a criterion gj is given by extent(gj)=Max(gj(a))-Min (gj (a))) for any a of A.
In MCDA, for the case of the ELECTRE method, it is strongly recommended to make a robustness analysis [6], which shows the stability of results. This analysis involves testing multiple values for the parameters required by the method, such as concordance and discordance thresholds, and seeing how the results obtained by the method may change depending on the parameter values used. For this reason, we choose the second test of discordance values. However, we keep the same concordance thresholds, because we obtained almost the same rankings for different values of concordance thresholds. The values used are the best thresholds which disperses the ranking of countries as much as possible.
Table 7 below summarizes all the parameters used for the ELECTRE II method. Furthermore, it gives two versions of results according to the parameters provided: ELECTRE II V1 and ELECTRE II V2.
Table 6: The discordance thresholds for d2 =80% for extent and d1 = 60% for extent
| Criterion 1 | Criterion 2 | Criterion 3 | Criterion 4 | Criterion 5 | Criterion 6 | Criterion 7 | Criterion 8 | Criterion 9 | Criterion 10 | Criterion 11 | |
| Extent | 8137.000 | 56.300 | 99.080 | 18.900 | 21.650 | 212.410 | 287.290 | 434.880 | 73.790 | 47.260 | 88.000 |
| d1 | 4882.20 | 33.78 | 59.45 | 11.34 | 12.99 | 127.45 | 172.37 | 260.93 | 44.27 | 28.36 | 52.80 |
| d2 | 6509.60 | 45.04 | 79.26 | 15.12 | 17.32 | 169.93 | 229.83 | 347.90 | 59.03 | 37.81 | 70.40 |
Table 7: Discordance and concordance thresholds
| Thresholds | ELECTRE II V1 | ELECTRE II V2 |
| d1 | 80% | 90% |
| d2 | 60% | 80% |
| c1 | 0.60 | 0.60 |
| c2 | 0.80 | 0.80 |
Table 8: Rankings obtained by the ELECTRE II and TOPSIS methods
| Code | County | Rank
TOPSIS |
Rank
ELECTRE II V1 |
Rank
ELECTRE II V2 |
| X24 | Sweden | 1 | 2 | 4 |
| X15 | Latvia | 2 | 1 | 2 |
| X2 | Austria | 3 | 6 | 6 |
| X9 | Finland | 4 | 2 | 3 |
| X6 | Denmark | 5 | 3 | 5 |
| X23 | Slovenia | 6 | 5 | 7 |
| X19 | Portugal | 7 | 5 | 5 |
| X16 | Luxembourg | 8 | 3 | 5 |
| X13 | Ireland | 9 | 8 | 9 |
| X25 | Czechia | 10 | 8 | 13 |
| X11 | Greece | 11 | 7 | 12 |
| X22 | Slovakia | 12 | 7 | 10 |
| X20 | Romania | 13 | 13 | 17 |
| X3 | Belgium | 14 | 12 | 15 |
| X8 | Estonia | 15 | 4 | 1 |
| X17 | Netherlands | 16 | 13 | 16 |
| X12 | Hungary | 17 | 9 | 14 |
| X7 | Spain | 18 | 13 | 18 |
| X4 | Bulgaria | 19 | 10 | 11 |
| X5 | Croatia | 20 | 3 | 8 |
| X21 | United-Kingdom | 21 | 11 | 17 |
| X18 | Poland | 22 | 16 | 22 |
| X14 | Italy | 23 | 14 | 19 |
| X10 | France | 24 | 14 | 21 |
| X1 | Germany | 25 | 15 | 20 |
Table 9: Comparison of ELECTRE II method to TOPSIS method
| Correlation between R and RK | ||||||||||||
| R1 | R2 | R3 | R4 | R5 | R6 | R7 | R8 | R9 | R10 | R11 | Q(P) | |
| ELECTRE II V1 | 0.10 | 0.35 | 0.18 | 0.33 | 0.32 | 0.54 | 0.57 | 0.68 | 0.10 | 0.48 | 0.17 | 0.35 |
| ELECTRE II V2 | -0.03 | 0.39 | 0.23 | 0.34 | 0.35 | 0.60 | 0.62 | 0.72 | 0.09 | 0.46 | 0.13 | 0.36 |
| TOPSIS | 0.04 | 0.14 | 0.22 | 0.28 | 0.32 | 0.37 | 0.43 | 0.48 | -0.04 | 0.38 | 0.21 | 0.26 |
Comparison of ELECTRE II method to TOPSIS method
All this work aims to show how quality measurement can be used as a rational tool to compare the results obtained by several methods objectively. This same tool can be used to compare the results of the robustness analysis, as is the case of the ELECTRE II V1 and ELECTRE II V2 versions. To choose the best ranking, we use the quality measure of rankings Q(P) given by equation 11. Table 9 gives the results of the comparison between the ELECTRE methods, for versions V1 and V2, and the TOPSIS method.
Where R is the comparison matrix of the ranking P result of the method. Rk is the comparison matrix induced by the criterion gk, with 1£k£11.
According to this Table 9, we can confirm that the ranking obtained by the ELECTRE II V2 method is the best ranking to be prescribed and recommended to the decision-maker.
According to the rankings results of the three methods ELECTRE II V1, ELECTRE II V2 and TOPSIS, almost all the most industrialized countries, such as Germany, France, and Italy, are placed at the end of the rankings, but more or less not with the same ranks in the three rankings. This result is well justified by the fact that most industrial and developed countries consume much energy and have high rates of carbon dioxide emissions CO2. Except for Sweden, Denmark and Austria, which are industrial countries, but according to the three rankings, they are considered among the top five most environmentally conservative countries in Europe.
According to the numerical results, the robustness analysis is very useful in the MCDA context, where the parameters are sometimes very vague and uncertain concerning the decision-maker. For example, the countries having obtained equal ranks, in the ELECTRE II V1 version, were separated into countries with different ranks in the ELECTRE II version, which gave the best ranking in terms of the measurement of quality Q(P).
7. Conclusions
In summary, this article has addressed the following contributions.
On the one hand, a quality measure at the base of the correlation metric of the matrices, which takes into account the relative importance is proposed. This proposed quality measurement is a rational tool for the decision-maker to compare the rankings results of several MCDA methods adopted for its decision problem to be solved.
On the other hand, in order to prove the significance of the proposed quality measure, an experimental test was tested. This example clearly showed the relevance of the proposed measure. In addition, a real application on the preservation of the environment in the countries of the European community was studied. This case study has been proposed to practically illustrate the meaning and relevance of quality measurement to compare MCDA methods. Two popular methods ELECTRE II and TOPSIS were used and compared on the basis of quality measurement. It turns out that the ELECTRE II method gives a better ranking.
Besides, it was shown that the quality measurement Q(P) could be very useful to support the decision-maker in the operation of the robustness analysis. An illustrated example of the robustness analysis has been done on the ELECTRE II method.
The results obtained in this article apply to the case of ranking methods. In our future works, we intend to use the metric for evaluating the quality of the rankings for the case of sorting and choosing problematics.
- M.C. Abounaima, F.Z. El Mazouri, L. Lamrini, N. Nfissi, N. El Makhfi, M. Ouzarf, “The Pearson Correlation Coefficient Applied to Compare Multi-Criteria Methods: Case the Ranking Problematic,” in 2020 1st International Conference on Innovative Research in Applied Science, Engineering and Technology, IRASET 2020, 2020, doi:10.1109/IRASET48871.2020.9092242.
- M. Aruldoss, “A Survey on Multi Criteria Decision Making Methods and Its Applications,” American Journal of Information Systems, 1(1), 31–43, 2013, doi:10.12691/ajis-1-1-5.
- M. Behzadian, S. Khanmohammadi Otaghsara, M. Yazdani, J. Ignatius, “A state-of the-art survey of TOPSIS applications,” Expert Systems with Applications, 39(17), 13051–13069, 2012, doi:10.1016/j.eswa.2012.05.056.
- O.S. Albahri, J.R. Al-Obaidi, A.A. Zaidan, A.S. Albahri, B.B. Zaidan, M.M. Salih, A. Qays, K.A. Dawood, R.T. Mohammed, K.H. Abdulkareem, A.M. Aleesa, A.H. Alamoodi, M.A. Chyad, C.Z. Zulkifli, “Helping doctors hasten COVID-19 treatment: Towards a rescue framework for the transfusion of best convalescent plasma to the most critical patients based on biological requirements via ml and novel MCDM methods,” Computer Methods and Programs in Biomedicine, 196, 105617, 2020, doi:10.1016/j.cmpb.2020.105617.
- S. Greco, M. Ehrgott, J.R. Figueira, Multiple Criteria Decision Analysis: State of the Art Surveys, Springer, 2016.
- H. Aissi, B. Roy, “Robustness in Multi-criteria Decision Aiding,” Trends in Multiple Criteria Decision Analysis, 87–121, 2010, doi:10.1007/978-1-4419-5904-1_4.
- G. Kumar, N. Parimala, “A Sensitivity Analysis on Weight Sum Method MCDM Approach for Product Recommendation,” in Distributed Computing and Internet Technology, Springer, Cham: 185–193, 2019, doi:10.1007/978-3-030-05366-6_15.
- K. Govindan, M.B. Jepsen, “ELECTRE: A comprehensive literature review on methodologies and applications,” European Journal of Operational Research, 250(1), 1–29, 2016, doi:10.1016/j.ejor.2015.07.019.
- J.R.S.C. Mateo, “Weighted Sum Method and Weighted Product Method,” Multi Criteria Analysis in the Renewable Energy Industry, 19–22, 2012, doi:10.1007/978-1-4471-2346-0_4.
- Bernard Roy, Denis Bouyssou, Aide multicritère méthodes et cas, Economica, Paris, 1993.
- E.K. Zavadskas, Z. Turskis, S. Kildienė, “State of art surveys of overviews on MCDM/MADM methods,” Technological and Economic Development of Economy, 20(1), 165–179, 2014, doi:10.3846/20294913.2014.892037.
- F.Z. El Mazouri, M.C. Abounaima, K. Zenkouar, “Data mining combined to the multicriteria decision analysis for the improvement of road safety: case of France,” Journal of Big Data, 6(1), 2019, doi:10.1186/s40537-018-0165-0.
- N. Vivekanandan, K. Viswanathan, S. Gupta, “Errata to: Optimization of cropping pattern using goal programming approach,” OPSEARCH, 47(1), 104, 2010, doi:10.1007/s12597-010-0007-0.
- M. Behzadian, R.B. Kazemzadeh, A. Albadvi, M. Aghdasi, “PROMETHEE: A comprehensive literature review on methodologies and applications,” European Journal of Operational Research, 200(1), 198–215, 2010, doi:10.1016/j.ejor.2009.01.021.
- I. Emovon, O.S. Oghenenyerovwho, “Application of MCDM method in material selection for optimal design: A review,” Results in Materials, 7, 100115, 2020, doi:10.1016/j.rinma.2020.100115.
- F.Z. El Mazouri, M.C. Abounaima, K. Zenkouar, A.E.H. Alaoui, “Application of the ELECTRE III Method at the Moroccan Rural Electrification Program,” International Journal of Electrical and Computer Engineering (IJECE), 8(5), 3285–3295, 2018, doi:10.11591/ijece.v8i5.pp3285-3295.
- M. Wang, S.-J. Lin, Y.-C. Lo, “The comparison between MAUT and PROMETHEE,” in 2010 IEEE International Conference on Industrial Engineering and Engineering Management, 753–757, 2010, doi:10.1109/IEEM.2010.5675608.
- J.M. Sánchez-Lozano, M.S. García-Cascales, M.T. Lamata, “Comparative TOPSIS-ELECTRE TRI methods for optimal sites for photovoltaic solar farms. Case study in Spain,” Journal of Cleaner Production, 127, 387–398, 2016, doi:10.1016/j.jclepro.2016.04.005.
- Y. Çelikbilek, F. Tüysüz, “An in-depth review of theory of the TOPSIS method: An experimental analysis,” Journal of Management Analytics, 7(2), 281–300, 2020, doi:10.1080/23270012.2020.1748528.