Understanding Risk Assessment in the Context of Fractional Ownership using Ethereum Smart Contract
Volume 5, Issue 5, Page No 1028-1035, 2020
Author’s Name: Mohamed Laarabia), Abdelilah Maach
View Affiliations
Mohammadia school of Engineers, Mohammed V University, Rabat, 10090, Morocco
a)Author to whom correspondence should be addressed. E-mail: laar.mohamedd@gmail.com
Adv. Sci. Technol. Eng. Syst. J. 5(5), 1028-1035 (2020); ![]() DOI: 10.25046/aj0505126
DOI: 10.25046/aj0505126
Keywords: Smart contracts, Block chain, Non-fungible assets, Risk Assessment

Export Citations
Ethereum smart contract system has seen a steady adoption as it continues to support tens of thousands of contracts. This feature has evolved to give a practical shape to the ideas leading up to fractional ownership transfer, using advanced smart contracts such as ERC-981. However, alongside its numerous benefits, various risks arise with the actual implementation of the ERC-981. This paper documents high-level processes and risk factors involved in the transfer-system, building a theoretical risk model based on Electre Tri-framework belonging to MCDA classification/sorting models. This model deals with detecting problems that are pre-defined on a central reference. The approach is illustrated through several stages: following comparison between the methods of risk analysis towards a risk assessment model, proposing recommendations and solutions. The framework was able to detect 18 major risks and bugs assigned to 6 categories.
Received: 31 July 2020, Accepted: 27 September 2020, Published Online: 20 October 2020
1. Introduction
In the past, the value of fractional ownership of assets (such as the right of publicity, trade secrets, copyrights, software, and real estates) have had little to no understanding as an asset, leading in some cases to a determination of having no value as assets. [1]. Fractional ownership of assets has been classified as “intangible” on corporate balance sheets regarding intellectual rights, such as products and technologies based in large portions upon such intellectual property [2]. They have also frequently been assigned little or no concrete value.
In large measures, placing a value on a co-ownership of the property has been difficult [1], and has led to some confusion over the valuation of the property at the time of selling, leading to the conventional diminution of value placed on the property.
Fractional ownership transfer is one of the most complex-prone operations. Many attempts have been made to develop dependable and accurate selling methods and evaluation for co-ownership of property assets, most unsuccessful because of the long process and the huge risk associated with the transaction.
However, selling a property for co-ownership is becoming a main target for the new era of decentralized ledger technologies using blockchain plate forms and as a base for developing larger multi-unit projects such as (tokenization, colored coins) [3]. Addressing multiple complications in the design of the contract, aiming to reduce unnecessary costs and time expenditure while enhancing transparency, by using this technology it becomes possible to tokenize existing financial assets – equities, debt instruments, the share of investment funds, or real estate by representing them in the form of tokens.
The decentralized ledger is a design pattern that underpins the Bitcoin cryptocurrency it can be described as a ledger of any transactions or contracts maintained in decentralized form across different levels [3]. However, its capacity to validate interaction amongst participant nodes is a vital key enabler for participants that require mutually distrusting peers to conduct their affairs. One such use is the smart contract, designed to encode rules to reflect any kind of multi-party interaction [4]. With the huge amount of investment in the decentralized ledger technologies, especially blockchain, and its rapid evolution as a trend towards being accepted as a new solution to record, share and synchronize transactions in their respective electronic ledgers [5]. Ethereum smart contracts are becoming the preferred mechanism to implement a wide range of applications, including financial instruments (e.g., Ether, mining, and saving wallets.).
A smart contract is a program that runs on the block chain and has its correct execution enforced by the consensus protocol. A contract can encode any set of rules represented in its programming language, offering new solutions such as [6]:
- ERC20: for fungible assets,
- ERC721: for non-fungible tokens, used for collectibles and games,
- ERC777: for fungible tokens, provide a new use and building on past learnings that match with ERC20,
- ERC1155: allowing for a single smart contract to represent multiple fungible and non-fungible tokens.
However, despite the expressiveness of the smart contracts, the present form of these technologies lacks transactional privacy. There are numerous risks that need to be identified and documented when going through the process of tokenizing an asset and selling it. The entire sequence of actions taken in a smart contract is propagated across the network and/or recorded on the blockchain and therefore are publicly visible [7]. Even though parties can create new pseudonymous public keys to increase their anonymity, the values of all transactions and balances for each (pseudonymous) public key are publicly visible [8].
The main purpose of this study is to document several new zones and factors of risks and bugs on the Ethereum’s smart contracts as well as the whole tokenization process.
We formalize a theoretical decision framework alongside with a risk assessment model, proposing recommendations and solutions for the documented risks. We provide a new approach of handling co ownership of property, a frame work able to detect major risks and bugs.
The rest of the article is organized as follows: Section 2 provides a review of risks and deferent methods of risk assessment alongside with MCDA classification/ sorting techniques to handle fractional rights. Section 3 the contextual setting and the main risk factors. Section 4 presents applications of these techniques in a framework that can be used in a risk assessment model for real cases, as well as listing some multi-criteria decision that supports the transfer of fractional rights using smart contract which can be developed for classification and sorting model development in general. In Section 5, we will be discussing the results and provide a summary. Finally, section 6 concludes the paper and discusses some interesting future research extensions and directions.
2. Related work and Open Challenges
The concept of tokenization is not recent. In monetics, tokenization is the process of substituting bank data (card number) with disposable data called “tokens”. This solution helps to reassure the wearer especially in payment on the Internet or in NFC. For the trader, this is a way to reduce the perimeter of PCI-DSS since no sensitive items will be stored in his information system. For the bearer’s bank (issuer), it is simply a way to reduce fraud [3].
the author mainly explains that the process of tokenization is highly promising for illiquid assets: their valuation is now sanctioned by low rate of liquidity in important proportions (which he calculate at “25% to 35 %”). Tokenization will increase market depth by opening markets to more participants, resulting in more exchanges. Traditional assets will be tokenized because they will lose the liquidity premium if they do not (such as real estate, residential assets, or artistic works), therefore, individuals could collectively acquire a valuable painting for a local museum through a sale of tokens, even if none of them can afford to buy the painting individually [9].
Following the literature review, two major types of assets are more easily “tokenizable” than others: -Intangible assets (patents, carbon credits, copyrights.) because of their lack of physical existence, these assets can lend themselves more easily than others to this tokenization process, even though some laws barriers can make the transfer process more expensive and complex, these assets are easier to tokenize, they can often be divided into multiple units (such as bitcoins) and all tokens can be associated with a general set of interchangeable asset components (example: 10kg gold), conversely, non-fungible active ingredients are less suitable for tokenization. For example, when securitized, mortgages are often grouped with other loans with similar but not identical characteristics.
In this paper, we will only be focusing on the risks occurring the tokenization of non-fungible assets using smart contract that’s runs on Ethereum’s platform, as we assume that the risks presented are much more complex and require more documentation.
Many papers presented methods for risk measurement based on different criteria, from classification models to multi-criteria methods [8, 9]. In recent years, formal methods have been largely used to analyze tokenization using smart contracts with the aim of verifying the security protocols of potential risks with untrusted codes. One of the most cited problems has been the infamous DAO attack, taken millions of dollars during a crowdfunding service and caused a huge bug in the Ethereum’s blockchain. Among methods of classification and sorting, the MCDA method is used to assign selected areas to one of the four collapse risk classes previously defined by a committee of experts. By convention, Class 1 is the class corresponding to the highest risk, and Class 4 is the least significant risk [10].
The classification or risk has been the subject of extensive archiving work leading to the development of a geographic information system (GIS) [11]. The choice of areas to be classified according to risk was the subject of a pre-assigned selection procedure presented in table 1. The data available for each area is either quantitative (probability rate, depth, tokens) or qualitative (presence of a fault, nature of the fraud). These data are used, first, to identify the so-called homogeneous areas (with constant characteristics in their perimeter) [9], and on the other hand, to select the so-called (at-risk areas), presenting a predisposition to the occurrence of a collapse off chain or smart contract infrastructure in other words (operational, strategic). We first present the procedure for selecting the areas studied and the criteria chosen for the prioritization of these areas, then we explain the principle of prioritization based on the Electre- tri method [9]. Finally, we illustrate the course of the method.
3. Contextual Setting and Methods
On the block chain, risks are a major concern. In addition to their ability to cause losses of money and time, they can also degrade the performance of these systems and render them incapable of achieving their objectives [11]. However, in order to consider tokenizing non-fungible assets using smart contracts, it is crucial to assess the feasibility of it. In this section, we are interested in presenting the main methods used to manage risks and their influencing factors.
Many works characterize risk using two distinct components of “probability” and “severity”. The probability represents an average value of its eventuality over a period of time. As for severity, it is defined as the amount of damage [12], following the occurrence of a dreaded event. In a two-dimensional space, a risk can be presented by a point admitting an ‘S’ severity component and a probability component ‘P’ (see figure 1). It is important to note that there are different types of risks that can reach a system. According to the author these “risks” can be internal (industrial, bugs, errors), external (legal framework, economical), or chronic [11]. In this work, we are interested in documenting all of those risks, specifically risks that can damage the platform of a transaction, degradation of the production tool as well as human errors, [13]. We will limit ourselves, in terms of causes of damage, to technical failures, human errors and organizational problems.
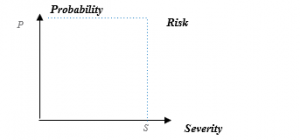
Figure 1: Representation of risk in a two-dimensional space, axis (Y) represent probability while axis (X) represent severity
The previous section illustrated the philosophy of conventional methods for risk analysis. These methods are based mainly on an iterative approach that allows, depending on the method, to identify and analyze a particular type of danger (dangerous phenomena, failures) [14]. The methods are based on the representation of results in different forms (such as diagrams, tables), however, and despite their proliferation, the methods that are dedicated to risk assessment, have certain limitations that can compromise the quality of their results, some of these methods present their results in different forms that can limit the risk detection in the system. In terms of quantifying the impact of risks, conventional methods are generally based on a qualitative risk assessment. For example, in the APR and AMDEC methods, a criticality index is given to each risk, this index is unreliable as it is calculated from qualitative indices of probability and severity. As for the fault tree method, it provides a quantification reliable probability of an adverse event, however, the assessment of the severity of the event remains unreliable [15]. Given the limitations of conventional risk analysis methods, other risk analysis methods have emerged. One of those methods is MCDA methods of classification and sorting, simply defined as an algorithm, which from the elements of a comparison matrix, can document the most likely risks [9]. During our analysis of the existing risk factors, we found various work aimed at integrating risk factors in different zones. Among them, some work has tried to identify only internal risks [5], others focused on integrating the inclusion of certain risk effects in the external environment [9] (see figure 2). In addition, another category of contribution was interested in the automatic conversion of multiple risk factors to one model [16]. We present in the following sections the frame work used in order to document all the risk factors [17].
4. Risk Assessment
Similar to the above definitions of risk, there are several definitions of risk management. Among these definitions, we will settle for the one given by NASA [18], which defines risk management as a process in which the program/project team is responsible for identifying, analyzing, planning, tracking, monitoring, and communicating risks effectively [19]. According to this definition, risk management is a practice of character methodical and ordered as an iterative process (see figure 3). It aims to reduce the impact of hazards to a level described as acceptable, given the efforts spent on its implementation [20].
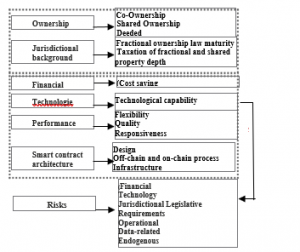
Figure 2: Factors influencing fractional ownership transfer
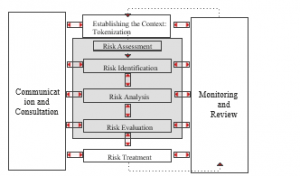
Figure 3: Risk assessment Process
Risk identification: Identifying risks that need to be assessed
It is important to note that, like any production system, tokenizing assets using Ethereum smart contract is subject to a multitude of risks [6], however, given the mission of tokenizing non-fungible assets, some risks can have a huge impact, as they affect in some cases the life savings of the users, causing in the process some dramatic damages [17]. Identifying risks aims to represent and describe the dysfunctions that can occur in a system (see table 1) [9]. A malfunction is characterized by an alteration that reaches the behavior of elements of a system already identified, in general, a function fails if it does not achieve the objective to which it is intended, with the desired quality [11].
These malfunctions represent events with different natures. Based on literature and available data, we are able to identify 6 major categories:
Table 1: Categories of risks in non-fungible tokenization
| Category | Risk |
| Operational | R1- Lack of a standardized mode of operation, function and security deficiencies |
| R2- Server/Infrastructure Breach | |
| R3- Poor service performance: failure in attaining an acceptable degree of responsiveness and flexibility | |
| R4- On and off chain information’s disorder | |
| R5- lack of privacy | |
| Financial | The transaction costs of the public block chain are high. |
| R7- Lack of recipients and users | |
| Technology | R8-Poor implementation of the smart contract to failure in the execution phase |
| Data | R9- Private keys information’s leakage |
| Related | R10-Latent information asymmetry between sellers and buyers. (Wang and Regan 2002) |
| Legal Framework | R11-Insufficient basis for cooperation and information exchange |
| R12- Absence of legal framework | |
| R13- Legal taxes basis inadequate or overly rigid | |
| Endogenous | R14- Prior supervisory approval not required |
| R15- No definition of significant ownership, nor qualitative criteria to determine ownership | |
| R16- Unrealistic or high expectations regarding the service provide performance | |
| R17- Inadequate response to week audits and control | |
| R18- Loss of control over the service provider |
4.2. Risk Analysis
Risk analysis is the systematic use of information to identify risk factors and target entities and estimate risk [9]. The risk factor is a parameter that is thought to play a role in the accidental sequence without being proven to be a direct or indirect cause. Estimating risk is defined as a “process used to assign values to the probability and consequences of a risk” [8]. As for risk estimation, the stakeholder may consider cost, benefits, concerns, and other variables required for risk assessment.
Two major risk analysis approaches are used in risk analyses: “Deterministic approach” that consists of identifying events that could lead to an accident by looking for the worst possible case (the worst-case scenario) and assigning extreme gravity to its potential consequences [9], and the “probabilistic approach” that involves calculating probabilities for the occurrence of events that are part of the process of materializing a given accident-scenario [18].
Table 2: Deterministic risk assessments
| Deterministic risk assessments | Description |
| Single scenario | Risks are defined and handled as static entities and outputs have fixed values [4] |
| Maximum-credible scenario’ | The scenario selected may be a ‘worst-case scenario’ or ‘most likely scenario’ (i.e. based on a historical event)
[8] |
| Stochastic Dominance | A partial order between random variables [11] |
| Consequence/probability matrix | Matrix with different layers of severity at the top and the levels of probability [12] |
4.3. Deterministic Risk Analysis
In this paper, we will use the deterministic approach that has been generally adopted in high-risk areas such as nuclear, military, guided transport, where the slightest significant risk is tracked down and reduced at source [9]. It consists of identifying events that could lead to an accident scenario by looking for the worst possible case and assigning extreme gravity to its potential consequences, this means that deterministic risk analysis only has a single and specific outcome based on the scenario being assessed [18]. Using a scenario-based approach can be extremely useful for communicating risk assessment results to non-experts.
4.4. Risk evaluation
Evaluating a risk is a process used to assign values to the probability and consequences of a risk. It’s a fundamental requirement for risk evaluation to identifier risk functions. As we are using Elctre-tri method, we categorize the parameters that we have mentioned earlier (such as fragility, vulnerability, likelihood and occurrence), into categories with the same nature in order to have a significant results. The natures of some parameters can vary significantly from one function to another [18, 19]. Using the MSDC tri method oblige us to choose categories with the same nature. Selecting appropriate functions is an essential aspect of risk evaluation as a mediocre selection can cause unsound decision making and unintentionally increase risk [9]. There is a significant challenge and a huge barrier to both the selection criteria and development of effective risk frame work as the parameters used are strongly limited by the availability of data:
- Financial impact
- Ethuriem Infrastructure impact
- Security impact
- Regulation impact
- Technological impact
- Likelihood of occurrence
- Risk mitigation effort
Once the severity, frequency of occurrence is estimated, the risk is assessed from a risk graph, of which here is a prototype (see figure 4).
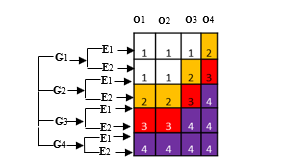
Figure 4: Prototype of a risk graph
As we pointed out in section 3, it is worth remembering that our ontological commitment is minimal, therefore, the user can either accept our risk graph (see figure 4), or define its own levels of severity [12], as well as the frequency of occurrence and/or exposure, they may also consider gravity if they chose to use the hazard analysis approach such as ODA (preliminary hazard analysis) [19]. In fact, many papers tried to provide a risk model based on ODA such as model-checking of smart contracts that contain three layers capturing respectively the behavior of Ethereum blockchain, the smart contracts themselves and the execution framework [20]. However, they don’t consider external factors outside the platform as relevant, unlike our framework that work as a formal verification technique based on a description of the variables. This technique consists in performing an efficient systematic inspection of all possible risk factors described by the risk assessment model in order to satisfy the conditions in our first step of building a risk model [21].
Table 3: Risk acceptability criteria
| Area of criticality | Risk acceptability | |
| Negligible | Acceptable | Risks that do not require the approval of the guardianship authority. |
| Acceptable | Risks requiring proper control and agreement from the supervisory authority. | |
| Undesirable | Not acceptable | Risks that cannot be reduced or insufficient and require agreement from the guardianship authority. |
| Unacceptable | Risks to be reduced. | |
5. Method Proposed
By identifying 18 risks (see table 1), by applying the Electre-tri method, we were able to classify those risks into four zones (see table 2). The Four proposed zones are built-in after assigning each risk to a specific area. The outranking concept by building binary relationships among each alternative and the profiles that bound each category. This method proposes both procedures for assigning to the collapsing risk classes under the two scenarios pessimist and optimistic procedure [19]. The pseudo-disjunctive procedure of the Electre-tri method corresponds to the procedure optimized with the outranking relation [16].
5.1. Implementation of the ELECTRE-TRI method and Results
Each of the 18 risks must be assigned to qualified zones to take on the implementation of the risk management. Nevertheless, Ethereum platform face an organizational challenges in controlling risk [20], due to the clutter of the continuum of risk reduction measures. We will devote this part to build a theoretical model formulation using Electre-tri.
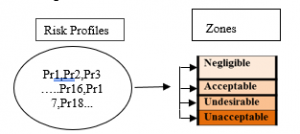
Figure 5: Risk level assignment
Zones are necessarily exclusive and orderly (with the Electre- tri method), zone 1 being the riskiest, the Pr1 profile, is presented on each criterion, a risk at least as high as Pr2, Pr2, also presents, on each criterion, a risk at least as high as Pr3, (see figure 7). The set of comparisons, on each criterion 9, between the evaluation of a Z1 zone, and each Prn profile provides a partial response to the entry of an area into a risk class h (figure 6 and 7)
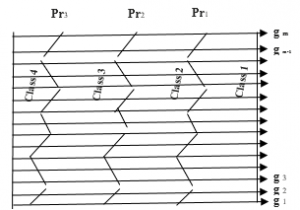
Figure 6: Position of principle of Prh class profiles on each criterion gj.
The data available are tainted with uncertainties, Electre-tri allows it to be taken into account through the introduction of two thresholds [8, 9]. The threshold of indifference qj and the threshold of preference Pj, they represent, respectively, the minimum and maximum margin of uncertainty related to the nature of the data and the calculations to be made and are defined as follows (see figure 7)
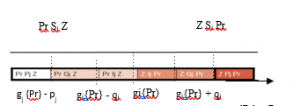
Figure 7: Three Comparison Situations, on Criterion J, between a Z zone and an Pr (S) profile at least as risky as, (I) indifference, (Q) low riskier and (P) strictly riskier.
– If lgj,(Z,) – gj (Prj)l is less than qj, it is considered that this difference is not significant and that gj(Zj) and gj (Prh)) are practically equivalent; it will be said then that zone Z, and the low profile of the h class, Prh, are indifferent (lj) from the point of view of the gj (ZjIj Prh) criterion;
– If lgj(Zj) – gj (Prh)l is greater than pj, this difference is considered significant; in the event that gj (Zj) is greater than gj (Prh), it will be said that zone Z, is strictly riskier than the low profile of the h class, Prh, for the gj criteria, (ZjPj Prh); Prh is strictly riskier (Pj) and that Z, in reverse (Prh PjZj)
-If the threshold of preference pj is not equal to the threshold of indifference qj, the interval between these two values represents a range of ambiguity in which the risk is presumed to be higher without the difference lgj(Zj) – gi (Prn)l can be considered truly significant. It will be said that zone Z, is weakly riskier (Qi) than Prh, for the criterion gj (Z Q, Prh); Prh is weakly pj us risky than Z, in reverse (Prh Q, Z,)’. By convention, if an area is indifferent to a low profile of a class, the area is then assigned to that class: we can say that the risk class is closed from below [9]. Therefore, if a Z, presents a risk assessment on each criterion, between the risk assessment made for Prn and Prh, then Zj is assigned to class h, however, this case is rarely encountered.
Two extreme logics of sorting to risk classes are then possible: either Z, is assigned in the class the lowest encounter on a criterion, Z, is assigned to the highest class met on a criterion. These two logics imply a principle of caution which is, in the first case, minimum and, in the second case, maximum. To mitigate these two logics, Electre- tri proposes two assignment procedures: a pseudo-conjunctive procedure and a pseudo-disjunctive procedure [9]. To achieve this, a credibility index σ is introduced. This index, which takes a value between 0 and 1, aggregates, taking into account importance of risk, partial comparisons, criterion by criterion, and expresses the credibility with which one can consider overall that a Z, is more risky than a Prh profile [22].
In this case, it will be said that the area outperforms (S) the profile. When this index is worth 1, it means that the assertion (Z, is riskier than Prh) is completely credible (100% credibility resulting from the adherence of all criteria to this assertion).When it is worth 0, it means that this assertion is not at all credible (credibility of 0% resulting from the rejection of the assertion by all the criteria or by one of the criteria that imposes its veto).When it takes a value between 0 and 1, it means that the (opinions – are divided (some criteria validate the assertion while others oppose it)[9]. The credibility index then expresses the force with which the favorable criteria are expressed, corrected by the opposite force of the adverse criteria. When it’s above 0.5, this means that an absolute majority of criteria is in favor of the assertion. The credibility index that makes it possible to judge this upgrade relationship is rated o(Z,Prh).In Electre- tri, one must also calculate the credibility index of the inverse relationship, noted o (Prh, Z), because the calculation of this index is not commutative. [23]
To judge whether or not a Z zone enters a class h, f credibility index o(Z,Prh) is compared to a parameter λ (including enter 0,5 and 1) that expresses the desired level of requirement to validate that entry. For example, an λ=0,6 means that it is hoped that at least 60% of the criteria (including risk importance) will be favorable to entry into the class. Three situations are possible and only possible if:
-If the Z is indifferent to Prh when: σ(Z, Prh) ≥ λ and σ(Prh, Zj) ≥ λ => Zj l Prh ;
-If the Z is preferred to Prh when: σ(Z, Prh) ≥ λ and σ(Prh , Zj) < λ=> Zj l Prh ;
-Prh is preferred to the Z when: σ(Z, Prh) < λ and σ(bh , Zj) ≥ λ=> Zj l Prh ;
-Is incomparable to Prh when: σ(Z, Prh) < λ and σ(Prh , Zj) < λ=> Zj l Prh ;
Out of the two sorting procedures offered by the Electre- tri method, pseudo-disjunctive is the most prudent. This procedure involves assigning a Z-zone, to an h-class, if:
– Z, has a strictly higher level of risk than the low profile Prn (Z,P Prh), Zj and low profile Prn present the same level of risk (Z,I Prn), or Zj and the low profile Prh presents incomplete levels of risk (Zj ,R Prh);
– And if none of the previous situations is valid when comparing Z, and the Prh .profile, (low profile of class h-1).
From the moment the first condition is checked by a Prh profile, it is also verified by all the lower n profiles
(Pr k >h).
The assignment h class can therefore be characterized by the highest h value such as Prn_, violates the first condition. This corresponds to the lowest profile such as Prhj1 presents a strictly higher risk level than Z.
It is important to note the λ parameter [21], which adjusts the allocations of areas to risk classes, is chosen by the user and raises the question of the degree of severity (or requirement) with which the allocations from the zones to the classes are to be dealt with [8], it must be greater than 0.5 to mean that, in order to validate an assignment from an area to a class, it is necessary that more than half of the criteria validate the assertion based on their respective weight or importance. Since importance of risks are different, it is important not to leave the decision to a single criterion, even if it is the most important [15].
Table 4: Comparative analysis between multi-criteria methods
| Multi-criteria methods | Criteria | Benefits | Disadvantages |
| Weighted sum = WSM | Quantitative | Simple, known, no change to the underlying problem [28]. | Drafting criteria, need for homogeneity of units and scales of criteria [28]. |
| Goal-Programming GP | Quantitative | Suitable for initial internships in the decision-making process [29]. | No qualitative criteria [29]. |
| MAUT = Multiple Attribute Utility Theory | Quantitative and qualitative | Accommodates scales of units of different criteria.Mathematically represents the decision-making process [30]. | Little intervention from the decision maker. Difficulty establishing utility functions [30]. |
| AHP = Analytic Hierarchy Process | Quantitative and qualitative | Great flexibility, varied range of unstructured problems [31]. | Decision-makers’ comparisons of potentially tricky criteria and alternatives [31]. |
| ELECTRE 1 = Elimination And Choices Translating Reality | Quantitative and qualitative | First method of upgrade. Suitable for the problems of choice between alternatives [23]. | Effects of significant thresholds. (too) simple modeling of the decision-making process.Real criteria only [23]. |
| ELECTRE 2 – Elimination And Choices Translating Reality | Quantitative and qualitative | Represents the decision-maker’s preference, indifference and veto in front of two alternatives by fixed values [23]. | Real criteria only [23]. |
| ELECTRE 3 = Elimination And Choices Translating Reality | Quantitative and qualitative | Represents the decision-maker’s preference, indifference and veto in front of two alternatives by an index between 0 and 1 (introduction of quasi-criterion and blur).Stable results [23]. | Implementation of the full potential of this delicate method. No physical interpretation of certain parameters (discordance thresholds).Results can be difficult to interpret [23]. |
| ELECTRE 4 – Elimination And Choices Translating Reality | Pseudo-criteria (fuzzy logic) | No weighting of the criteria but no criteria can be preponderant or negligible in relation to the others.Use fuzzy logic [32] . | Little flexibility in calculations [32]. |
The advantage of our model in the light of literature as we have said, is that the semantics of our model is given by a system of functions what can be more or less complex. Thus, the main challenge in our framework is the combinatory explosion of the framework. Nevertheless, this technique combined with Electre- tri has a huge potential to check most of risks in the design process of the smart contract [24]. The Electre- tri method always come up with a solution, however, the downside is that the proposed solution may be far from returning to the original classification if there are inconsistencies in the decision making process. In addition, the complexity of the calculations means that the theoretical model only works in cases where neither the criteria nor the alternatives are too numerous. [25] The algorithms used often rely on linear programming algorithms, whose computational time increases rapidly with the number of input variables (criteria and/or instances). [26, 27]
For example, Kappalab’s capacity calculation is limited to less than 10 criteria, which is more than enough in our case (it is common to consider that a problem with more than 6 or 7 criteria is a poorly defined problem) but not necessarily in machine learning .Taking into account the particular structure of machine learning problems may reduce computational time, particularly for “utility” or ” Electre- tri” method, this is an important step in the decision-making process, to inform on the options for this choice, a summary of the main characteristics of the methods described in the papers presented in table 4. Implementation of these tools may require the expertise of someone who will serve decision-makers and stakeholders. [26] These tools must be implemented in a decision-making process that can, depending on the case, be relatively complex and time-consuming and involve experts and members of civil society. The use of a facilitator who is familiar with the tools and conditions of their implementation can then be useful, especially for knowledge and preference management aspects. This theoretical framework is improved if it has a structured approach, it is with this in mind, that the decision-making tools described in this paper were designed, helping stakeholders and top management to reach consensus [27].
6. Conclusion
In this paper, we have introduced a unified theoretical framework for handling fractional rights using Ethereum smart contracts, which runs on the blockchain. This study links jurisdictional studies to computer science which deserves further investigations. While this direction of research has been already pointed out in other contributions, our results are meant to serve as a model for top management in order to handle a situation where they are too many criteria that are not connected. As we pointed out in our paper, this is achieved by expressing the decision-making process as a formula and solving arithmetic constraints.
Risk analysis on the Ethereum requires effective methods and tools to respond to the urgency with which risk sometimes needs to be managed. This method makes it possible to formalize expert knowledge through criteria that all contribute to the explanation of risk even when the knowledge of the phenomena involved is partial or imprecise.
The conclusions provided by Electre- tri serve as consultation between experts and decision-makers, their robustness depends on several aspects, including the reliability of data. To this end, Electre- tri imposes sensitivity analyses on the various parameters. It exploits such as weights, thresholds, and the λ fuzzy index before providing robust conclusions.
We believe that there is still much work to be done. As regards our results, several questions must be considered. First of all, we will be working on providing a new template for smart contracts to handle fractional rights, also we will be providing a real case study using our new template studying the response behavior of these templates regarding their abilities to handle different variables and information’s.
In conclusion, it is necessary to clarify that the method used does not intend to provide a forecast, but rather, a risk assessment, taking into account the availability of data, we will continue in our research aiming to provide a safer template to transfer non fungible assets using smart contracts.
Conflict of Interest
The authors declare no conflict of interest.
- M.D. Jones, system of fractional ownership of ntellectual.patent no.: us 7,720,740 b2.date of patent: may 18, 2010
- M. Zeilinger, “Digital Art as ‘Monetised Graphics’: Enforcing Intellectual Property on the Blockchain,” Philosophy & Technology, 31(1), 15–41, 2018, doi:10.1007/s13347-016-0243-1.
- M. Mohammadi, A. Al-Fuqaha, M. Guizani, J.-S. Oh, “Semisupervised Deep Reinforcement Learning in Support of IoT and Smart City Services,” IEEE Internet of Things Journal, 5(2), 624–635, 2018, doi:10.1109/JIOT.2017.2712560.
- Kalra, S. Goel, M. Dhawan, S. Sharma, “ZEUS: Analyzing Safety of Smart Contracts,” in Proceedings 2018 Network and Distributed System Security Symposium, Internet Society, Reston, VA, 2018, doi:10.14722/ndss.2018.23082.
- R. Shinde, O. Nilakhe, P. Pondkule, D. Karche, P. Shendage, “Enhanced Road Construction Process with Machine Learning and Blockchain Technology,” in 2020 International Conference on Industry 4.0 Technology (I4Tech), IEEE: 207–210, 2020, doi:10.1109/I4Tech48345.2020.9102669.
- M. Alharby, A. van Moorsel, “Blockchain Based Smart Contracts: A Systematic Mapping Study,” Computer Science & Information Technology (CS & IT), 125–140, 2017, doi:10.5121/csit.2017.71011.
- BEN-ARI, Adi,A System and method for blockchain smart contract data privacyinternational search report (art. 21(3)),62/259,090 24 november, 2015
- A. Kosba, A. Miller, E. Shi, Z. Wen, C. Papamanthou, “Hawk: The Blockchain Model of Cryptography and Privacy-Preserving Smart Contracts,” in 2016 IEEE Symposium on Security and Privacy (SP), IEEE: 839–858, 2016, doi:10.1109/SP.2016.55.
- L. Luu, D.-H. Chu, H. Olickel, P. Saxena, A. Hobor, “Making Smart Contracts Smarter,” in Proceedings of the 2016 ACM SIGSAC Conference on Computer and Communications Security, ACM, New York, NY, USA: 254–269, 2016, doi:10.1145/2976749.2978309.
- G.W. Peters, E. Panayi, Understanding Modern Banking Ledgers Through Blockchain Technologies: Future of Transaction Processing and Smart Contracts on the Internet of Money, 239–278, 2016, doi:10.1007/978-3-319-42448-4_13.
- N. Atzei, M. Bartoletti, T. Cimoli, A Survey of Attacks on Ethereum Smart Contracts (SoK), 164–186, 2017, doi:10.1007/978-3-662-54455-6_8.
[12] C.F. Torres, J. Schütte, R. State, “Osiris,” in Proceedings of the 34th Annual Computer Security Applications Conference, ACM, New York, NY, USA: 664–676, 2018, doi:10.1145/3274694.3274737. - B. Roy, D. Bouyssou, Comparison of a Multi-Attribute Utility and an Outranking Model Applied to a Nuclear Power Plant Siting Example, 482–494, 1985, doi:10.1007/978-3-642-46536-9_35.
- J. Figueira, B. Roy, “Determining the weights of criteria in the ELECTRE type methods with a revised Simos’ procedure,” European Journal of Operational Research, 139(2), 317–326, 2002, doi:10.1016/S0377-2217(01)00370-8..
- C. Liu, H. Liu, Z. Cao, Z. Chen, B. Chen, B. Roscoe, “Finding Reentrancy Bugs in Smart Contracts,” in 2018 IEEE/ACM 40th International Conference on Software Engineering: Companion (ICSE-Companion), IEEE, Gothenburg: 65–68, 2018..
- O. Deck, M. Al Heib, F. Homand, “Taking the soil–structure interaction into account in assessing the loading of a structure in a mining subsidence area,” Engineering Structures, 25(4), 435–448, 2003, doi:10.1016/S0141-0296(02)00184-0.
- J.R. Figueira, S. Greco, B. Roy, R. Słowiński, “An Overview of ELECTRE Methods and their Recent Extensions,” Journal of Multi-Criteria Decision Analysis, 20(1–2), 61–85, 2013, doi:10.1002/mcda.1482.
- C. Harland, R. Brenchley, H. Walker, “Risk in supply networks,” Journal of Purchasing and Supply Management, 9(2), 51–62, 2003, doi:10.1016/S1478-4092(03)00004-9.
- S. Scheuer, D. Haase, V. Meyer, “Towards a flood risk assessment ontology – Knowledge integration into a multi-criteria risk assessment approach,” Computers, Environment and Urban Systems, 37, 82–94, 2013, doi:10.1016/j.compenvurbsys.2012.07.007.
- Z. Nehai, P.-Y. Piriou, F. Daumas, “Model-Checking of Smart Contracts,” in 2018 IEEE International Conference on Internet of Things (iThings) and IEEE Green Computing and Communications (GreenCom) and IEEE Cyber, Physical and Social Computing (CPSCom) and IEEE Smart Data (SmartData), IEEE: 980–987, 2018, doi:10.1109/Cybermatics_2018.2018.00185.
- K. Govindan, M.B. Jepsen, “Supplier risk assessment based on trapezoidal intuitionistic fuzzy numbers and ELECTRE TRI-C: a case illustration involving service suppliers,” Journal of the Operational Research Society, 67(2), 339–376, 2016, doi:10.1057/jors.2015.51.
- S. Betz, S. Hickl, A. Oberweis, “Risk-Aware Business Process Modeling and Simulation Using XML Nets,” in 2011 IEEE 13th Conference on Commerce and Enterprise Computing, IEEE: 349–356, 2011, doi:10.1109/CEC.2011.58.
- A. Ahmed et al., “Modeling and Simulation of Office Desk Illumination Using ZEMAX,” in 2019 International Conference on Electrical, Communication, and Computer Engineering (ICECCE), 1–6, 2019. DOI: 10.1109/ICECCE47252.2019.8940756
- E. Mengelkamp, J. Gärttner, K. Rock, S. Kessler, L. Orsini, C. Weinhardt, “Designing microgrid energy markets,” Applied Energy, 210, 870–880, 2018, doi:10.1016/j.apenergy.2017.06.054.
- N. Xiao, H.-Z. Huang, Y. Li, L. He, T. Jin, “Multiple failure modes analysis and weighted risk priority number evaluation in FMEA,” Engineering Failure Analysis, 18(4), 1162–1170, 2011, doi:10.1016/j.engfailanal.2011.02.004.
- S. Sterlacchini, S. Frigerio, P. Giacomelli, M. Brambilla, “Landslide risk analysis: a multi-disciplinary methodological approach,” Natural Hazards and Earth System Sciences, 7(6), 657–675, 2007, doi:10.5194/nhess-7-657-2007.
- K. Bhargavan, N. Swamy, S. Zanella-Béguelin, A. Delignat-Lavaud, C. Fournet, A. Gollamudi, G. Gonthier, N. Kobeissi, N. Kulatova, A. Rastogi, T. Sibut-Pinote, “Formal Verification of Smart Contracts,” in Proceedings of the 2016 ACM Workshop on Programming Languages and Analysis for Security – PLAS’16, ACM Press, New York, New York, USA: 91–96, 2016, doi:10.1145/2993600.2993611.
- S. Kaddani, D. Vanderpooten, J.-M. Vanpeperstraete, H. Aissi, “Weighted sum model with partial preference information: Application to multi-objective optimization,” European Journal of Operational Research, 260(2), 665–679, 2017, doi:10.1016/j.ejor.2017.01.003.
- B. Bankian-Tabrizi, K. Shahanaghi, M. Saeed Jabalameli, “Fuzzy multi-choice goal programming,” Applied Mathematical Modelling, 36(4), 1415–1420, 2012, doi:10.1016/j.apm.2011.08.040.
- D. Von Winterfeldt, G.W. Fischer, Multi-Attribute Utility Theory: Models and Assessment Procedures, Springer Netherlands, Dordrecht: 47–85, 1975, doi:10.1007/978-94-010-1834-0_3.
- M. Younas, S.H.I. Jaffery, M. Khan, M.A. Khan, R. Ahmad, A. Mubashar, L. Ali, “Multi-objective optimization for sustainable turning Ti6Al4V alloy using grey relational analysis (GRA) based on analytic hierarchy process (AHP),” The International Journal of Advanced Manufacturing Technology, 105(1–4), 1175–1188, 2019, doi:10.1007/s00170-019-04299-5.
- M.A. Alghamdi, N.O. Alshehri, M. Akram, “Multi-Criteria Decision-Making Methods in Bipolar Fuzzy Environment,” International Journal of Fuzzy Systems, 20(6), 2057–2064, 2018, doi:10.1007/s40815-018-0499-y.
Citations by Dimensions
Citations by PlumX
Google Scholar
Scopus
Crossref Citations
- Abdullah J. Abualhamayl, Mohanad A. Almalki, Firas Al-Doghman, Abdulmajeed A. Alyoubi, Farookh K. Hussain, "Towards Fractional NFTs for Joint Ownership and Provenance in Real Estate." In 2023 IEEE International Conference on e-Business Engineering (ICEBE), pp. 143, 2023.
- Bulut Karadag, A. Halim Zaim, Akhan Akbulut, "Blockchain-Based KYC Model for Credit Allocation in Banking." IEEE Access, vol. 12, no. , pp. 80176, 2024.
- Mohamed Laarabi, Badreeddine Chegri, Abdelilah Maach, "Data breach Analysis for Financial Smart Contracts." In 2022 2nd International Conference on Innovative Research in Applied Science, Engineering and Technology (IRASET), pp. 1, 2022.
- Mohamed Laarabi, Badreeddine Chegri, Abdelilah Maach Mohammadia, Khaoula Lafriouni, "Smart Contracts Applications in Real Estate: A Systematic Mapping Study." In 2022 2nd International Conference on Innovative Research in Applied Science, Engineering and Technology (IRASET), pp. 1, 2022.
No. of Downloads Per Month
No. of Downloads Per Country