Method of Modelling Prices for R&D Products in the Case of their Transfer from Engineering Universities to the Business
 , Ihor Novakivskyj 2, Terebukh 3, Valentyna Zhukovska 4
Adv. Sci. Technol. Eng. Syst. J. 5(5), 80–93 (2020);
 DOI: 10.25046/aj050512
Global changes caused by the IV Industrial revolution and globalization processes resulted in a redistribution of roles of participants in innovative infrastructures of countries. Universities are leading both in terms of generating R&D products and in terms of developing business activities. Now there is a problem of insufficient methodological support of technological universities for pricing R&D products developed and prepared for transfer to the business environment. Existing methods and models do not meet the needs of the market, which is growing rapidly. At the same time, the market is characterized by a high degree of volatility. The purpose of the article is to develop a method for modelling prices for R&D products from universities to the business environment, which takes into account: the specifics of the R&D product, modern market features for this R&D product; the nature of the transfer and commercialization of this R&D product. The article identifies the factors that determine the processes of transfer, commercialization and market launch of R&D products, which affect the pricing of R&D products. Groups of characteristics that characterize systematize these factors: 1) consumer value of R&D product; 2) market susceptibility of R&D product; 3) transfer and commercialization processes of R&D product. Justified a number of factor attributes within the formed groups and assigned them the values of linguistic terms for adjusting the price of R&D product using fuzzy set theory algorithms. The method takes into account elements of cost, revenue and comparative estimation approaches. The method makes it possible to adjust prices for R&D products, taking into account heterogeneous features in the composition of R&D products and compare them with market analogues of R&D products. This contributes to achieving a higher level of pricing accuracy for R&D products when they are transferred from the university to the business environment. The resulting prices are compared with market prices for competitive analogues, which makes it possible to determine the scenario of transfer and commercialization of R&D product; justify the strategy of market development of R&D product; increase the level of manoeuvrability of pricing management for R&D product. The model was tested on a number of R&D products developed at Lviv Polytechnic National University (Ukraine). Application of the proposed method is advisable in the short-and medium-term forecasting period.
1. Introduction
1.1. Framework of theme relevance
This work is a continuation of the development of issues raised by the team of authors at the 14th International Scientific and Technical Conference on Computer Sciences and Information Technologies [1].
Global changes caused by the IV Industrial revolution, the popularization of the open innovation paradigm and the concept of Society 5.0, the virtualization of many areas of human activity, as well as other events and phenomena, caused the redistribution of roles of almost all participants in the innovation infrastructure of regions of countries. Leading positions are increasingly held by technological universities, both in terms of technology development opportunities and in terms of entrepreneurial development. Universities have become hotbeds for generating, transferring, commercializing, and even providing market support for technologies. Now they are the main providers of interaction between business, government and society.
This requires universities to constantly study the market needs for R&D products in the context of prospective requests due to scientific and technological progress and timely and reasonable response to such requests. Thus, today the processes of transferring R&D products from universities to the business environment are taking place against the background of market uncertainty. In contrast to business structures that are more mobile in the market competition, universities should act on the basis of careful strategic planning of R&D products transfer opportunities, evaluating the level of efficiency of technology transfer in general, being still at the beginning of the “R&D – market” chain.
The commercialization processes of University R&D products are both goals and tools. Goals, since commercialization means the relevance and expediency of further scientific research, and tools – since commercialization makes it possible to make a profit for their implementation. This requires providing universities with the necessary resources and methodological tools. In particular, pricing for R&D products prepared for transfer from universities to the business environment requires priority attention in this process.
As a result of unsubstantiated management decisions in pricing their R&D products, universities can have significant negative results both in the long term (loss of competitive positions, loss of business reputation in research schools) and in current activities (loss of revenue, revaluation of their own positions, loss of qualified personnel), which can lead to a weakening of interaction in the system of participants in the innovation infrastructure.
Until now, the world economic science has not paid much attention to the specifics of pricing for university R&D products as part of their transfer processes. However, the growing integration role of universities in the interaction of participants in the innovation infrastructure and the rapid development of technological universities in the world have led to the need to review this issue.
1.2. Statistical Background
The importance and relevance of research on pricing issues for R&D products prepared for transfer from universities to the business environment, confirm the pace of dynamic growth in the world of R&D products that are transferred by universities to the market.
According to statistics, the overall effect of transferring R&D products from universities to businesses to the global economy is estimated at Supporting regional economic growth and new job creation — up to $1.7 trillion in gross industrial output and 5.9 million jobs since 1996 [2].
According to this year’s study, the global trend in R&D spending continues to grow worldwide, reflecting a surge to $240 billion in the Information & Technology sector. As in previous years, the growth in global R&D investments is being driven by spending in Asian countries, in particular China, which exceeds $500 billion in spending accounting for a 22 percent global share in investments [3].
Association of University Technology Managers (AUTM) in their research note that the contribution of universities to GDP as a whole appears to be growing faster than U.S. GDP as a whole, and faster than the manufacturing industries used in prior reports [4]. However, when considering the research-intensive industries, the modelled AUTM contribution to GDP appears to be growing, in relative terms, about as quickly as these research-intensive industries. In numbers it is the $723 billion contribution to gross output, $374 billion contribution to GDP, and providing support for 2.676 million jobs over the 22-year period, is based on an assumption of a 5% earned royalty rate on licensees’ product sales.
The World University Rankings in their methodology for evaluating knowledge-intensive universities, they use achievement levels in all their main tasks: teaching, research, knowledge transfer, and worldview [5]. In the research task (takes 30%) on the rating scale, the profit from commercialization of R&D products is estimated at 9%. Despite the different size of universities and the scope of scientific activities, this indicator is adjusted to take into account the number of teachers.
Solving pricing problems when commercializing R&D products is particularly relevant for universities that have technology transfer centres or other similar divisions. A study of the world’s leading university technology transfer centres (Oxford, MIT, Stanford, Cambridge, Ruprecht-Karl University of Heidelberg, the National University of Singapore, the University of Toronto, etc.) has shown that even if there is methodological support for their activities, they cannot always effectively apply it. The pace of development and market needs for R&D products is growing significantly faster than the corresponding methodological support is being developed for them, in particular in the field of pricing.
The world’s leading science-intensive universities publish annual reports on commercialization to improve their reputation in business circles R&D products. Universities create specialized technology transfer units that implement programs to promote their own R&D products. In particular, start up companies based on discoveries and inventions by University researchers. The most popular form of knowledge transfer in the world, which is developing, is Creative works (no patented technologies). They may be trademarked or copyrighted and are often ready to be licensed when the inventor discloses the invention. In FY2019 [6], creative works earned $6.3 million in revenue from 109 licenses across 55 technologies and leveraged online automated licensing for over 1,000 additional transactions. There were 27 technologies made available via online app platforms with more than 47,000 app downloads. Creative works come from colleges and centres across all UMN campuses.
Paying attention to pricing for R&D products is important when universities enter into contract research based on its contractual obligations. Such transactions, providing business advice is an important source for the development of universities. According to the annual reports of universities, sometimes such an item of income can reach 10% of the total cost of maintaining the university [7].
1.3. Formulation of the problem
Each engineering university is unique in terms of access to resources, the scale and focus of their research efforts, and the level of expertise in technology licensing, patenting, and sharing. However, most of them have similar problems related to taking into account these and other features in pricing for university-generated R&D products, in particular in a changing market and globalizing processes.
Existing approaches to pricing for R&D products cannot be applied in modern market conditions due to a number of factors, namely:
- accelerated pace and unpredictability of changes in environmental factors;
- increasing the number of participants in the innovation infrastructure, which is increasingly attracted to the region’s communities;
- acceleration of changes in market conditions due to digitalization;
- spreading the use of open models of the innovation process;
- diversification of forms and methods of transmission R&D products (Express licenses available online, Fast-track opportunity licenses for early-stage technologies, Negotiated, exclusive, and nonexclusive license agreements, Sponsored research agreements (MN-IP), University start up companies (Venture Centre and Discovery Launchpad));
- limited financial and time resources for full development of R&D products by the developer (often before commercialization, R&D products can be offered at different levels of readiness);
- increasing the level of technology intellectualization;
- maturation of scientific technologies at early stages outside of scientific organizations, using the resources of commercial partners willing and able to continue the applied research and experimental development necessary for the market launch of the product;
- the emergence of unpredictable effects from the commercialization and implementation of R&D products in various sectors of the economy (convergence, spillover, crowd effect, diffusion, multiplicative effect, etc.);
- increasing dependence of the developed functional characteristics of R&D products, taking into account the specifics of the conditions for their future implementation, and so on.
The decrease in the level of predictability and objectivity of results from the use of existing pricing methods for R&D products, their low adaptability to the dynamics of the innovation environment, the growth of the impact of economic consequences from this, and other factors led to the search for new methodological tools for effective pricing of R&D products prepared for commercialization and transfer from universities to the business environment.
2. Theoretical Background
The processes of transfer and commercialization of R&D products is a complex multi-attribute mechanism, the effectiveness of which is largely determined by a reasonable choice of approaches, methods and pricing models for R&D products.
R&D product can result in different products (products, technology, organizational and management decision, etc.) and be at different Technology Readiness Levels (TRL’s). Since R&D product is a commodity in the innovation market, General methodological approaches of the market economy are used for basic pricing [8].
Pricing refers to the field of strategic management decisions [9], so specialists in the system of strategic management mainly consider the approaches to its implementation. There are study three types of technology transfer strategies: income-generation strategy, service-to-faculty strategy, and local development strategy [10]. The highlighted strategies differ in the priorities for implementing the transfer strategy.
R&D product transfer, as a process of technology transfer, has its own pricing features in terms of technology transfer transactions between countries [11, 12] .
It is necessary to highlight the influence of such a factor on pricing as a form of calculation the main payment types in use by University Technology Transfer Units (TTUs) [13]. The more frequent types of payment are the running royalties, but other payment types are frequently included in the technology transfer agreements, such as the minimums, the milestone payments, and the patent costs reimbursement and maintenance.
Pricing strategy based on the subscription model could be an effective strategy for any organization to increase its revenue and maintain customer satisfaction at the same time [14]. The strategy enables the organizations to get more revenue from their subscribers over a longer period. It also reduces the upfront cost paid by users, making it more affordable, which would help increase, the number of subscribers.
The complexity of managing the transfer process and, consequently, technology pricing is complicated by the growing importance of the support package, which is «diversified and performance of three key business-community services – provision of consultancy, provision of continuous professional development courses (CPD), and leasing of facilities and equipment» [15].
The complexity of pricing for technology transfers also lies in the fact that the transaction process must be based on balance the needs of the university, researchers, licensing firms and financiers with government entities and the public that support – and ultimately benefit from – the products and services created, along with the economic vitality and job creation derived from the commercialization process.
Pricing is influenced by many factors, including [16]: (1) the characteristics of the property or service, (2) functional analysis, (3) contractual terms, (4) economic circumstances, and (5) business strategies.
In general, all the traditional approaches to R&D product pricing known in the world can be divided into three areas: cost-based, profitable and comparative, represented by many methods and methods of their application.
2.1. Cost approach
For situations with the pricing of R&D products developed in universities, with the purpose of their further transfer and commercialisation are mostly used methods are the cost approach (for purposes of the base assessment, the definition of “bottom border” prices R&D product, development of cost estimates for studies, preparation of applications for grants and the like).
Scientists studies in modern research the valuation methods used by universities, the concerns of usage, and the difficulties in implementing the valuation methods. The author concluded that the universities typically use cost approach, market approach, income approach and auction to value the academic technologies [17]. Among which, cost approach is the most widely used one. The difficulties suffered by Taiwanese universities include lacking staffs specialized in valuation, expensive valuation service by external consultants, and the restrictions by government regulations. Based on the interview findings and previous studies, this study further designs a technology valuation framework for Taiwan universities and applies the framework to valuing the vaccines of duck viral hepatitis owned by a Taiwan university. At last, this study offers suggestion for valuing academic technologies by integrating the results from interviews and the experiences in empirical applications.
Scientists [18] use a cost-based approach in their research. When forming the price, they recommend operating the Setting standard cost. To reduce the cost of R&D product is offered the optimization method of standard cost setting.
Cost-based pricing methods for R&D product technology developed within the University have their drawbacks and limitations. Focusing on the amount of expenses incurred can completely separate the developer from the real economic situation on the market. Accordingly, the formation of estimates for development will be carried out according to the priorities of the University’s development. Since research and development can take many years, often with significant interruptions, it is difficult to justify discount rates to bring costs to today’s conditions, especially for countries with unstable economies.
2.2. Income approach
The revenue-based approach to pricing is widely used in the modern business environment. Scientists explore revenue approaches through econometric multifactor asset pricing models, which identifying the best factor-pricing model(s) is conspicuously lacking in investment research applications [19, 20].
In scientific works the authors use a generic reduced-form model economy with moderate risk premium nonlinearity to examine the size of the resulting misspecification-induced pricing errors [21].
Also some authors generalized model, what is presented to jointly characterize the optimal pricing and inventory policies to maximize the retailer’s total expected profit [22].
The revenue approach was considered on the example of pricing for Massive Open Online Courses (MOOCs) [23]. Authors adopt a game-theoretic framework to model the interaction and strategic choices of a MOOC platform, learners, and universities. Based on the certificate prices and revenue sharing ratios chosen by the platform for courses with various certificate-purchasing rates, universities consider the competition intensity and decide their course quality levels, to attract learners.
The complexity of applying the revenue approach methods for university developments is related to the subjectivity of the justification of cash flows, which are often determined by the place of application of the development. Paying attention to the revenue approach is important in connection with the development of value-based pricing in recent years.
Some scientists pay special attention to conceptualize key stakeholders’ perceptions of their experiences, opportunities, and barriers to implementing value-based pricing [24, 25].
2.3. Comparative approach
Among the methods of this direction, the most common are competitive methods, the essence of which is in comparison with its analogue to determine the competitive advantages and bottlenecks of R&D product. In particular, this method is used as a price formation tool Bert Rand price game Based on game theory, this paper studies the strategy of purchasing technology and upgrading from a technology supplier in a duopoly market, and analyses the pricing of products under different technology procurement strategies [26]. The research shows that, under the competition of product price, the game results of the enterprise’s purchase of technology will be divided into symmetrical Nash equilibrium or asymmetric Nash equilibrium. Group of authors developed the complex of methodical support of the implementation and commercialization of domestic innovative devices [27].
The competitive pricing model has been developed for vintage capital model that combines a competitive market structure with an exogenous rapid rate of innovation [28].
There are many methods of estimating cost but as it is clear that we cannot consider any single technique to be the best one as each of the techniques have their own advantages and disadvantages. Efforts should be made to use a combination of the estimation techniques to arrive at a better cost and quality estimate [29]. This will allow you to justify the best pricing option for R&D products for the purpose of transferring it.
The developed approaches to determining the cost and price of R&D products by NASA and the Software Engineering Institute (federally funded research and development centre sponsored by the U.S. Department of Defense). Both teams of authors use the concept of technological readiness in their methods and promote the idea of combining different approaches.
NASA’s pricing methodology is aimed at using yet-to-be-completed developments, for estimating the cost and schedule of low TRL technology research and development projects. The method involves using a system of 20 unique technology parameters that are subsequently reduced in number and suitable for use in characterizing these technologies. Further, a discussion of data acquisition effort and criteria established for data quality are provided. The authors offer recommendations on the gaps identified, description of a spreadsheet-based estimating tool initiated. The main cost analysis tool was parametric analysis.
TCASE generates anticipated ranges of cost and schedule duration for a technology development project by drawing analogies to historical and current project. Data for historical and current projects is stored in an accompanying database.
The Software Engineering Institute uses TRL Calculator (one for hardware and one for software) developed by Mr. Nolte at AFRL, it is the negotiation of the answers that is labour intensive. Thus, a good consensus building and conflict-resolution process is also needed. Therefore, the accuracy of calculating the cost (price) of R&D products is determined by the quantity and quality of negotiations between participants in the technology transfer process. Therefore, an important issue is the choice of a rational range of interviewees. The use of this technique is limited to system components.
2.4. Theoretical generalization
Consequently, most existing methods and pricing models for R&D products are inflexible. They are difficult to adapt to the dynamic characteristics of R&D products. At the same time, appraisers often do not take into account a significant number of changing factors of the internal and external environment.
For a long time, the development of R&D products within universities leads to an increase in the duration of the chain of innovation “generation – commercialization – market diffusion”, so the use of exclusively expensive methods is impossible.
Since the sources of generating R&D products are not the parameters of market demand, but the scientific achievements of the university, the use of comparative approaches can also be used in a limited format.
In turn, profitable approaches are also difficult to use in their pure form due to the growing level of convergence of markets and technologies, the emergence of new forms of business, the emergence of unexpected effects of use, and so on.
Taking into account the above, the use of quantitative methods alone will not give an adequate result of pricing, since there is a risk of not taking into account many important situational factors of a volatile market environment. The use of qualitative methods carries the risk of obtaining such an indicator of the price of R&D product that is not subject to adequate adjustment (the price, although competitive in the market, but it is difficult to adjust it under the conditions of market changes).
Currently, there are no methodological developments that would provide a flexible pricing mechanism for R&D products for their transfer from universities to the business environment in a changing market. The lack of such developments causes problems for universities:
- failure to provide an adequate contract price for R&D products during their transfer from universities to the business environment;
- it is impossible to take into account a number of important indicators of an investment project for R&D product (discount parameters, profitability indicators, cash flows, etc.);
- inefficiency of pricing strategies for R&D product (overestimating the price of R&D product in some cases, in others – underestimation, which leads to loss of profit);
- lying of R&D products projects “on the shelves”, etc.
It is important to develop a method that would make it possible to adjust the price of an R&D product, depending on changes in market conditions, and overcome the disadvantages of existing methods. At the same time, this method should create the ground for changing the target setting of pricing tasks for R&D products, which will contribute to the formation of effective pricing strategies.
3. Research design
3.1. Methodology approach
The aim of this work is to develop a method for modelling prices for R&D products for their transfer from universities to the business environment, taking into account the conditions of market variability.
The development of a method for modelling the price of R&D products, taking into account the conditions of market variability, is based on a combination of cost, comparative and profitable approaches to pricing. The market is characterized by a variety of features that affect the pricing of R&D products. In practice, appraisers often neglect individual parameters of R&D products; artificially simplify the interdisciplinarity of indicators and their relationship, which reduces the effectiveness of pricing for R&D products. This complicates the processes of transfer and commercialization of R&D products, reduces the competitive stability of the product in the market.
A scientific search has shown that prices for R&D products that are being prepared for transfer from universities to the business environment can be adjusted to take into account the variability of market conditions, in particular by applying the appropriate correction factor. This coefficient is essentially an aggregate indicator that includes a number of relevant factors that influence the pricing of R&D products.
Therefore, for further research and implementation of the goal, the following hypotheses were formed.
Hypothesis 1. The methodological approach to modelling prices for R&D products when they are transferred from universities to the business environment, which takes into account changing market conditions, should be based on: 1) based on the amount of expenses incurred by developers, since the sources of their formation can be justified; 2) taking into account the correction coefficient developed to clarify the price of R&D product.
This coefficient shows the influence of a combination of factors (external and internal relative to the R&D product environment) on pricing for this R&D product.
To do this, you should develop a correction factor that takes into account expert assessments of the set of factors that affect this R&D product. These are the factors that can indicate a possible change (increase or decrease) in the value of the analysed R&D product, and which can be transferred to the pricing plane.
This hypothesis will be tested by a comparative analysis of the average market prices for a number of R&D products and prices obtained by applying a correction coefficient for the proposed author’s method.
Hypothesis 2. The list of features used to model the price of an R&D product prepared for transfer from a university to a business environment is universal and exhaustive.
The signs that determine the change in the price adjustment coefficient must be analysed in the process of practical research of R&D products. This hypothesis will be tested by comparing the features used for price modelling between different R&D products.
Hypothesis 3. The methodological approach to calculating the correction factor for improving the pricing of R&D products when they are transferred from universities to the business environment is universal and effective for strategic pricing purposes.
When forming a correction coefficient, the problem arises not so much in the economic as in the mathematical context: indicators that reflect the specific features of R&D product and its transfer processes, market uncertainty, and so on are quite heterogeneous. These indicators are characterized by a complex level of mutual correlation, and their influence on the integral indicator (correction coefficient) is not always obvious.
In order to justify the method of adjusting prices for R&D products when they are transferred from universities to the business environment, which takes into account different types of indicators and their dependencies of different levels of complexity, it is advisable to use approaches within the theory of fuzzy sets.
It is proposed to develop an R&D product price adjustment coefficient based on the algorithms of fuzzy set theory, which will effectively respond to changes in market conditions (in particular, by adding or subtracting the corresponding scenarios in the knowledge base, adjusting features, etc.). One of the promising approaches of this theory for modelling and forecasting economic processes is the fuzzy logic approach, which gained popularity in economic applications in the second half of the last century.
The application of the fuzzy logic approach to develop a method for adjusting prices for R&D products during their transfer from universities to the business environment is justified by the following arguments.
- The ability to take into account the interaction of factors of influence on the R&D product that are interrelated with different levels of complexity. Factors that influence the price change for an R&D product can be both the specific characteristics of the R&D product itself, and the characteristics of the market to which this R&D product is displayed (in particular, the market susceptibility of this R&D product), as well as the processes of its transfer. These factors are not in a linear relationship, but are closely related, so considering them in the system using fuzzy set theory algorithms will help refine the price of an R&D product.
- Adaptive capacity of expert assessments. Methods based on the theory of fuzzy sets have a high adaptive capacity according to expert estimates and are quite adequate in practical use.
- Combination of qualitative and quantitative assessments. The development of the R&D product price correction coefficient within the framework of fuzzy set theory operates with both qualitative and quantitative forms of its implementation, which makes it possible to evaluate the features, external and internal features, properties of the R&D product market, and so on. The method also allows you to take into account estimates that pass from one state to another.
- The R&D product price adjustment method is based on a number of indicators that can change during the calculation of the adjustment coefficient. For example, if some indicators are outdated or other indicators need to be introduced, they can be replaced, along with appropriate modification of scenarios in the knowledge base. This is based on the principles of feedback-from the market entity (consumer, enterprise, etc.) to the university.
By adjusting the price of R&D products based on fuzzy set theory, we understand the process by which, based on available data, you can set significant parameters that are not directly measured, but determine the nature of pricing for R&D products and make it possible to analyse changes in its state.
The criterion for the effectiveness of price adjustment for R&D products in the framework of fuzzy set theory is expressed by maximizing the degree of suitability of the obtained estimates for a specific market situation.
In economics, the most common models used for this type of problem are Mamdani, Sugeno, Tzukamoto, Larsen, and others. To adjust the price of R&D products based on fuzzy sets, we selected the Mamdani model, which differs from other models in that its rules in sequences contain fuzzy values (membership functions).
The methodology of estimation processes based on the theory of fuzzy sets is based on a number of theoretical assumptions, in particular, stated by Zadeh L. (1976).
First, it is assumed that the object of research can enter a state that belongs to a finite set of states S (the action of external and internal processes changes, but the lack of its measurement leads to a restriction of the set S). On the set S, there are two disjoint subsets S1 S2, where S1 is a subset of states that are consistent with the characteristics of the desired state by the level of development of features; S2 is a subset of states that are not consistent with the characteristics of the desired (normative or reference) state by the level of development of features. The subset contains state types that allow for functioning and development. The subset contains state types that respond to changes in parameters or structural relationships that contribute to deviations from the desired result.
Second, the solution to the issue of inventory and evaluation of the real state of the object is based on the analysis of the set S or a subset of S1 and S2.
Third, the assessment is based on the appraisers’ positions and methods of conducting it.
Fourth, detecting deviations from the characteristics of the desired state means that the object is in the process of transitioning from the Sk state to the Sl state, but the operating conditions may not be violated if Sk and Sl belong to a subset of states.
3.2. Data analysis
Based on the research, the factors that determine the processes of transfer, commercialization and market launch of R&D products, which affect the pricing of R&D products, are identified and systematized by groups of features:
Group A (f(x1)) – characteristics that characterize the consumer value of an R&D product;
Group B (f(x2)) – features that characterize the market susceptibility of the R&D product;
Group C (f(x3)) – features that characterize the processes of transfer and commercialization of R&D product.
Group A combines comparative indicators that allow us to assess the value of R&D products for consumers. Consumer value characterizes the utility of an R&D product to meet the consumer’s needs. The value that the developer creates in the form of an R&D product determines the consumer value of the R&D product in the form of a finished product and the consumer value of the product that is obtained using the R&D product. This group of attributes is not personalized and is directly related to the characteristics of the R&D product. The level of this group of attributes allows us to assess the potential consumer value of R&D product in meeting the consumer’s needs.
In particular, the indicators include three levels of R&D product readiness for commercialization (technological, patent, and analytical). These three levels of readiness are related to the assessment of the completeness (feasibility) of the R&D product and determine the level of consumer value of the R&D product as a commodity.
NASA development can be used to determine the level of technological readiness [30]. This organization has developed and successfully uses a methodology for assessing the levels of technological readiness (TRL).
The level of patent readiness includes an assessment of the availability (absence) of documents for intellectual property objects or the process of obtaining them. The level of patent readiness is evaluated as the level of protection of the R&D product and directly affects the consumer value of the R&D product.
The level of analytical readiness (ARL) can be assessed by the degree of development of analytical documents by R&D product developers. The lowest level of analytical readiness is associated with the justification of the R&D product concept. The highest level of ARL is considered a business plan for introducing innovations to the market. The development of analytical documents is based on marketing information and allows you to simplify the process of using R&D product.
Signs of the level of novelty and level of improvement of R&D product characterize the competitive advantages of R&D product as an object of innovation. The level of novelty of R&D product is related to the number of technological parameters that are introduced by the developer for the first time and distinguish R&D product from analogues. If R&D is product improving or modifying an innovation to address customer needs, R&D product has a certain level of improvement, such as increasing the level of existing technological options, R&D product.
The level of quality and competitiveness of a product that is obtained on the basis of R&D product, related to the evaluation of indicators of competitive advantages of the product (products, work, service), which is expected to be obtained as a result of the application of R&D product.
The level of possible unauthorized reproduction of an R&D product is related to the level of complexity of the R&D product. A low level of complexity may expose the consumer to the risk of losing the value of the R&D product.
The level of environmental friendliness of R&D product provides an assessment of the impact of R&D product on the environment when using R&D product or a product made on the basis of R&D product (environmental cleanliness of the development application, reducing environmental pollution, energy saving, reducing raw material costs, etc.) development.
R&D product may not affect the ecology of society, or reduce (increase) its influence on the analogue, both positive and negative. Accordingly, the level of environmental friendliness of the R&D product can increase or decrease the consumer value of the R&D product.
Group B includes features that are correlated with the assessment of the conditions for the introduction of R&D product in a particular market (segment). These indicators allow us to assess the level of attractiveness of market conditions for R & D products (direct action marketing environment).
In particular, the market susceptibility of an R&D product is directly determined by the state and intensity of competition in the target market. A high level of competition, i. e. a large number of similar R&D products and R&D product substitutes, impairs market sensitivity and reduces the level of consumer value of the R&D product [31, 32].
The size of the sales market and the rate of change in its value directly affect the market signs of the introduction of R&D product. These attributes are related to the quantitative parameters of the sales market. Their high level allows us to assess the market sensitivity of the technology as high.
The update level of the market for R&D product provides an opportunity to assess the level of intensity of innovation in a particular economic activity and is associated with the estimation of time expected use R&D to product replacement or improvement.
The level of readiness of consumers to use the product that is obtained based on R&D product is associated with the stage of the life cycle of the need and technology and affects the marketing costs for the consumer.
Group C allows you to evaluate the features of transferring R&D product to a specific consumer and the specifics of implementing R&D product in its activities.
Therefore, the second and third groups of attributes and their estimates are adaptive to the conditions of a specific R&D product transfer transaction.
The third group of features involves comparing and determining the level of attractiveness of the conditions for transferring rights to R&D product to the consumer and the conditions for introducing R&D product to the consumer.
The transfer terms are evaluated by the components of the transaction (the level of attractiveness of the financial terms of the R&D product transfer-providing discounts, instalment payments, rentals, etc.), as well as by the competitive advantages that the developer provides when implementing the R&D product (the level of completeness of technological support by technology developers).
Becoming increasingly important the signs associated with the direct introduction of R&D product from the consumer to evaluate the need for and scope of additional time, financial and other resources to conduct additional tests (the level of difficulty implementation R&D product, the level of necessary material resource support integration of R&D product, the level of initial investment costs that should be involved to implement the R&D product).
This group includes indicators of commercial (investment) attractiveness of R&D product (the level of payback, the level of indicators of economic efficiency of investment costs (commercialization)).
The hierarchical order of factors of influence (f (x)) and their features (p) on the price of R&D products is shown in Fig. 1.
The elements of the hierarchy of factors of influence and attributes in Fig. 1 are interpreted as follows: S – relative indicator of price change of R&D product (top of the hierarchy), %; x1, x2, x3 – generalizing factors influencing the price of R&D product (thermal peaks); p11 … p1n, p21 … p2n, p31 … p3n –signs of factors influencing the price of the R&D product.
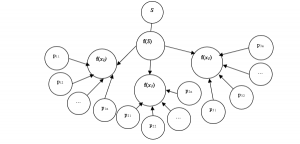
Figure 1: Hierarchical order of the influence of factors and attributes they contain on the price of R&D products
Reductions of fS, fx1, fx2, fx3 are performed based on a logical output with fuzzy knowledge bases. A fuzzy subset of a set S is defined as a set of ordered pairs , where is the characteristic function that takes values from some ordered set М = [0, 1] – many accessories .
In this case, the function indicates the degree of belonging of element x to a subset of A and is a tool for converting linguistic variables to a mathematical language for further application of the fuzzy logic method.
The description of the R&D product price adjustment process based on the application of fuzzy set theory can be divided into stages: 1) fuzzification; 2) development of fuzzy rules (generalization of antecedents and consequents; inference using logical connections); 3) defazzification.
4. Empirical results
The analysis made it possible to identify the most popular features of factors within groups A, B, and C at this time and assign them the value of linguistic terms for adjusting the price of R&D product using the Mamdani model (table 1).
Table 1: Signs and values of linguistic terms of factors influencing the price of R&D product
| Factors | Signs | Meaning and explanation of linguistic terms of the factor |
| 1 | 2 | 3 |
| Group A (f(x1)) – features of the consumer value of an R&D product | The technological readiness level of R&D product | L – low indicator level [0; 1.25; 2.5];
T – tolerable indicator level [2.5; 3.75; 5]; A – applicable indicator level [5; 6.25; 7.5]; H – high indicator level [7.5; 8.75; 10]. |
| The patent readiness level of R&D product | ||
| The analytical readiness level of R&D product | ||
| The level of innovation of R&D product | ||
| The improvement of R&D product | ||
| The level of possible unauthorized reproduction of R&D product | ||
| The level of probability of unexpected effects from the introduction and use of R&D product | ||
| The level of quality and competitiveness of the product that is obtained on the basis of R&D product | ||
| The environmental level of R&D product | ||
| Group B (f(x2)) – features of the market susceptibility of the R&D product | The level of direct competition | L – low indicator level [0; 1.25; 2.5];
T – tolerable indicator level [2.5; 3.75; 5]; A – applicable indicator level [5; 6.25; 7.5]; H – high indicator level [7.5; 8.75; 10]. |
| The level of competition among substitutes | ||
| The size of the market for R&D product | ||
| The growth rate of the R&D product sales market | ||
| The update level of the market for R&D product | ||
| The level of readiness of consumers to use the product that is obtained on the basis of R&D product | ||
| The level of time expected to use an R&D product before replacement or improvement | ||
| Group C (f(x3)) – features of the processes of transfer and commercialization of R&D product
|
The level of initial investment costs that need to be raised for the implementation of R&D product | L – low indicator level [0; 1.25; 2.5];
T – tolerable indicator level [2.5; 3.75; 5]; A – applicable indicator level [5; 6.25; 7.5]; H – high indicator level [7.5; 8.75; 10]. |
| The cost level for ongoing R&D product maintenance | ||
| The difficulty level of the integration of R&D product | ||
| The level of time spent on implementation and revision | ||
| The level of required regulatory support for R&D product implementation (obtaining permits, etc.) | ||
| The level of indicators of economic efficiency of investment costs (commercialization) | ||
| The level of attractiveness of financial terms of R&D product transfer | ||
| The level of recoupment | ||
| The level of expenses for marketing support of commercialization | ||
| The level of necessary material resource support for R&D product implementation | ||
| The level of access to the necessary resources to use R&D product | ||
| The level of need to establish various forms of interaction to use (or the level of sufficient capacity for self-implementation) R&D product | ||
| The level of completeness of technological support by technology developers |
The model for adjusting product R&D prices when they are transferred from universities to the business environment can be expressed as a function:
S = f (the value of consumption of R&D products, and the market susceptibility of R&D products, production and transfer processes and commercialization of scientific and technical products), which is a system of functions in the following order:
f (x1) = f (the technological readiness level of R&D product; the patent readiness level of R&D product; the analytical readiness level of R&D product; the level of innovation of R&D product; the improvement of R&D product; the level of possible unauthorized reproduction of R&D product; the level of probability of unexpected effects from the introduction and use of R&D product; the level of quality and competitiveness of the product that is obtained on the basis of R&D product; the environmental level of R&D product);
f (x2) = f (the level of direct competition; the level of competition among substitutes; the size of the market for R&D product; the growth rate of the R&D product sales market; the update level of the market for R&D product; the level of readiness of consumers to use the product that is obtained on the basis of R&D product; the level of time expected to use an R&D product before replacement or improvement);
f (x3) = f (the level of initial investment costs that need to be raised for the implementation of R&D product; the cost level for ongoing R&D product maintenance; the difficulty level of the integration of R&D product; the level of time spent on implementation and revision; the level of required regulatory support for R&D product implementation (obtaining permits, etc.); the level of indicators of economic efficiency of investment costs (commercialization); the level of attractiveness of financial terms of R&D product transfer; the level of recoupment; the level of expenses for marketing support of commercialization; the level of necessary material resource support for R&D product implementation; the level of access to the necessary resources to use R&D product; the level of need to establish various forms of interaction to use (or the level of sufficient capacity for self-implementation) R&D product; the level of completeness of technological support by technology developers).
Using the Mamdani model in the Fuzzy Logic Toolbox component of the MATLAB software package, a model was developed for adjusting prices for R&D products when they are transferred from universities to the business environment.
Based on the generated set of factor terms (table 1), a knowledge base has been developed – possible scenarios for the ratio of R&D product consumer value factors (Group A), market susceptibility R&D product (Group B), R&D product transfer and commercialization processes (Group C). 33 rules have been established and justified. Note that in some scenarios, the weight of the rule is applied, which is measured in the range [0 … 1] and indicates the level of significance of a particular scenario when adjusting R&D product prices. A fragment of this rule base is shown in figure 2.
Developed model of R&D product price adjustment from universities in the business environment based on the theory of fuzzy sets enables:
- to enter grades for groups of signs, A, B, C (previously prepared by experts) and to obtain the correction factor prices R&D product;
- the resulting coefficient takes into account the current market volatility conditions and can serve as a basis for developing a strategy for R&D product market development.
A fuzzy model for adjusting the price of R&D product when transferring from universities to the business environment is shown in figure 3.
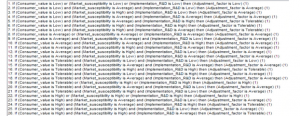
Figure 2: Fragment of the database of rules for adjusting prices for R&D products when they are transferred from universities to the business environment

Fig. 3. Fuzzy model of R&D product price adjustment transfer from universities to the business environment: (a) influence customer value R&D product and market receptivity to corrective cost ratio R&D product; (b) influence of market receptivity, R&D product and the nature of its transfer and commercialization at the correct price ratio of R&D product
Using the described methodology, we will adjust the prices of a number of R&D products in the sequence (table 2):
1) Expert assessment. Each feature of R&D product is characterized by the level of its manifestation, which is proposed to be assessed by experts, in points, in the range 1…3 where 1 is little or no effect symptom, 2 – moderate effect of the symptom, 3 – severe impact signs (col. 3), and then summarize the points and assign them a percentage (for example, on the first group: 9 points – the probability of a minimum 27 – maximum probable). Based on this, a generalized estimate is formed for a group of factor attributes, in %. Indicators for the corresponding R&D product are evaluated by experts based on questionnaires. The reliability of the evaluation results is confirmed by a sample of at least 15 experts;
2) identification of the obtained factor value, % (col. 4);
3) entering the obtained values into the developed model for determining the correction coefficient. The obtained factor value with the average values of this indicator in the Fuzzy Logic Toolbox component of the MATLAB software package (based on a pre-formed knowledge base) are compared.
Therefore, the proposed method takes into account the ratio of elements of income, cost and comparative estimation approaches.
The method makes it possible to conduct economic forecasting in conditions of uncertainty; in particular, it is especially important at the stage of conceptual decision-making, planning the transfer and commercialization of R&D products from the university to the business environment, and so on. The proposed method has been tested on a number of R&D products developed at Lviv Polytechnic National University (Ukraine) and prepared for transfer to the business environment.
Table 2: Factors, signs of R&D product and their estimates
| Factors | Signs | The level of feature manifestation, points | Meaning and explanation of linguistic terms of the factor |
| 1 | 2 | 3 | 4 |
| Group А (f(x1)) | The technological readiness level of R&D product | 1…3 |
L – low level of sign – 0 …25%; T – tolerable level of sign – 26 …50%; A – applicable level of sign – 51 … 75%; H – high level of sign –76 …100% |
| The patent readiness level of R&D product | 1…3 | ||
| The analytical readiness level of R&D product | 1…3 | ||
| The level of innovation of R&D product | 1…3 | ||
| The improvement of R&D product | 1…3 | ||
| The level of possible unauthorized reproduction of R&D product | 1…3 | ||
| The level of probability of unexpected effects from the introduction and use of R&D product | 1…3 | ||
| The level of quality and competitiveness of the product that is obtained on the basis of R&D product | 1…3 | ||
| The environmental level of R&D product | 1…3 | ||
| Factor estimate, % | 0…100% | ||
| Group В (f(x2)) | The level of direct competition | 1…3 | L – low level of sign – 0 …25%;
T – tolerable level of sign – 26 …50%; A – applicable level of sign – 51 … 75%; H – high level of sign –76 …100% |
| The level of competition among substitutes | 1…3 | ||
| The size of the market for R&D product | 1…3 | ||
| The growth rate of the R&D product sales market | 1…3 | ||
| The update level of the market for R&D product | 1…3 | ||
| The level of readiness of consumers to use the product that is obtained on the basis of R&D product | 1…3 | ||
| The level of time expected to use an R&D product before replacement or improvement | 1…3 | ||
| Factor estimate, % | 0…100% | ||
| Group C (f(x3)) | The level of initial investment costs that need to be raised for the implementation of R&D product | 1…3 | L – low level of sign – 0 …25%;
T – tolerable level of sign – 26 …50%; A – applicable level of sign – 51 … 75%; H – high level of sign –76 …100% |
| The cost level for ongoing R&D product maintenance | 1…3 | ||
| The difficulty level of the integration of R&D product | 1…3 | ||
| The level of time spent on implementation and revision | 1…3 | ||
| The level of required regulatory support for R&D product implementation (obtaining permits, etc.) | 1…3 | ||
| The level of indicators of economic efficiency of investment costs (commercialization) | 1…3 | ||
| The level of attractiveness of financial terms of R&D product transfer | 1…3 | ||
| The level of recoupment | 1…3 | ||
| The level of expenses for marketing support of commercialization | 1…3 | ||
| The level of necessary material resource support for R&D product implementation | 1…3 | ||
| The level of access to the necessary resources to use R&D product | 1…3 | ||
| The level of need to establish various forms of interaction to use (or the level of sufficient capacity for self-implementation) R&D product | 1…3 | ||
| The level of completeness of technological support by technology developers | 1…3 | ||
| Factor estimate, % | 0…100% |
5. Discussion
Taking into account peculiarities of market situation, groups of attributes can be supplemented and / or modified.
The proposed method is tested on a number of scientific and technological complexes, developed at Lviv Polytechnic National University and prepared for transfer to business environment. The obtained results are shown in Table 3.
Table 3: Results of testing the R&D product price adjustment method prepared for transfer from the university to the business environment
| № | R&D products | Factor / factor estimate, % | Correction factor, % | Current price, ths. USD | Adjusted price, ths. USD | Price change,
+ / -; ths.USD |
Market price, analogue price, ths. USD | ||
| Group А | Group В | Group С | |||||||
| 1 | 2 | 3 | 4 | 5 | 6 | 7 | 8 | 9 | 10 |
| 1 | Technology of optically-stimulated luminescent dosimetry | 13% (L) | 44% (Т) | 87% (H) | -0,0876 | 23 020,80 | 22 999,63 | -21,16 | 25 600 |
| 2 | Ensuring Technological Strength of Welded Joints with Armored Steel of ARMSTAL 500-Type | 11% (L) | 34% (Т) | 61% (A) | 0,0698 | 120,890 | 129,328 | +8,438 | 142,300 |
| 3 | Technology of surface friction strengthening of working surfaces of machine parts | 27% (T) | 44% (Т) | 71% (A) | 0,0321 | 156,90 | 161,936 | +5,036 | 165,89 |
| 4 | Mobile robotic platforms: MRP-05 “Borsuk” and MRP-07 “Kubik” | 47% (T) | 73% (H) | 82% (H) | -0,023 | 345,90 | 334,94 | -10,96 | 340,90 |
| 5 | Continuation of the life of machine parts by the method of surfacing under a layer of flux | 41% (T) | 44% (Т) | 73% (H) | 0,067 | 110,78 | 118,202 | +7,42 | 129,97 |
| 6 | Autonomous system for detection of smoke and carbon leakage monoxide | 51% (A) | 78% (A) | 77% (H) | -0,036 | 0,084 | 0,081 | -0,003 | 0,205 |
| 7 | Predicting and providing a set value of the initial resistance of heterogeneous and homogeneous materials of small thicknesses and cross sections with a point capacitor contact micro-welding | 39% (T) | 42% (T) | 72% (A) | 0,0912 | 0,370 | 0,403 | +0,033 | 0,518 |
| 8 | Equipment for contact point capacitor micro-welding | 34% (T) | 67% (A) | 45% (T) | -0,027 | 0,074 | 0,072 | +0,002 | 0,096 |
| 9 | Technology of surface friction displacement of working surfaces of machine parts | 43% (T) | 32% (H) | 68% (A) | 0,33 | 2,10 | 2,73 | +0,63 | 22,00 |
| 10 | Pocket City | 90% (H) | 45% (T) | 81% (A) | 0,002 | 3,20 | 3,2064 | +0,0064 | 28,00 |
| 11 | Bulk food mixer | 50% (T) | 48% (Т) | 63% (A) | 0, 0731 | 3,10 | 3,32 | +0,22 | 17,80 |
From the obtained results it can be seen, for example, in the cases of R&D products from the positions 2,3, 5, 7, 9, 10 and 7 (according to table. 3) іt is quite possible to set the price at a higher level (in particular, at the level of corrected estimates).
It is predicted that sales of such products will not decrease, but will remain at the same level. After all, the adjusted estimate is based on a number of indicators that reflect the market perception of the product, the level of which in these cases significantly exceeds the level previously included in the cost of R&D product.
In cases 1, 4, 6 and 8, the price of the R&D product should be slightly reduced, which will help to increase its price competitiveness in the market, and, consequently, increase sales volumes.
The values obtained as a result of applying the model are characterized by an indistinct number with a certain range of values, which makes it possible to operate not with probabilistic estimates, but with project data. This helps to achieve a higher level of price accuracy for R&D product when it is transferred from the university to the business environment.
6. Conclusions
Hypothesis 1 comes true. A methodological approach to pricing for R&D products during their transfer from universities to the business environment is developed based on taking into account changing market conditions, which in particular were given in table 2 and on the basis of certain expenses for the R&D products. The result can become the initial price of R&D products in the process of discussing the transaction for its transfer.
A practical study of R&D products for signs that determine the impact on their prices has shown that hypothesis 2 does not come true. Since each specific situation with R&D product has its own pricing features, due to many factors. For example, those features from factor groups A, B, and C that are relevant for their consideration when modelling prices for R&D products in the field of industrial electronics will not be relevant for R&D products in the field of it. In addition, the same evaluation criteria for R&D products in different industries may have different approaches to the interpretation of their essence. Therefore, the proposed list of features is not exhaustive, and may vary depending on the types of R&D products, their branches of application, features of transfer from the university to the business environment, and so on.
Hypothesis 3 is confirmed, since the methodological approach to calculating the correction factor for improving the pricing of R&D products when they are transferred from universities to the business environment is universal. This approach can be applied regardless of the stage of readiness of R&D products, and depending on the possibility of its transfer (in particular, in situations where the buyer is ready to purchase these R&D products at the initial stage of readiness). The methodological approach is effective for strategic pricing purposes.
The criterion for the effectiveness of modelling prices for R&D products in the framework of fuzzy set theory is expressed by maximizing the degree of suitability of the obtained estimates for a specific market situation.
The advantages of the proposed methodological approach to pricing for R&D products are as follows:
- justification of the price based on the principles of the author’s method gives a more reliable result (takes into account changing market conditions, implementation conditions for a specific buyer, is characterized by flexibility in accounting indicators, etc., the level of novelty);
- the method is aimed at accounting not only for static expenses (which sometimes even become irrelevant because they are spread over a long period of time), but also for dynamic market conditions of R&D products, conditions of the consumer’s operating environment, and so on;
- the developer (university) has a lot of flexibility in terms of profit management (in particular, according to the results of the study, in most cases, the margin profit increases);
- the level of trust of business partners is growing at the university, as the procedures for modelling prices for R&D products prepared for transfer from universities to the business environment become significantly more transparent;
- the author’s approach can be used not only for the price, but also for other pricing parameters for R&D products;
- the metrics used in the method can be modified depending on the type of R&D product (technological, product, etc.) and market conditions;
- Disadvantages:
- the use of the proposed method is advisable only in the short-and medium-term forecasting period;
- the method is essentially based on the competence of experts. Experts should have a proper level of knowledge, rely on the results of marketing research, and have operational data on the given characteristics.
The approach developed by the authors develops the principles of marketing pricing, providing opportunities to clarify the mechanism of influence of factors on the formation of the value of R&D products, and therefore their prices.
Conflict of Interest
The authors declare no conflict of interest.
Acknowledgment
We thank the developers of R&D products and scientists of Lviv Polytechnic National University (Ukraine), who shared the pearls of their knowledge and experience, which made it possible to conduct research and justify the results.
- N. Chukhray, N. Shakhovska, O. Mrykhina, M. Bublyk, L. Lisovska, “Consumer aspects in assessing the suitability of technologies for the transfer”, in 2019 Proceedings IEEE /14th International Scientific and Technical Conference on Computer Sciences and Information Technologies, 142-147, 2019, doi:10.1109/STC-CSIT.2019.8929879.
- About Tech Transfer [online] Available at: https://autm.net/about-tech-transfer / Pages/ https://www.autm.net/AUTMMain/media/Advocacy/Documents/Points_to_Consider.pdf [Accessed 21.03.2020]
- Global Funding Forecast Predicts Growth of R&D Spending Worldwide [online] Available at: https://www.rdworldonline.com/global-funding-forecast-predicts-growth-of-rd-spending-worldwide/ [Accessed 11.02.2020]
- The Economic Contribution of University/Nonprofit Inventions in the United States: 1996 – 2017. [online] Available at: https://autm.net/AUTM/media/About-Tech-Transfer/Documents/Economic_Contribution_Report_BIO_AUTM_JUN2019_web.pdf/ [Accessed 12.02.2020].
- Young University Rankings 2019 [online] Available at: https://www.timeshighereducation.com/world-university-rankings/2019/young-university-rankings#!/page/0/length/25/sort_by/rank/sort_order/asc/cols/stats/ [Accessed 12.04.2020].
- Technology Commercialization [online] Available at: https://research.umn.edu/units/techcomm/about-us/overview/ [Accessed 19.04.2020].
- Deakin University Annual Report 2018 [online] Available at: https://www.deakin.edu.au/__data/assets/pdf_file/0007/1906819/300519-Deakin_AR_2018_pages_web.pdf/ [Accessed 17.04.2020].
- D. Hague, Pricing in business (Vol. 23), Routledge, 2018.
- F. Brescia, G. Colombo, P. Landoni, “Organizational structures of Knowledge Transfer Offices: an analysis of the world’s top-ranked universities”, J. Technol. Transf,. 41(1),132–151, 2016, doi:10.1007/s10961-014-9384-5.
- P. Giuri, F. Munari, A. Scandura, L. Toschi, “The strategic orientation of universities in knowledge transfer activities”, Technological Forecasting and Social Change, 138, 261-278, 2019, doi:10.1016/j.techfore.2018.09.030.
- A. M. Rugman, L.Eden, (Eds.), Multinationals and transfer pricing. Routledge, 2017.
- D. Mescall, K. J. Klassen, “How Does Transfer Pricing Risk Affect Premiums in Cross-Border Mergers and Acquisitions? “, Contemporary Accounting Research, 35(2), 830-865, 2018, doi:10.1111/1911-3846.12397.
- A. Rocha, R. Lima, M. Amorim, F. Romero, “Payment types included on technology licensing agreements and earnings distribution among Portuguese universities”, Tékhne, 15(2), 100-107, 2017, doi:10.1016/j.tekhne.2017.11.001
- A. Singh, Technology software pricing in cloud computing era, Ph. D Thesis, Massachusetts Institute of Technology, 2017.
- R. Zhou, P. Tang, “The role of university Knowledge Transfer Offices: Not just commercialize research outputs!”, Technovation, 102100, 2019, doi:10.1016/j.technovation.2019.102100.
- C. P. Rossing, M.Cools, C. Rohde, “International transfer pricing in multinational enterprises”, Journal of Accounting Education, 39, 55-67, 2017, doi:10.1016/j.jaccedu.2017.02.002.
- M. Y. Wang, “The valuation methods and applications for academic technologies in Taiwan”, in 2016 Portland International Conference on Management of Engineering and Technology (PICMET), IEEE, 1320-1327, 2016. doi:10.1109/PICMET.2016.7806739.
- Q. Meng, J. Lou, J. Zhu, X. Bai, “Standard cost setting and application of improved ant colony optimization algorithm”, Systems Engineering-Theory & Practice, (7), 9, 2016.
- F. Barillas, J. Shanken, “Comparing asset pricing models”, The Journal of Finance, 73(2), 715-754, 2018, doi:10.1111/jofi.12607.
- Y. Jin, P. Lu, Q. Qi, Z. G. Tang, T. Xiao, “Tight approximation ratio of anonymous pricing”, in 2019 Proceedings of the 51st Annual ACM SIGACT Symposium on Theory of Computing, 674-685, 2019, doi:10.1145/3313276.3316331.
- M. W. Brandt, D. A. Chapman, “Linear approximations and tests of conditional pricing models”, Review of Finance, 22(2), 455-489, 2018, doi:10.1093/rof/rfy003.
- Q.Wang, N.Zhao, J.Wu, Q.Zhu, “Optimal Pricing and Inventory Policies with Reference Price Effect and Loss-Averse Customers”, Omega,102174,2019, doi:10.1016/j.omega.2019.102174.
- L. C. Kung, W. C. Lee, “Pricing and Diversification of Massive Online Open Course Platforms”, in 2017 PACIS , Twenty First Pacific Asia Conference on Information Systems Langkawi, 2017, 202. [online] Available at: https://aisel.aisnet.org/cgi/viewcontent.cgi?article=1077&context=pacis2017 [Accessed 23.11.2019].
- A. Mejía, R. Gilardino, F. B.Kristensen, L. P. Garrison, I. H. T. A. L. America, “Value-Based Pricing in Latin America: How Far Away Are We?”, Value in health regional issues, 17, 219-223, 2018, doi:10.1016/j.vhri.2018.09.007.
- P. M. Danzon, “Affordability challenges to value-based pricing: mass diseases, orphan diseases, and cures”, Value in Health, 21(3), 252-257. 2018, doi:10.1016/j.jval.2017.12.018.
- X. Qian, W. Liu, J. Yang, “Game theory analysis of technology adoption timing and pricing decision in supply chain system under asymmetric nash equilibrium”, Journal of Intelligent & Fuzzy Systems, 35(3), 3101-3111, 2018, doi:10.3233/JIFS-169664.
- T. J. Kudryavtseva, E. A. Ivanova, E. A. Kozlova, A. E. Skhvediani, “Pricing and assessment of competitiveness of innovative medical devices in the context of commercialization strategy”, Academy of Strategic Management Journal, 16, 110, 2017.
- A. Copeland, A. H. Shapiro, “Price setting and rapid technology adoption: The case of the PC industry”, Review of Economics and Statistics, 98(3), 601-616, 2016, doi:10.1162/REST_a_00539.
- S. Shekhar, U. Kumar, “Review of various software cost estimation techniques”, International Journal of Computer Applications, 141(11), 31-34, 2016, doi:10.5120/ijca2016909867.
- S. Hirshorn, S. Jefferies, “Final Report of the NASA Technology Readiness Assessment (TRA)”, Study Team, 2016. [online] Available at: https://ntrs.nasa.gov/archive/nasa/casi.ntrs.nasa.gov/20170005794.pdf[Accessed 27.12.2019]
- O. I. Karyy, H. V. Podvalna, “Relationship marketing of automobile transportation companies: The need of establishing mutual understanding with a client”, Actual problems of economics, 10(184), 149-158, 2016.
- G. T. Piatnytska, V. M. Zhukovska, “Domestic trade development: Current transformation and priopities in socialization”, Actual problems of economics, 11(173), 106-119, 2016.