
Effect of Cover Number on Distilled Water Production of Distillers with a Novel Water Feeding
Volume 5, Issue 5, Page No 913-919, 2020
Author’s Name: Mirmanto Mirmantoa), Made Wirawan, I Made Adi Sayoga, Abdullah Abdullah, Muhamad Faisal
View Affiliations
Jurusan Teknik Mesin, Universitas Mataram, Mataram, 83125, Indonesia
a)Author to whom correspondence should be addressed. E-mail: m.mirmanto@unram.ac.id
Adv. Sci. Technol. Eng. Syst. J. 5(5), 913-919 (2020); ![]() DOI: 10.25046/aj0505111
DOI: 10.25046/aj0505111
Keywords: Distiller, Glass cover, Seawater, Distilled water

Export Citations
An experimental study on the effect of a cover number of solar distillers with a continuous seawater feeding system was conducted. The seawater feeding in this study was a continuous feeding, which was not utilized yet in the previous studies. Three identical distillers i.e. single caver distiller, double cover distiller, and triple cover distiller were designed and examined. The material tested in this study was seawater taken from Tanjungkarang beach, Mataram, NTB, Indonesia, and converted into distilled water through distillation processes. The overall size of the distillers used was 1136 mm x 936 mm x 574 mm (outer dimension), while the absorber plat size was 0.8 m x 1 m. The experiment was performed in July 2019 from 09.00 to 16.00 local time. The results showed that increasing the number of glass cover decreased the amount of distilled water. The single cover distiller resulted in 949 ml a day, while the double and triple cover distillers resulted in 260 ml and 88 ml a day. The distiller with 3 glass covers was hotter than others so that the seawater vapour could not condense on the glass cover. Therefore, the distiller with a single glass cover was recommended.
Received: 03 September 2020, Accepted: 29 September 2020, Published Online: 12 October 2020
1. Introduction
Many regions in Indonesia always have freshwater shortages in the dry season; e.g. Gunung Kidul, East Jawa, Central and East Lombok, and East Nusa Tenggara. Meanwhile, freshwater is essential substantive for a human being. The human being cannot live without fresh water. Therefore, efforts to fulfil the demands freshwater are crucial. However, to have freshwater requires much cost. Is there a cheap device to produce freshwater?
Indeed, devices to make freshwater have been available and they are quite sophisticated. One of the devices is reverse osmosis (RO). Researches on RO have been rigorously conducted by many previous researchers, e.g. [1-2]. Nevertheless, the price of the RO is still expensive and its operational cost is high enough. Also, it needs electrical energy. Then, RO is suitable for the production of large quantities of water and applicable electrical energy. However, for the community who have no electrical power and they are in low economic class, RO may not be a choice. Is there a cheaper way of producing freshwater?.
Yes, there is a cheaper way for this; that is a distilling system. The distilling system can be performed for several cases; e.g. distilling dirty water, distilling seawater, distilling rainwater. However, the energy used for distilling is high and expensive. When the distilling system is run using liquid fuel or wood or gases, then this method is quite expensive. Consequently, this method is not suitable for people with low economic levels. The heat used for the distilling system can be from many sources such as solar energy (solar thermal distilling), mechanic energy, electrical energy, chemical energy and so on. Meanwhile, the process of distilling is also various; e.g. evaporation-condensation, filtration, and crystallization as reported by in [3].
Some distilling techniques that are being developed are solar chimneys, greenhouses, natural vacuum, adsorption desalination, membrane distillation (MD), membrane bioreactors (MBR), forward osmosis (FO), and ion exchange resins (IXR). RO followed by multistage flashing (MSF) and multi-effect distillation (MED) systems are the most widely applied desalination. According to the 2015 International Desalination Association (IDA), more than 300 million people depend on water produced by 18426 destinations in 150 countries, which provide more than 86.8 million cubic meters per day as explained in [4].
Western countries and developed countries prefer RO systems because of efficient power consumption, while Middle Eastern and Gulf countries prefer MSF and MED systems because oil sources are abundant. The largest desalination plant which started operating at the end of 2014 was Ras Al-Khair in Saudi Arabia. The plant produces around 728,000 cubic meters of desalination water per day by implementing MSF and RO technology as revealed in [5]. In [6], it was stated that the second-largest desalination plant was Carlsbad in California. United States produces around 190,000 cubic meters of desalination water per day by applying RO technology, opened in December 2015. Nevertheless, that’s not the case for low-income communities.The simplest desalination technology is the solar still distillation (SD) system, which is suitable for remote areas with low water demand because this system has low productivity, [7-9]. However, the problem for this distiller model is that its water production capacity is very low because the productivity depends on the device areas and environmental conditions.In reference [9], the supply of freshwater is only 0.5 litres per day, and a pyramid-shaped distiller with a size of 1 m x 1 m and a total height of about 50 cm was used. In [8], the yield of freshwater obtained was only 15 ml/hour, with a tool area of 1 m². For this reason, some studies modify solar still distillation with various absorber models and multilevel models. Multilevel models have been studied in [6], nevertheless, the effect of the cover number on freshwater production was not yet investigated. Recently, research on solar distillation using three different forms of the absorber was conducted in [10]. The form of absorber used was a flat plate, stringy absorber, and finned absorber. He explained that the fin absorber produced larger freshest water. Unfortunately, he did not examine the cover number in his study. Meanwhile, increasing the cover number raises the water temperature in the basin of the distiller. The more amount of glass is expected to be able to evaporate more seawater so that the distilled water becomes more numerous. Besides that, this distillation tool uses a continuous system, unlike distillers that have been studied by previous researchers. The continuous feed water creates the seawater level inside the basin constant. Consequently, the effect of water thickness in the basin can be eliminated and the water production continuously occurs. To analyze experimental data, equations about heat transfer, evaporation and condensation are taken from [7-9]. The equations determine the heat input, heat use and heat loss to the environment. The long term aim of this study is obtaining the cheapest, simplest, easy to operate, distiller, but the distiller has high water productivity.
2. Research Method
The research apparatus comprised of three identical distillers. One distiller had one cover, another distiller contained 2 covers and the rest included 3 covers. The absorbers of the three distillers were made of a galvalume flat plate. The apparatus is indicated in Figure 1. The distiller with a single cover is case A, the distiller with double covers is case B, and the distiller with triple covers is case C. The dimension of the distillers was 1136 mm x 936 mm x 574 mm, while the areas of absorbers were 1 m x 0.8 m.
The seawater was poured down in the top reservoir, and then it flowed forward the distiller chamber. After the level of the seawater inside the distiller reached a certain height, the valve with a floating ball closed by its self. However, when the vaporization took place so that the seawater level decreased, the valve opened automatically and the new seawater came into the distiller basin and so on until the complete experiments were done for one day. Using this method, the seawater level remained constant. This was called a novel feeding seawater or a continuous seawater feeding. This system, however, was not utilized yet in the previous studies. The seawater level in the basin was kept at approximately 4 cm. The temperatures in this current study were verified by K type thermocouples that were calibrated with an accuracy of ± 0.5°C. The solar power was measured using a pyranometer Lutron SPM-1116SD with accuracy was employed to record the solar power with an accuracy of ± 5% reading (stated in the device specification). Meanwhile, the wind velocity around the distillers was predicted using an anemometer Benetech GM8901 with an accuracy of ± 3% reading as stated in the specification brochure. The experiments were conducted at the Universitas Mataram at positions of 08° 33′ – 08° 38′ South Latitude and 116° 04′ – 116° 10′ East Longitude. The freshwater obtained was weighed at every hour using a digital scale. The density of the seawater was measured by weighing it on the scale and putting it in the glass volume. It was of approximately 1111 kg/m³.
Parameters tested in this study were temperatures, solar power, wind velocity, and distilled water. The solar power, temperatures, and distilled water were measured directly, while other parameters such as useful heat, the heat lost and efficiency were calculated. Some equations employed to analyze the parameter data were taken from [7-9].
Heat input is heat from the sun (solar power) multiplied by aperture area and glass cover transmissivity. The heat passes through the glass cover can be estimated using Eq. (1) that was taken from [11].
![]()
Qin is the heat input (W) absorbed by the absorber plate in the distiller basin; τ is the transmissivity of the glass cover 0.88 as reported in [12-13]. For the double cover distiller, the transitivity was obtained to be 0.8², and for the triple cover distiller, the emissivity was determined as 0.8³. Meanwhile, the heat that is used for heating the seawater from the initial temperature to the final temperature is expressed in Eq. (2). Equation (2) can be obtained in [14].
Qs is the sensible heat (W), m indicates the seawater mass in the basin (kg), cp represents the specific heat (J/kg°C), Tf and Ti are the final and initial temperatures (°C), while t is the time (s). Besides sensible heat, as expressed in Eq. (2), there is latent heat. The latent heat is the heat that is used for evaporating the seawater inside the distiller and written in Eq. (3) that can be found in [14].
![]()
Ql is the latent heat (W), ml is the mass of the distilled water (kg), hfg is energy for evaporation (J/kg). For that, according to [14], the total heat can be written as:
![]()
Efficiency parameter is a parameter that shows the distiller performance. The efficiency can be expressed as Eq. (5) that can be attained in [14].
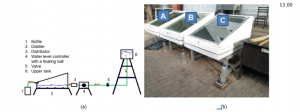
Figure 1: Schematic diagram of the apparatus; (a) process line schematic, (b) photograph, Faisal [10].
3. Results and discussion
Figure 2 shows the solar power that was recorded during experiments for case A, case B, and case C at three days in June 2019 at Jurusan Teknik Mesin, Universitas Mataram, Indonesia. The solar power recorded was not influenced by the cases because all the distillers were close together; therefore, the solar power for the three distillers was the same. In figure 2, the solar power increases with the observation time and then it reaches a peak at about 13.00 (local time). After 13.00, it decreases continuously. However, the trends were also found in the previous studies conducted by Faisal [10], and Mirmanto et al. [15]. Nevertheless, on the third day, at around 10.00 (local time), solar power decreased. That was caused by the temporary cloud covering the sun. The solar power was recorded at every hour for figure 2, therefore, the effect of the cloud can be seen clearly. Then, the solar power was averaged and the results of recording solar power were 414.5 W/m² (day 1), 530.4 W/m² (day 2), and 537.2 W/m² (day 3). Of course, the results of recording solar power from day to day were different, they depended on the brightness of the sun. However, in general, solar power has a maximum value at around 13.00 (local time), because at 13.00 the sun shines brightly and also has maximum heat radiation. After 13.00 the solar power decreases further till at 16.00 (local time). Based on solar power, the heat input can be estimated using Eq. (1) and the calculation result is presented in figure 3.
Meanwhile, the heat input is different for each distiller because of the number of the glass cover. For the single cover, the transmissivity is approximate 0.88, while for the double and triple covers; the transmissivities are 0.7744 and 0.681 respectively. Hence, increasing the number of covers decreases transmissivity.
Figure 3 shows the trend of solar power, in general, increases with the time until it reaches a peak value at about 13.00 o’clock local time. After that, the solar power decreases continuously until the experiment is complete. This phenomenon was due to the sun cycles. The sun rises, afternoon, and then sunset.
The experimental heat input is shown in figure 3. The heat input was calculated using Eq. (1) on the experimental data basis. The trend of this parameter is almost the same as that of solar power trends. However, the magnitudes for the three cases are different. This was due to the different number of the cover. The higher the number of covers, the lower the transmissivity.
Recorded absorber temperatures are presented in figure 4. The trends of the temperature are different from that of solar power. The temperatures increase with the observation time, then after at around 13.00 o’clock, they are flat until the experiment is finished at about 16.00 o’clock. For the single cover, the absorber temperature at after 13.00 o’clock is constant, while that of double and triple covers still increases fairly. This trend indicates that adding the number of covers elevates the absorber temperature. This could happen because the heat inside the distiller was difficult to be emitted back to the ambient. It was trapped by the number of glass covers and the gaps between the cover. Nevertheless, distillers with multiple covers had higher heat losses than that with a single cover. The heat loss occurred due to the high different temperatures between the absorber and the ambient. Mostly the heat loss happened through the conduction mode. The heat flowed through the distiller walls and bottom.
To know further the effect of cover numbers, let’s see Figure 5. Figure 5 shows the recorded seawater temperatures. Figure 5 indicates that trends of the seawater temperatures are almost the same as the trends of the absorber temperatures. The seawater temperatures increase with time and then get constant. Moreover, the magnitudes of the temperatures are nearly the same. This was caused by the direct contacts of absorber and seawater. Previous studies also showed similar findings, e.g. in [8, 10, 15].
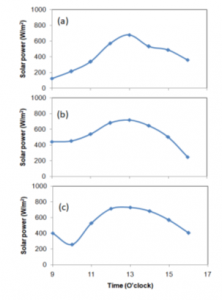
Figure 2: Recorded solar power: (a) day 1, (b) day 2, and (c) day 3

Figure 3: Calculated heat input (Qin) for the three cases: (a) day 1, (b) day 2, and (c) day 3.
Another parameter recorded in this study was the amount of distilled water. Distilled water production per hour is presented in Figure 6, and the accumulated distilled water production is given in Figure 7, while the distilled water daily production is shown in Figure 8. The distilled water density was measured to be of approximately 995.2 kg/m³ at 30°C. The hourly distilled water production seems irregular, sometimes it is much and other times it is less. This was due to the sky and environmental conditions. At the time where the sky was clear, the distilled water production was high and vice versa. This phenomenon was also found in [10, 16]. The distilled water production obtained in [10] was greater than that of [16]. This was due to the different day.
Figures 6 and 7 show that the distiller with a single cover produces larger hourly distilled water. This phenomenon was due to the cover temperatures. The cover of the distiller that contacts directly to the vapour for the single cover distiller was lower than that of double and triple covers. Therefore, when the vapour came up to the cover, it could be easily condensed. However, for the double and triple cover distillers, the lower glass cover that touched the vapour had a higher temperature, as a result, the vapour could not condense. When the glass covers were removed from the distillers at the end of the experiment, the vapour coming out from the distillers with double and triple covers was much larger than that from the single cover distiller. Moreover, the absorber and seawater temperatures for the distiller with double and triple covers were higher than that of the distiller with a single cover. Hence, why did the distillers with double and triple covers result in less distilled water? This was due to the less condensed vapour on the glass cover. Furthermore, the results of this study were less than that of [17, 18]. This was due to the simple shape of the distillers utilized in this current study.
Different from hourly distilled water production, accumulated distilled water production increased with time, see figure 7. This finding was also found by previous researchers; e.g. [15, 17]. In [16], the total distilled water production was almost 1500 ml a day. They started their experiment at 9.00 local time and finished at 16.00 local time. Meanwhile, this study produced maximum distilled water of 949 ml.
Heat transfer calculation results are presented in figure 8. The heat transfer here is called useful heat; Q. Q can be computed using Eq. (4) that comprises sensible heat and latent heat. The useful heat increased drastically at the beginning of the experiments. After at 10.00 am, the useful heat decreased continuously till the experiments were finished. The trend of the useful heat was due to heat absorption. At the beginning of the experiment, much heat could be absorbed because the seawater temperature was still low. At this level, the heat transfer occurring was sensible heat. The heat was used for heating the seawater inside the distiller. As the seawater temperature increased, the heat absorbed decreased, and the heat transfer mode changed to a combined heat transfer; e.g. sensible and evaporation heat transfer. The evaporation heat transfer is called latent heat transfer. For this case, the seawater changed to vapour.
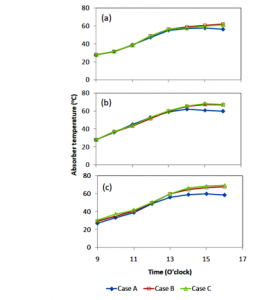
Figure 4: Trends of the absorber temperatures for three cases: (a) day 1, (b) day 2, and (c) day 3.

Figure 5: Seawater temperature for the three distillers; (a) day 1, (b) day 2, and (c) day 3.
In figure 8, the useful heat contained sensible and latent heat. The useful heat was predicted using equations (2) and (3). The mass of the vapour condensed was used to estimate the latent heat. For case A, the distilled water production was larger than for cases B and C, as a result, the useful heat obtained for case A also was higher than for the other two cases. This was due to the larger condensation for case A.
Another variable that indicates the performance of the distiller is efficiency. Efficiency is a comparison of useful energy to heat input. The useful heat is Q and the heat input is Qin. Qin is estimated using Eq. (1). Therefore, efficiency can be predicted using Eq. (5) and the calculated efficiency is presented in figure 9.
Figure 9 indicates that the trend of efficiency is almost the same as the trend of the useful heat. At the beginning of experiments, the efficiency increased sharply, and it reached that peak value. After the peak value was achieved, the efficiency decreased continuously until the experiments finished. However, for case A, the efficiency trend was a little bit different. At around 15.00 o’clock, it increased again. This occurred because the production of distilled water was still ongoing, but the heat input was down. For cases B and C the distiller still generated much vapour, but the lower layer of the glass cover was still hot, then the vapour could not condense, as a result, the useful heat (latent heat) was low. Consequently, the efficiency for case B and C was lower than that for case A.
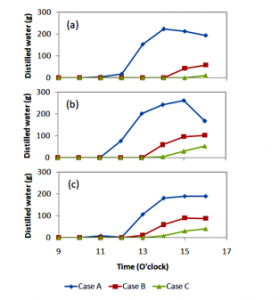
Figure 6: Hourly distilled water production obtained for three days. (a) day 1, (b) day 2, and (c) day 3.
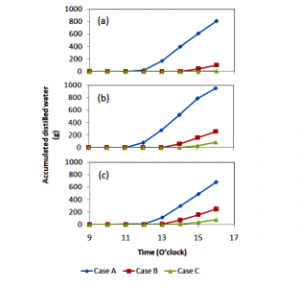
Figure 7: Accumulated distilled water production; (a) day 1, (b) day 2, and (c) day 3.
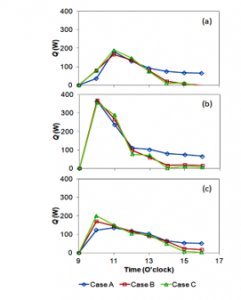 Figure 8: Useful heat transfer in the distillers for the three cases and three days.
4. Conclusions
The study to know the effect of glass cover number on the distilled water production was conducted with several tested parameters and continuous feeding seawater. Some findings that can be stated are: the solar power in Indonesia has a large potential; the hourly distilled water productions are scatter depending on sky conditions. The major remark in this study is that much-distilled water production can be achieved just using single cover; less vapour can be condensed in the double and triple cover distillers; the largest efficiency is obtained for the single cover distiller. A single cover distiller is recommended to be utilized for producing freshwater.
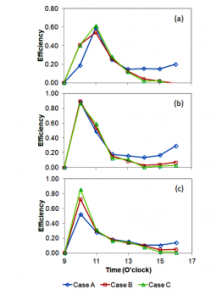
Figure 9: Distiller efficiency for the three cases and three days.
Acknowledgement
The author would like to thank the DRPM for the funding and Jurusan Teknik Mesin, Universitas Mataram for the facility.
Nomenclature
| A | = | Aperture area (m²). |
| cp | = | Specific heat (J/kg K). |
| I | = | Solar power (W/m²). |
| m | = | Seawater mass (kg) |
| Q | = | Useful heat (W). |
| Qin | = | Heat input (W). |
| Ql | = | Latent heat (W). |
| Qs | = | Sensible heat (W). |
| t | = | Time (s). |
| Ti | = | Initial seawater temperature (°C). |
| Tf | = | Final seawater temperature (°C). |
| η | = | Efficiency |
- A.H. Slocum, M.N. Haji, A.Z. Trimble, M. Ferrara, S.J. Ghaemsaidi, “Integrated pump hydro reverse osmosis system”, Sustainable Energy Technologies and Assessments, 18, 80-89, 2016. doi:10.1016/j.seta.2016.09.003
- N.K. Khanzada, S.J. Khan, P.A. Davies, “Performance evaluation of reverse osmosis (RO) pre-treatment technologies for in-land brackish water treatment”, Desalination, 406, 44-50, 2017. doi:10.1016/j.desal.2016.06.030
- A. Alkaisi, R. Mossad, A. Sharifian-Barforoush, “A review of the water desalination systems integrated with renewable energy”, Energy Procedia, 110, 268 – 274, 2017. doi:10.1016/j.egypro.2017.03.138.
- M. Baawain, B.S. Choudri, M. Ahmed, M., A. Purnama, “An Overview: desalination, environmental and marine outfall systems”, Recent Progress in Desalination, Environmental and Marine Outfall Systems, 1, 3-10, 2015. doi:10.1016/j.egypro.2017.03.138.
- S.M. Cheong, G.W. Choi, H.S. Lee, “Barriers and solutions to smart water grid development”, Environmental Management, 57(3), 509-615, 2016. doi:10.1007/s00267-015-0637-3
- N. Heck, A. Paytan, D.C. Potts, B. Haddad, “Coastal residents’ literacy about seawater desalination and its impacts on marine ecosystems in California”, Marine Policy, 68, 178-86, 2016. doi:10.1016/j.marpol.2016.03.004
- Water and waste water tratement spesialist yang dipercaya dalam proses pengolahan air, tirtamandiri.com.
- A. Mukadim, M. Wirawan, I.B. Alit, “Analisa pengaruh variasi bentuk absorber pada alat destilasi air laut terhadap kenaikan suhu air dalam ruang pemanas dan jumlah penguapan air yang dihasilkan”, Dinamika Teknik Mesin, 3(2), 127-135, 2013.
- Mirmanto, Destilasi surya pengubah air laut menjadi air tawar. Laporan Penelitian DPP/SPP, Universitas Mataram, 2003.
- M. Faisal, Pengaruh variasi absorber alat distilasi air laut tenaga surya terhadap produksi air tawar, Skripsi, Jurusan Teknik Mesin, Universitas Mataram, 2019.
- J.A. Duffie, W.A. Beckman, “Solar Engineering of Thermal Processes”, 4th Edition y John Wiley & Sons, Inc., Hoboken, New Jersey, 2013.
- B.Y. Idi, D.K. De, “Transmissivity of the glazing surface of a solar flat plate collector based on the metrological parameters of Yola, Nigeria”, Journal of American Science, 7(1), 639-643, 2011.
- M. Syahri, “Rancang bangun sistem desalinasi energi surya menggunakan absorber bentuk separo elip melintang”, Prosiding Seminar Nasional Teknik Kimia “Kejuangan”, Pengembangan Teknologi Kimia untuk Pengolahan Sumber Daya Alam Indonesia, Yogyakarta, 22 Februari, 2011.
- J.P. Holman, “Heat Transfer”, 8th Edition. McGraw-Hill Inc., USA, 1997.
- M. Mirmanto, M. Wirawan, I.M.A. Sayoga, S. Syahrul, M. Faisal, A. Abdullah, “Effect of absorber types of conventional distillers on the amount of distilled water production”, Frontiers in Heat and Mass Transfer, 13, 1-7, 2019. doi:10.5098/hmt.13.10.
- Abdullah, “Pengaruh jumlah cover alat distilasi air laut tenaga surya terhadap poduksi air tawar”, Skripsi, Jurusan Teknik Mesin, Universitas Mataram, 2019.
- A.A. Kabeel, “Performance of solar still with a concave wick evaporation surface”, Energy, 34, 1504–1509, 2009. doi:10.1016/j.energy.2009.06.050.
- Mulyanef, Marsal, R. Arman, K. Sopian, K., “Sistem distilasi airlaut tenaga surya menggunakan kolektor plat datar dengan tipe kaca penutup miring”, Teknik Mesin, Universitas Bung Hatta, Padang, Indonesia, 2014.