
Power Loss Minimization using the Integration of DGs and Reconfiguration of Distribution System: Applied on Real Distribution Feeder of Urbain Areas of Kenitra City in Morroco
Volume 5, Issue 5, Page No 74-79, 2020
Author’s Name: Ismail Moufida), Soukaina Naciri, Hassan EL Moussaoui, Tijani Lamhamdi, Hassane El Markhi
View Affiliations
Intelligent Systems, Georessources and Renewable Energies laboratory (ISGREL), Sidi Mohamed Ben Abdelah University; FST, ,Fez, 2202, Morocco
a)Author to whom correspondence should be addressed. E-mail: ismail.moufid@usmba.ac.ma
Adv. Sci. Technol. Eng. Syst. J. 5(5), 74-79 (2020); ![]() DOI: 10.25046/aj050511
DOI: 10.25046/aj050511
Keywords: NOP, Distributed generation, Power loss, Distribution network

Export Citations
Optimal integration of distributed generation (DG) into the distribution system results in reduced power losses and improved bus voltages. In this article, a combination of two techniques has been analyzed:
The integration of DG and reconfiguration of the distribution system by removing the Normally Open Point NOP in different places of the system.
These two techniques are applied to a real distribution network ” distribution network of Kenitra city in Morroco”, considering as key objectives the reduction of power loss and improvement of voltage profile.
To investigate the effectiveness and robustness of our system a model was performed using ETAP. The simulation results improve that we can minimize greatly the power losses in the distribution network by the implementation of DGs and reconfiguring our distribution network.
Received: 29 June 2020, Accepted: 21 August 2020, Published Online: 09 September 2020
1. Introduction
The role of the distribution network transfers the electrical energy directly from the substations to consumers. The distribution network administrator currently faces several challenges resulting from increased penetration of renewable energy resources and the demand of customers. The Distribution Network Operators (DNO) has noted that the traditional solution of the network may not be sufficient. The increasing load demand in the distribution network creates an important challenge for research in phases of studying the management of the distribution network to satisfy the need with the actual infrastructure.
The determination of the grid concept of the distribution system depends on special specifications and side conditions [1]. distribution of electrical energy in a grid network is done in two ways: closed-ring networks and radial networks as presented in Fig.1.
Radial grid: The open ring is generally the structure of the distribution network as presented in Figure 1, the advantage of this structure is that during a fault, the currents propagate in one unidirectional direction, so the detection and the position of faults became more flexible than in closed rings arrangement. Moreover, the inconvenience of this architecture is that when a fault befalls, the part of the network after the fault is detached from the substation, this situation makes the management of the distribution system more complicated.
Closed-ring grid: The closed ring grid has the same structure as the radial structure, just that a part of the rings is performed as closed rings as we can see in Figure 1 b. the problem of this kind of structure that the protection of the grid became more complicated than in the radial case because when a fault happens the currents propagate in different ways. The disadvantage of a radial configuration can be skipped by adopting the closed-ring structure [1].
The benefit of the closed-ring structure is that more than one charger feeds the system, so if a feeder is inoperative or in maintenance, the grid is stay powered by the other feeders. In this way, customers are not concerned, even if one of the feeders is down or becomes inoperative. Moreover, the ring dispensing of the network is provided with many isolated parts. Furthermore, in the case of a fault in a section, this section is isolated by opening the corresponding breakers.
Usually, the structure of distribution networks is carried out according to the network shown in Figure 1.the closed-ring distribution network is created with a NOP, dividing the circle into two outlets from an open electrical point [2].
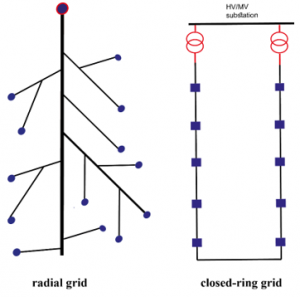
Figure 1: The structure of the closed-ring grid and radial grid.
By using NOP in the distribution network we assure the selectivity of the protection systems and minimize the consequence of faults; so the number of customers affected in the event of failure can be reduced in this case.
The power flow can be affected by the position of NOP. Throughout the day, the number of customers changes, so the power flow also changes.
Consequently, the optimal position of the NOP would change, so the current in each power line became nearly equal. we can reduce power losses and improve the voltage profile of the distribution network by adjusting the loads between the adjacents feeders.
Authors in [3] have proposed a strategy to determine the suitable best location for DG “Distributed Generations” to reduce distribution power losses. The approach is based on a specific loss equation. The strategy has been examined with different size of DG. The authors in [4] have defined an objective function of cost to place solar, wind, and fuel cell. An analytic hierarchy method has been utilized to decide on finding the optimal positions for various sorts of DGs.
The improvement of voltages profile placing DGs in different positions has been discussed in [5]. They have suggested voltage sensitivity to install DGs. Authors in [6] have defined the position of DG to minimize the power losses, the algorithm of Kalma is used to determine the optimal size of DG.
Authors in [7], proposes an approach to determine the Hosting Capacity of distributed generation (DG). The approach proposes a model of the lines utilizing the π type. The capacitance of different lines is not neglected, and we obtained a higher value of HC. we are concentrate on this study on line overloading.
An optimal power flow method and hybrid PSO for optimal position and sizing of DG considering the power loss reduction and DG cost minimization was proposed in [8]. The optimization problem satisfies some constraints like the thermal limit of the transformer and lines and the limit of the voltage profile. Authors in [9] proposed a method for the optimal position of DGs. They have also discussed the sensibility factor to choose the best place of DG. In [10] a GA methodology respecting indices of power loss and voltage profile was discussed. Authors in [11]have suggested a strategy to choose the position and the size of the DG regarding the constraints of minimizing power losses and harmonic distortion. They adopted a multi-objective PSO approach based on conventional weighted aggregation which may lead to a suboptimal solution in some cases. The optimal DG placement is determined based on voltage stability study as a security estimate by authors in [12].A method to evaluate the Sizing and sitting of various DGs based on the reduction of power loss was proposed by authors in [13].
In [14], authors have presented a technique to choose the optimal DG placement Based on Power Stability Index (PSI) based DG placement. In this method, the value of PSI is calculated for each row and sorted from the most important value to the most inferior value. DG was placed at the bus terminal of the most important PSI branch. The PSI value has been recalculated and by the same method location for the next DG. Authors in [15] have discussed a loss sensitivity based DG placement strategy. They used the bus ranking approach based on loss sensitivity and for the placement of DG they are placed in the buses who have the highest loss-sensitive. A simple strategy for the optimal position and sizing of generators in different buses was presented in [16]. The most important aim of this strategy is to minimize the power loss and cost of the distribution network. The authors also discuss the optimization of the weighting factor, which equilibrate loss factors and cost in order to achieve the desired aims with the highest advantage possible. In [17] an optimal placement and sizing of CBs and DGs in distribution systems the based on Spring Search Algorithm (SSA) are proposed. The authors in [18] have studied the impact of using SOP in the distribution system to reduce power losses and improving the voltage profile. Authors in [19] have proposed a new strategy for distribution systems including DG. The principal objects were the reduction of the risk factor and the cost reduction of total installation and operational. The optimal size and position of the DG are fixed in the planning step. The optimization of real power loss and the DG injection index are the two objective functions studied in this DG planning. Authors in [20] have analyzed the optimal placement of DG in order to assure voltage stability and power loss minimization of the distribution network. They have also adopted the PSO technique to find the optimal size and the position of DG. The optimal size and location of a single DG unit in different distribution systems are studied in the paper.
This paper proposes a comparison between two approaches in order to minimize power loss and improving the voltage profile of the distribution network. The paper is organized as follows.
In the first section, the formulation of the problem of power loss minimization and voltage improvement is discussed. In the second part, a description of our test network was discussed.
The third section is divided into two parts. In the first part, the efficiency of the suggested approach is tested to choose the best point of the open point in our distribution systems.
In the second part, DG is placed in a different place to choose the best point of the minimum of power loss, and the achieved results are presented. Lastly, some important conclusions are drawn.
2. Problem formulation
2.1. Power and current in the branches
we consider a distribution network with a radial configuration formed of a set of branches as presented in fig.2. Each branch of this network is modeled as a resistance in series with a pure inductance. The impedance of any branch “i” of this network is written as follows:

Figure 2: Distribution network with a radial configuration formed of two buses.
The load flow in this type of network is done using a BIBC matrix (bus injection to branch current) to calculate the currents flowing through all branches of the network.
For a busbar to which a load is connected, the apparent power S is represented by:
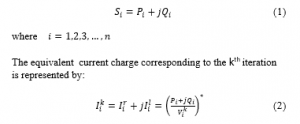
where:
and are the voltage load and current of the busbar for the kth iteration.
are the imaginary and real parts of the busbar load.
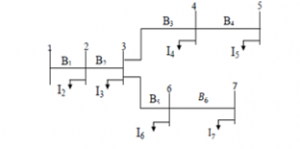
Figure 3: A simple distribution network of 7 busbars and 6 branches.
2.2. The BIBC Matrix
The load currents at the busbar are obtained using equation (2), as well as the currents circulating through the branches are determined by utilizing Kirchhoff’s law to the studied distribution network. A simple distribution network constituted of 7 busbars and 6 branches presented in Figure 3 is used as an example to facilitate the description of the method for determining the BIBC matrix.
The branches currents can be represented as a function of load currents as results:
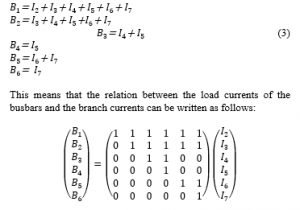
In general, equation (3) can be written as follows:
[B] = [BIBC] [I].
where BIBC represent the matrix of currents injected into the busbars which are a matrix containing only the values 0 and 1.
2.3. Active and reactive power losses:
The determination of the power flow is essential to locate the overloaded electric lines and to calculate the value of the power losses.
The active power losses at a branch (i) are written as follows:
![]()
We can determine the total power losses of the network by summing the losses of all branches of the equation (4).
![]()
The reactive power losses at a branch (i) may be written as follows:
We can also determine the total reactive power losses of the network by summing the losses of all branches of the equation (6)
2.4. Objective function:
The objective function is the measure of the system considered. The primary aim is improving the voltage profile and keep it between regulatory limits. But, this goal is transcribed mathematically as a constraint, because the voltage limits are strict limits that the system cannot exceed and therefore they cannot be expressed as an objective function.
There are several possible objectives for solving the problem of choosing the optimal location of DGs in the distribution system. Among the most common goals are:
- Improvement of voltage profile: we seek to balance voltage profile while trying to minimize the sum of the relative deviations of the voltage in each node compared to the nominal tension.
- Minimization of online losses: Reducing Joules losses is becoming a priority for distribution network operators. This allows an increase in transit margins on power lines in addition to improving the voltage profile.
Fobjectif = min (8)
So the objective function is associated with the nature of decision variables, constraints, and depends on the type of optimization adopted.
2.5. Technical constraints related to the problem
Voltage constraint: The value of the voltage profile of each busbar must be limited as follows:
Vmin ≤ Vi ≤ Vmax
Where Vmin = 0.95 p.u. and Vmax = 1.05 p.u. are the minimum and maximum of voltage amplitude values at each busbar, respectively. Active and reactive power balance constraints :
PG = Ploss + PD and QG = Qloss + QD
where
QG and PG are the reactive and active powers injected by the DG while QD and PD are the reactive and active load powers at the kth node.
Qloss and PLoss are reactive and active power losses in the system.
3. Test Network
The network studied is the MV network of the Kenitra city in Morroco it consists of a source substation with an installed power of 36MVA and a short-circuit power of 397.15 MVA, which supplies two distribution lines L1 and L2, its lengths are 9.4 km and 12 km respectively. This line has various characteristics (Blue, green and orange) which are shown in Table 1. This feeder aliments a load of more than 4.5 MW and 2.76 MVAR.
Table 1: Cables Parameters
|
Cables |
Parameters | ||
| Impedance Ω/km | Capacitance nF/km | Maximum current A | |
| Green | 0.239+j0.11 | 300 | 300 |
| orange | 0.372+j0.13 | 220 | 225 |
| blue | 0.145+j0.1 | 370 | 400 |
The characteristics of this distribution network in Figure 4 are given as follows:
- Number of busbars = 40;
- Number of branches = 39;
- Slack bus N ° = 1;
- Nominal voltage 20 kV

Figure 4: Studied distribution network
4. Simulation and discussion
For simulation purposes, the network studied was implemented in ETAP environment. The objective of this part is to choose the best position of DG for our distribution networks, so here we are interested in two constraints, the power losses and the voltage profile.
In this paper, we considered two cases:
Case 1 we fixed the position of the NOP and we remove the DG to have the minimum of power losses and we ameliorate the voltage profile.
Case 2 we fixed the DG in the optimal position and we change the position of NOP to minimize the power losses.
4.1. Simulation of case 1
We study the network for the first time by removing the DG place.
The attitude of the distribution network after changing the position of DG is illustrated in Figures 5 & 6.
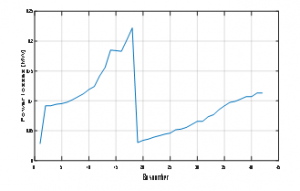
Figure 5: Power losses after the integration of DG in different buses
As presented in Fig. 5 we can see that the power losses change after removing DGs for different positions in our distribution system. However, we can remarque also that the power losses are minimum after the integration of DG in busbar number 18.
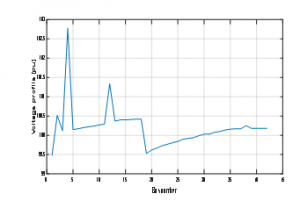
Figure 6: The voltage profile after the integration of DG in different buses
For the voltage profile, we took the average voltage value for the buses because for each DG location we have 41 voltage values.
As we can see in fig.6 the voltage profile for all buses of our distribution system is improved after the integration of DG in different positions, so with the integration of DGs, we can avoid the voltage drop. for the best place of DGs, we can remarque that for bus 18 the voltage profile is near to 1 pu.
4.2. Discussion of case 1
We can note in Fig. 5 that the integration of DG in our system can greatly reduce the total power losses of 0.15 MW, this reduction of power losses are important in bus bar 18; so the best place to integrate our DG is in this busbar, however, we can also observe in fig.6 the improvement of the voltage profile after using dg in our distribution network, we can remarque that for bus 18 the voltage profile is near to 1 pu, we can express this by the integration of DG in this place.
4.3. Simulation of case 2
We study now the performance of our network with DG fix in busbar 20 and we will move the position of NOP.
The results are given in Fig.7
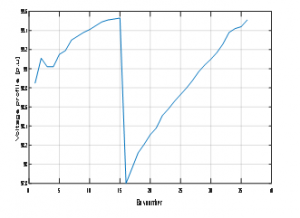
Figure 7: Voltage profile after removing the position of NOP
As presented in Fig. 7 the voltage profile of our distribution network changes proportionally after removing NOP in the different positions, however, we show that the voltage profile is great when the position of the NOP is between bus 16-17 and 36-37.
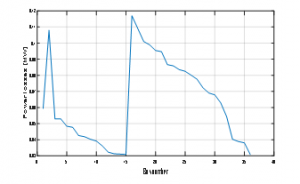
Figure 8: Power losses after removing the position of NOP
For Fig. 8 we can observe that removing NOP between buses influence also the power losses, but we can remarque that the power losses are minimum when the NOP position is is between bus 16-17 and 36-37.
4.4. Discussion of case 2
We can remarque in Fig.7 that the removing NOP greatly reduces the power losses of 0.03 MW, this reduction of power losses are important when it’s between bus 16-17 and 36-37, so the best for NOP is between this busbar.
We can also remarque in fig. 8 that the voltage profile is maximum when NOP is between the same buses.
We can explain that by balancing the loads between the feeders of our system.
4.5. Synthesis
To compare the two cases, we will draw the power losses of the two cases in the same graph.
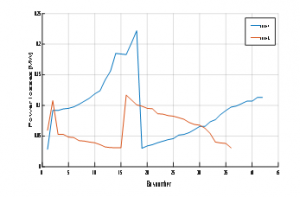
Figure 9: Power losses in case 1 & 2
As presented in Fig.9 the power losses are lower in case 2 compared to case 1.
We can recapitulate that by integrating NOP to balance the loads between feeder we can minimize power losses in the distribution network more than integrating DG in a different position.
5. Conclusion & Perspective
This paper has proposed two approaches to reduce power losses in the distribution network, so we considered two constraints, reduce power losses and improving the voltage profile. To evaluate the effectiveness of this approach we worked on two cases:
Case 1 we fixed the position of the NOP and we remove the DG to have the minimum of power losses.
Case 2 we fixed the DG in the optimal position from the first case and we change the position of NOP. The principal objective was to decrease the power losses in the distribution network. To study the influence on grid losses we considered a Medium Voltage distribution network which is the MV network of the Kenitra city in Morroco it consists of a source substation with an installed power of 36MVA and a short-circuit power of 397.15 MVA was implemented using Etap and Matlab/Simulink. The results presented illustrate that we can decrease power losses in distribution systems by displacing the position of NOP more than integrating DGs in our system.
For Future work, it will be interesting to integrate metaheuristics algorithms like Butterfly optimization algorithm BOA [21] and particle swarm optimization algorithm PSO [22] to reduce power losses and choosing the best place for DGs and NOP.
Conflict of Interest
The authors declare no conflict of interest.
- L. Thurner, A. Scheidler, A. Probst, M. Braun, “Analysing the Degree of Meshing in Medium Voltage Target Grids-An Automated Technical and Economical Impact Assessment,” ArXiv Preprint ArXiv:1802.01492, 2018, doi:arXiv:1802.01492.
- T. Schnelle, M. Schmidt, P. Schegner, “Power converters in distribution grids-new alternatives for grid planning and operation,” IEEE: 1–6, 2015, doi:arXiv:1802.01492.
- N. Acharya, P. Mahat, N. Mithulananthan, “An analytical approach for DG allocation in primary distribution network,” International Journal of Electrical Power & Energy Systems, 28(10), 669–678, 2006, doi:10.1016/j.ijepes.2006.02.013.
- A. Singh, S. Parida, “Combined optimal placement of solar; wind and fuel cell based DGs using AHP,” Linköping University Electronic Press: 3113–3120, 2011, doi:10.3384/ecp110573113.
- M. Kashem, G. Ledwich, “Multiple distributed generators for distribution feeder voltage support,” IEEE Transactions on Energy Conversion, 20(3), 676–684, 2005, doi: 10.1109/TEC.2004.832090.
- S.-H. Lee, J.-W. Park, “Selection of optimal location and size of multiple distributed generations by using Kalman filter algorithm,” IEEE Transactions on Power Systems, 24(3), 1393–1400, 2009 doi: 10.1109/TPWRS.2009.2016540.
- N. Soukaina, E. Hassane, L. Tijani, “Hosting capacity estimation of underground distribution feeder in Urbain Areas,” IEEE: 1–5, 2019, doi:10.1109/WITS.2019.8723822.
- M. Gomez-Gonzalez, A. López, F. Jurado, “Optimization of distributed generation systems using a new discrete PSO and OPF,” Electric Power Systems Research, 84(1), 174–180, 2012doi:org/10.1016/j.epsr.2011.11.016.
- D.K. Khatod, V. Pant, J. Sharma, “Evolutionary programming based optimal placement of renewable distributed generators,” IEEE Transactions on Power Systems, 28(2), 683–695, 2012 doi: 10.1109/TPWRS.2012.2211044.
- D. Singh, D. Singh, K. Verma, “Multiobjective optimization for DG planning with load models,” IEEE Transactions on Power Systems, 24(1), 427–436, 2009, doi: 10.1109/TPWRS.2008.2009483.
- M. Sedighi, A. Igderi, A. Parastar, “Sitting and sizing of distributed generation in distribution network to improve of several parameters by PSO algorithm,” IEEE: 1083–1087, 2010, doi: 10.1109/IPECON.2010.5696977.
- M. Ettehadi, H. Ghasemi, S. Vaez-Zadeh, “Voltage stability-based DG placement in distribution networks,” Ieee Transactions on Power Delivery, 28(1), 171–178, 2012,doi:10.1109/TPWRD.2012.2214241.
- F. Ugranlı, E. Karatepe, “Multiple-distributed generation planning under load uncertainty and different penetration levels,” International Journal of Electrical Power & Energy Systems, 46, 132–144, 2013, doi:org/10.1016/j.ijepes.2012.10.043.
- M. Aman, G. Jasmon, H. Mokhlis, A. Bakar, “Optimal placement and sizing of a DG based on a new power stability index and line losses,” International Journal of Electrical Power & Energy Systems, 43(1), 1296–1304, 2012, doi:org/10.1016/j.ijepes.2012.05.053.
- S.K. Injeti, N.P. Kumar, “A novel approach to identify optimal access point and capacity of multiple DGs in a small, medium and large scale radial distribution systems,” International Journal of Electrical Power & Energy Systems, 45(1), 142–151, 2013, doi:org/10.1016/j.ijepes.2012.08.043.
- S. Ghosh, S.P. Ghoshal, S. Ghosh, “Optimal sizing and placement of distributed generation in a network system,” International Journal of Electrical Power & Energy Systems, 32(8), 849–856, 2010, doi:org/10.1016/j.ijepes.2010.01.029.
- M. Dehghani, Z. Montazeri, O. Malik, “Optimal sizing and placement of capacitor banks and distributed generation in distribution systems using spring search algorithm,” International Journal of Emerging Electric Power Systems, 21(1), 2020, doi:https://doi.org/10.1515/ijeeps-2019-0217.
- M. Ismail, E. Hassane, E.M. Hassan, L. Tijani, “Power Losses Minimization in Distribution System Using Soft Open Point,” IEEE: 1–5, 2020, doi: 10.1109/IRASET48871.2020.9092002.
- S. Ganguly, N. Sahoo, D. Das, “Multi-objective particle swarm optimization based on fuzzy-Pareto-dominance for possibilistic planning of electrical distribution systems incorporating distributed generation,” Fuzzy Sets and Systems, 213, 47–73, 2013, doi:org/10.1016/j.fss.2012.07.005.
- M. Aman, G. Jasmon, A. Bakar, H. Mokhlis, “A new approach for optimum DG placement and sizing based on voltage stability maximization and minimization of power losses,” Energy Conversion and Management, 70, 202–210, 2013, doi:org/10.1016/j.enconman.2013.02.015.
- S. Arora, S. Singh, “Butterfly optimization algorithm: a novel approach for global optimization,” Soft Computing, 23(3), 715–734, 2019, doi:10.1007/s00500-018-3102-4.
- R. Pegado, Z. Ñaupari, Y. Molina, C. Castillo, “Radial distribution network reconfiguration for power losses reduction based on improved selective BPSO,” Electric Power Systems Research, 169, 206–213, 2019, doi:org/10.1016/j.epsr.2018.12.030.