The Effect of User Experience from Teksologi
Volume 5, Issue 5, Page No 847-851, 2020
Author’s Name: Yanfi Yanfia), Yogi Udjaja, Adrian Victor Juandi
View Affiliations
Computer Science Department, School of Computer Science, Bina Nusantara University, Jakarta, Indonesia 11480
a)Author to whom correspondence should be addressed. E-mail: eufrasia.yan.fi@binus.ac.id
Adv. Sci. Technol. Eng. Syst. J. 5(5), 847-851 (2020); ![]() DOI: 10.25046/aj0505103
DOI: 10.25046/aj0505103
Keywords: Teksologi, User Experience, Gamification, Visually Impaired Children

Export Citations
A meaningful User Experience can indicate successful of the application, so it is important to provide positive experience which aims to maximize the usability of an application. The purpose of this current study is to evaluate the user experience of an application called Teksologi: Gamification interactive typing for visually impaired children in Indonesia. User Experience Questionnaire (UEQ) were applied to measure several aspects include attractiveness, dependability, efficiency, perspicuity, novelty, and stimulation. A total of 22 visually impaired participants had been involved for this study. Besides, Alpha Cronbach test and directly check the means of each items inside the scales to draw the conclusions were conducted to examine the consistency of each aspect, then comparison to UEQ benchmark also applied. The result show that all the quality aspect is positive. At the same time, stimulation had the highest value, but perspicuity had the smallest value that enhancement will be needed to make user feel easy to get familiar with the application, easy to learn to use the application.
Received: 07 June 2020, Accepted: 19 September 2020, Published Online: 12 October 2020
1. Introduction
Computers nowadays have become a common thing to master. Almost all groups even elementary school children have started to be able to operate computers. Computer lessons are also commonly taught in schools. Unfortunately, some amazingly special schools for the blind (SLB A) have not provided computer lessons in the learning curriculum, especially at the elementary and junior high levels.
The previous work was to create a gamification application for primary school visually impaired in Indonesia by utilizing the Game Development Life Cycle (GDLC). The application included lessons from first to second grade with the competition-based curriculum of 2013. The application has been tested on 11 normal respondents and 5 visually impaired respondents.
This paper extends the gamification interactive typing for Primary School Visually Impaired in Indonesia which fulfills several suggestions [1] with several studies on the context of the effectiveness of learning games for children with visually impaired.
One of the aspects to evaluate the succession of an application is user experience (UX). User inconvenience in using an application or product or service, can indicate failure of an application or product or service, because user satisfaction is one of the key determinants of continuance intention to use application [2].
As mentioned by Farhat, et al. [3] in a paper titled “Usability Evaluation of E-learning Systems in Al-Madinah International University” that there are two types in usability evaluation methods which are inspection methods and testing methods, though the inspection methods based on experts, the testing methods involve end-users and mostly done by filling questionnaires.
There are several UX measurement methods. Some of them are Questionnaire for User Interaction Satisfaction (QUIS), System Usability Scale (SUS), Standardized User Experience Percentile Rank Questionnaire (SUPR-Q), Software Usability Measurement Inventory (SUMI).
Questionnaire for User Interaction Satisfaction (QUIS) [4] is developed to assess user’s subjective satisfaction with four aspects such as screen factors, terminology and system feedback, learning factors, and system capabilities. Meanwhile, the System Usability Scale (SUS) is a tool for measuring the usability of a product [5].
Standardized User Experience Percentile Rank Questionnaire (SUPR-Q) that includes four aspects: usability, trust, appearance, and loyalty, is used to measure the quality of the website user experience [6].
Software Usability Measurement Inventory (SUMI) are designed to discover specific usability problems of measuring user’ perception of the usability software by either do a product-against-product comparison or compare each product against the standardization database [7].
User Experience Questionnaire (UEQ) was developed by Schrepp. M, et al. [8]. This UEQ model consists of 26 items questionnaire including six aspects: attractiveness, dependability, efficiency, perspicuity, novelty, and stimulation.
Compared to others, UEQ is a measurement that is considered to provide more benefits because it can provide comprehensive measurement results on user experience [9]. UEQ has used to evaluate the user experience of student-centered e-learning management system [10], to evaluate teachers and students’ user experience of learning tools for special needs education [11], and to examine user experience for blind and visually impaired in a field setting [12].
This study focuses on renewing the application and evaluate user experience using the User Experience Questionnaire (UEQ). However, in paper [11] it is stated that the UEQ measuring tool which initially evaluates the experience of interactive product users can be applied to assess non-interactive tools used in special needs education, so in this study, the UEQ measuring tool is applied in our interactive application used for children with special needs like visually impaired.
2. Design of Technology
2.1. Current Condition
At present, only a few schools for special needs provide computer lessons, while schools that have provided computer lessons apply 10-finger typing as one of the learning topics for students. Applications that have been made have been able to support students who can type with 10 fingers. Therefore, this study studies the behavior of students who are able and have not been able to type 10 fingers so that it is expected that application improvements can be done to support all students and non-blind students in understanding basic knowledge even though they do not have education in school. The field chosen to conduct this research is a blind school or course located in Jakarta.
2.2. Teksologi
Teksologi is a computer program that helps visually impaired children to learn to type and learn basic knowledge based on a curriculum that has been created using the concept of gamification [1]. Gamification serves to increase the motivation of users so that the application continues used repetitively, so the results obtained are in line with expectations [13][14].
2.3. Interaction
The model of interaction used is to use visuals and sounds, and the controller uses a normal keyboard. The most difficult thing in making this application is to determine the user’s user experience, where this requires repeating testing to make improvements so that users feel comfortable when using this application.
2.4. Type of User
There are 2 types of users of Teksologi, namely: those who fully cannot see and are partial. For users who cannot see, they only interact with the sound and the normal keyboard, while those who are partial can interact with the visual, sound, and normal keyboard. What should be noted from partial users is the level of lighting in the application. Moreover, this lighting level must be dark, because if there is a bright color it can dazzle partial users.
2.5. User Experience Questionnaire
User Experience Questionnaire (UEQ) is a tool for evaluating interactive products. In its section, there are several standards needed, i.e. attractiveness, dependability, efficiency, perspicuity, novelty, and stimulation [15]. These things are standards to measure the comfort of users of the application made.
3. Research Method
Previous research explained [1], some improvement and evaluation related user experience were conducted with the hope that this application will be used according to user needs. The improvements produced are as follows:
- On the home page, here are tutorials and more selection keys like the “space” button, “S”, “H”, and “Esc” with each function. Besides, the level of this application has reached the sixth level of elementary school.
- The application also completed with a backspace tone which alerts if the user has deleted the letter.
- The application provides information about the score, total time, correct inputted number.
To validate the conceptual model of this application, the User Experience Questionnaire (UEQ) is used as the evaluation method to measure several aspects include attractiveness, dependability, efficiency, perspicuity, novelty, and stimulation.
The method to gather the data by applying the interview method to answer the questionnaires, so researchers read and the respondents give the answer for each item in the questionnaire. This data is collected for one week in July 2019 in the school. Nevertheless, students from elementary to senior high school were noticed.
There are 26 questions consists of pairs that meaningfully contradict each other using a Likert scale from 1 (strongly disagree) to 7 (strongly agree) was adopted from the User Experience Questionnaire (UEQ). The distribution aspects of the User Experience Questionnaire are shown in Table 1.
Table 1: User Experience Questionnaires
| Aspect | Item |
| Attractiveness | This application Teksologi is enjoyable |
| This application Teksologi is good | |
| This application Teksologi is pleasing | |
| This application Teksologi is pleasant | |
| This application Teksologi is attractive | |
| This application Teksologi is friendly | |
| Dependability | This application Teksologi is predictable |
| This application Teksologi is support user in performing the tasks. | |
| This application Teksologi is secure | |
| This application Teksologi meets expectations | |
| Efficiency | This application Teksologi is fast |
| This application Teksologi is efficient | |
| This application Teksologi is practical | |
| The user interface of this application Teksologi looks organized | |
| Perspicuity | This application Teksologi is easy to understand |
| This application Teksologi is easy to learn | |
| This application Teksologi is simple | |
| This application Teksologi is clear | |
| Novelty | This application Teksologi is creatively design |
| This application Teksologi is inventive | |
| This application Teksologi is leading edge | |
| This application Teksologi is innovative | |
| Stimulation | This application Teksologi is valuable |
| This application Teksologi is exciting | |
| This application Teksologi is interesting | |
| This application Teksologi is motivating |
Attractiveness represents users’ impression of the product while dependability relates to predictable, secure, and meet the expectations. Moreover, efficiency describes users’ ability with minimum effort in solving their tasks in the application. Perspicuity relates to how users get familiar with the application includes simple, clear, easy to learn, and easy to understand. In addition, novelty represents innovation and creation of an application while stimulation shows how motivated and excited an application [16].
Several studies [17,18] using Cronbach’s Alpha analysis to examine the consistency scale, reliability of the responses. Moreover, in this study with this sample size, Cronbach’s Alpha analysis and directly check the means of each item inside the scales to draw the conclusions were also being conducted.
4. Result and Analysis
To evaluate the user experience, the User Experience Questionnaire (UEQ) could have been distributed. The answers from the participants are scaled from -3 to +3. The most negative answer is represented by -3, 0 for neutral, and +3 for the most positive answer.
There are 22 participants for this study. All participants were visually impaired. Table 1 showed that 13 out of 22 (59%) respondents are male and 41% respondents are female with 32% respondents are 10-13 years old, 32% respondents are 14-16 years old, 27% respondents are 17-18 years old, and 9% respondents are more than 20 years old. There are also educational stages as 36% of respondents are Senior High School, 32% of respondents are Junior High School, and 32% of respondents are elementary school.
Table 2: Participants’ demographic distribution
| Educational Stage: | |
| Senior High School | 36% |
| Junior High School | 32% |
| Elementary School | 32% |
| Gender: | |
| Male | 59% |
| Female | 41% |
| Age: | |
| 10-13 | 32% |
| 14-16 | 32% |
| 17-18 | 27% |
| >20 | 9% |
Figure 1 showed the results of UX measurement in six aspects. Six aspects include attractiveness, dependability, efficiency, perspicuity, novelty, and stimulation. Schrepp, et al. stated that a scale above 0 represent a positive evaluation of this quality aspect while a value below 0 represents a negative evaluation [15]. As a result of all the aspect is higher than 0, so it confirmed that all the quality aspect is positive. At the same time, stimulation had the highest value while perspicuity had the smallest value that enhancement will be needed.
As mentioned in the paper titled “The Evaluation of Academic Website using Eye Tracker and UEQ: a Case Study in Website of XYZ” [19], mean values between -0.8 and 0.8 represent a more or less neutral evaluation of the corresponding scale, while the mean values more than 0.8 represent a positive evaluation. Based on that statement, this evaluation of application Teksologi confirmed positive.
Furthermore, the Cronbach Alpha coefficient [20] was calculated to verify the reliability. The results value of 0.889 is shown in Table 3. As the general rule of thumb is that a Cronbach’s alpha of 0.70 and above is good, so all value confirmed reliable and valid.
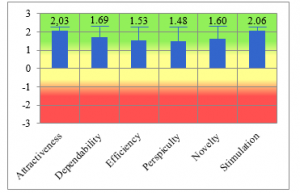
Figure 1: UX measurement scale
Table 3: Reliability Test Results
| Cronbach’s Alpha | Cronbach’s Alpha Based on Standardized Items | N of Items |
| 0.880 | 0.889 | 26 |
To make sure there is nothing potential critical related to the scale consistency, so we examined the means of the single items inside the scales. Figure 2 described that all items are interpreted in the usual way with a highly positive mean, so it confirmed there are no problems with any items in this context.
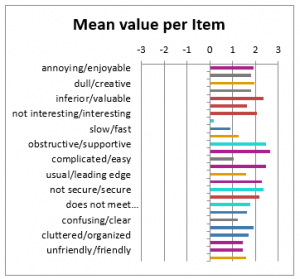
Figure 2: Mean Value per Item
The comparison to benchmark was also conducted (see Figure 3) to decide if this application has sufficient user experience to be successful in the market. However, the common expectation grew over time towards the user experience [16] and a new product established should reach at least the good category in all scales.
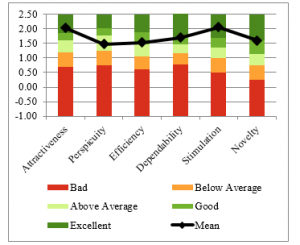
Figure 3: Graph of comparison to benchmark UEQ
As shown in Table 4, Perspicuity is below the good category expectation, so some improvement in this area is needed to be related to make users feel easy to get familiar with the application, easy to learn to use the application.
Table 4: Interpretation results of comparison to Benchmark UEQ
| Aspects | Mean | Comparison to Benchmark | Interpretation |
| Attractiveness | 2,03 | Excellent | In the range of the 10% best results |
| Perspicuity | 1,48 | Above Average | 25% of results better, 50% of results worse |
| Efficiency | 1,53 | Good | 10% of results better, 75% of results worse |
| Dependability | 1,69 | Good | In the range of the 10% best results |
| Stimulation | 2,06 | Excellent | In the range of the 10% best results |
| Novelty | 1,60 | Good | 10% of results better, 75% of results worse |
5. Conclusion
The study is aimed to examine the user experience of the application called Teksologi: Gamification interactive typing for visually impaired children in Indonesia. The evaluation is conducted with adopted User Experience Questionnaire (UEQ) that assess aspects like efficiency, perspicuity, dependability, attractiveness, stimulation, and novelty.
The evaluation in this current study is conducted to 22 visually impaired participants while the previous study [1], the application is tested by 16 participants (11 normal participants and 5 visually impaired participants).
The study results represented that all the value is confirmed consistently based on the Cronbach alpha test result. In addition, mean value for all aspect more than 0.8 includes attractiveness (2,03), perspicuity (1,48), efficiency (1,53), dependability (1,69), stimulation (2,06), and novelty (1,60) means positive evaluation.
Compare to the benchmark, attractiveness, and stimulation reach the excellent category, while efficiency, dependability, and novelty in the good category. However, perspicuity is in the above-average category, so some improvements are needed to have sufficient user experience to be successful in the market.
It is recommended that future work apply some aspects’ comparison towards the user experience of this application.
Acknowledgement
We truly appreciate all participants’ contributions and help especially Sekolah Luar Biasa Tuna Netra (SLB-A) Pembina Tingkat Nasional.
- Y. Yanfi, Udjaja, A.C. Sari, “A Gamification Interactive Typing for Primary School Visually Impaired Children in Indonesia,” in Procedia Computer Science, 2017, doi:10.1016/j.procs.2017.10.032.
- W.T. Wang, W.M. Ou, W.Y. Chen, “The impact of inertia and user satisfaction on the continuance intentions to use mobile communication applications: A mobile service quality perspective,” International Journal of Information Management, 2019, doi:10.1016/j.ijinfomgt.2018.10.011.
- A. Farhat, W.M.S. Yafooz, “Usability Evaluation of E-learning Systems in Al- Madinah International University,” 1(1), 2017.
- B.D. Harper, K.L. Norman, “Improving user satisfaction: The questionnaire for user interaction satisfaction version 5.5,” Proceedings of Mid Atlantic Human Factors Conference, 1998.
- A. Kaya, R. Ozturk, C. Altin Gumussoy, Usability Measurement of Mobile Applications with System Usability Scale (SUS), 2019, doi:10.1007/978-3-030-03317-0_32.
- J. Sauro, “SUPR-Q: A Comprehensive Measure of the Quality of the Website User Experience,” Journal of Usability Studies, 10(2), 68–86, 2015.
- J. Kirakowski, M. Corbett, “SUMI: the Software Usability Measurement Inventory,” British Journal of Educational Technology, 1993, doi:10.1111/j.1467-8535.1993.tb00076.x.
- B. Laugwitz, T. Held, M. Schrepp, Construction and Evaluation of a User Experience Questionnaire, 2008, doi:10.1007/978-3-540-89350-9_6.
- S. Putro, K. Kusrini, M.P. Kurniawan, “Penerapan Metode UEQ dan Cooperative Evaluation untuk Mengevaluasi User Experience Lapor Bantul,” Creative Information Technology Journal, 6(1), 27, 2020, doi:10.24076/citec.2019v6i1.242.
- H.B. Santoso, M. Schrepp, R. Yugo Kartono Isal, A.Y. Utomo, B. Priyogi, “Measuring user experience of the student-centered E-learning environment,” Journal of Educators Online, 13(1), 1–79, 2016.
- J. Kadastik, T. Artla, M. Schrepp, “Your Experience is Important! The User Experience Questionnaire (UEQ) – Estonian Version,” Rural Environment. Education. Personality. (REEP): Proceedings of the 11th International Scientific Conference, 11(May), 281–287, 2018, doi:10.22616/reep.2018.034.
- S. Pohjolainen, “Usability and User Experience Evaluation Model for Investigating Coordinated Assistive Technologies with Blind and Visually Impaired,” 2020.
- Y. Udjaja, V.S. Guizot, N. Chandra, “Gamification for elementary mathematics learning in Indonesia,” International Journal of Electrical and Computer Engineering, 2018, doi:10.11591/ijece.v8i5.pp3859-3865.
- Y. Udjaja, “Gamification Assisted Language Learning for Japanese Language Using Expert Point Cloud Recognizer,” International Journal of Computer Games Technology, 2018, doi:10.1155/2018/9085179.
- M. Schrepp, A. Hinderks, J. Thomaschewski, “Construction of a Benchmark for the User Experience Questionnaire (UEQ),” International Journal of Interactive Multimedia and Artificial Intelligence, 4(4), 40, 2017, doi:10.9781/ijimai.2017.445.
- M. Schrepp, A. Hinderks, J. Thomaschewski, “Applying the User Experience Questionnaire (UEQ) in Different Evaluation Scenarios BT – Design, User Experience, and Usability. Theories, Methods, and Tools for Designing the User Experience,” 383–392, 2014.
- Y. Yanfi, Y. Kurniawan, Y. Arifin, “Factors Affecting the Behavioral Intention of using Sedayuone Mobile Application,” ComTech: Computer, Mathematics and Engineering Applications, 8(3), 137, 2017, doi:10.21512/comtech.v8i3.3722.
- F.E. Gunawan, I. Sari, Y. Yanfi, “The consumer intention to use digital membership cards,” Journal of Business & Retail Management Research, 2019, doi:10.24052/jbrmr/v13is04/art-10.
- A.H. Kusumo, M. Hartono, “The evaluation of academic website using eye tracker and UEQ: A case study in a website of xyz,” IOP Conference Series: Materials Science and Engineering, 703(1), 2019, doi:10.1088/1757-899X/703/1/012049.
- L.J. Cronbach, “Coefficient alpha and the internal structure of tests,” Psychometrika, 1951, doi:10.1007/BF02310555.
Citations by Dimensions
Citations by PlumX
Google Scholar
Scholar
Crossref Citations
No. of Downloads Per Month
No. of Downloads Per Country