The Relation of Compression Strength with Modulus of Rupture and UPV of Concrete Containing M-sand as Fine Aggregate
 , Siti Aliyyah Masjuki 1, Siti Asmahani Saad 1, Maisarah Ali 1, Shuhairy Norhisham 2
Adv. Sci. Technol. Eng. Syst. J. 5(5), 39–46 (2020);
 DOI: 10.25046/aj050506
The impact of Manufacture sand on UPV, compression strength and modulus of rupture has been experimentally investigated and discussed in this paper. Concrete grade 30 (30Mpa) were produced with different percentage of M sand substitution ranging from 25%, 50%, 75% and 100% by volume were selected as concrete mix design in this project. The strength for different percentage of M-sand incorporation was measured by the destructive test which are compression strength test and modulus of rupture test and non-destructive test which is UPV test for curing ages of 90, 28 and 7 days. Furthermore, the highest compression strength of concrete and modulus of rupture was found on the 90th day containing a proportion of 75% of M-sand as a substitution for natural fine aggregate. A novel empirical equations 1 & 4 are proposed for the relation of compression strength with the modulus of rupture and UPV.
1. Introduction
The construction industry is currently facing a serious problem regarding the shortage of construction material due to the rapid depletion of the sources. The excessive mining activities of natural sand has tremendously dropped the production rate of fine aggregate for concrete production and led to severe depletion of the river beds. The scarcity of the natural sand is already at an alarming rate. Besides, the shortage has resulted in a non-tolerable increase in its price ultimately effecting the construction cost. Since natural sand is non-renewable aggregate resources, a countermeasure needs to be executed. In order to safeguard the enduring availability of construction raw material supplies, the industry needs to start shifting towards sustainable construction materials throughout the concept of recycling. Therefore, the use of recycled aggregates is seen to be the safest choice to replace the consumption of natural aggregate in concrete manufacture [1].
The natural sand that is usually used as fine aggregates in concrete is excavated from river beds. It contains a lot of organic materials such as sulphate, chlorides and silt which can affect the concrete strength and its durability. To protect our river due to high demand of natural sand, there is an alternative of natural sand as fine aggregates in concrete which is Manufactured Sand. M Sand is made from the powder of hard granite rocks. Basically, M Sand are finely graded, have greater durability and their particles are in cubical shape. By using M Sand as fine aggregates in a concrete mixture, the concrete is eco-friendly, have high workability and high durability which lead to the reduction of bleeding, voids and segregation in concrete. Thus, we can use M Sand as partial substitute of fine aggregates in concrete and at the same time protect our river resources from destruction [2].
The article [3] studies the effect of long term concrete compression strength incorporated with M-sand. Nine mix proportion of manufactured sand concrete is developed and tested by using different proportion of manufactured sand combined with 5, 9, and 13 percentage of stone powder. Based on the result obtained, the strength grew tremendously within 3-28 days and grew moderately after 28 days. It is due to the rapid hydration process in the early curing age. After 28 days, the progress rate of compression strength was the same along with different grades of concrete. The studies also showed that the compression strength of manufactured sand concrete obtained is almost similar to the conventional concrete.
The article [4] asserts the particle shape, powder content and gradation of manufactured sand tend to influence the performance of the concrete. The concrete was manufactured with different particle shape (MSA-Diorite, MSC-Altered diorite, MSB-Metasandstone, MSH-Limestone) and different amount of powder content (0%, 5%, 7.5%, 10% and 12.5%). The specimen is tested to study the difference in performance between reference sand and manufactured sand concrete. It was found that the compression strength of manufactured sand concrete without powder content is lower than the compression strength of concrete with reference sand. However, as the amount of stone powder increase, the compression strength of M-sand concrete also increases. The increment is slightly higher than the concrete with reference sand.
According to the different studies the effects on the compression strength of concrete by substituting the river sand by weight in the concrete with 0 to 100 per cent of manufactured sand. Overall, their results revealed that with the raise of M-sand as a substitution in place of river sand, the compression strength of concrete rises. It has been explained that tremendous bonding between fine and coarse aggregates is the main reason for the compression strength increment of concrete with M-sand [5,6],[7].
Concrete mix with replacement level of 0%, 25% and 100% manufacture sand and tested at the age of 28-days and the maximum modulus of rupture obtained is when the sand is 100% replaced by the M-sand. It was found that the modulus of rupture increase as the compression strength of the concrete increase [7].
The article [8] claimed that the optimal percentage of M sand replacement is only 50%. Based on the experiment, concrete is manufactured with different percentage of M sand (0%, 25%, 50% and 75%). The obtained results reveal that the modulus of rupture of concrete incorporate with M sand is more than the modulus of rupture of conventional concrete. However, the highest increment of modulus of rupture is obtained only up to 50% of replacement. When it goes beyond 50%, the strength is considerably reduced.
The article [9] studies the effect of five different percentage of fine aggregate replacement (0%, 20%, 40%, 60%, 80% and 100%) on the hard properties of the concrete. Type of manufactured sand used is Granite Quarry Dust (GQD). Based on the result obtained, it was found that the UPV of concrete with GQD for all level of replacement is relatively lower in comparison with the reference mix at the initial period of (1 day and 7 days). However, at the period of 28 days, the UPV for all level of replacement shows better performance than the reference mix. This significant increment is due to the slower rate of hydration reaction producing less compact microstructure. Besides, the concrete with GQD within 60%, 80% and 100% shows a better result than those with 0%, 20% and 40%. Thus, as the percentage of fine aggregate replacement with GQD increase, the UPV also increase. It is determined that the presence of GQD improves the performance of the concrete.
The article [7] studies the relation between modulus of rupture and compression strength for concrete with 100%, 25% and 0% fine aggregate replaced by M sand tested at 28 days. The empirical equations were obtained by using power regression analysis in the form of (y= axb, where a and b are constants, y is modulus of rupture and x is compression strength) for concrete with 100%, 25%, and 0% of fine aggregate replaced by M sand. The equations were evaluated with the equations suggested by IS, ACI, and BS codes of practice for determining the modulus of rupture with the help of the compression strength of concrete. It is found that the equations suggested by the IS, ACI, and BS codes of practice are not reliable to estimate the modulus of rupture of concrete made with manufactured sand.
The article [10] proposed the equation using exponential power regression analysis (Fc=1.526e0.761Vp, R2=0.8569) to predict the compression strength of roller-compacted concrete for different curing periods (3,7,28 and 90 days). The UPV and compression strength tests conducted on three types of concrete mixtures (type-1 100% natural sand), (type- 2 100% M sand) and (type-3 50% M sand and 50% natural sand) used in place of natural sand in roller compacted concrete. In each series 0 to 60% of fly ash used as a admixture. Based on the result, it is found that type 3 mixtures yield higher compression strength and UPV. it is also found that UPV increases with the increase in curing ages for all type of concrete mixtures. The UPV of type 2 mixtures is slightly lower compared to UPV of type 1 mixtures. It is due to the harsh mixes which demand more w/c ratio than reference concrete with natural sand as fine aggregate.
Based on studies from the past researchers, it can be presumed that the proper blend of river sand and M sand incorporation in concrete plays an important role in achieving desired concrete strength.
The purpose of this experiment to ascertain the strength of M- Sand incorporated concrete through destructive test analysis namely compression strength and modulus of rupture and non-destructive test analysis UPV. And also, to analyse the relation of compression strength with a modulus of rupture and UPV.
2. Materials Selection and Preparation
In this research, materials are selected in accordance to the specifications to meet the objectives of the project and comply with the appropriate standard. Furthermore, it is to be noted that the grade of all concrete samples designed is G30 (30MPa) according to the Department of Environment (DOE) method.
2.1. Cement
The Ordinary Portland Cement (OPC) 42.5N is used in this project for the production of the concrete samples is which conforms to the Malaysian Standard MS EN 197-1 CEM I.
2.2. Water
Water is an important component that helps to bind the aggregates together. The water must clean and free from harmful chemical, foreign materials and wastages. According to BS EN 1008:2002, the water used is potable water where the water is clean enough without the need to be tested and considered suitable for concrete use.
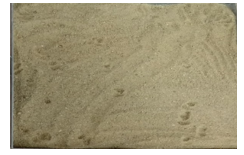
Figure 1: River Sand
2.3. Fine aggregates
Fine aggregates M sand and river sand were used is less than 5mm as specified in BS EN 933-1:2012. Fine aggregates are shown in figure 1 and 2. M Sand is collected from Kajang Rocks Quarry Sdn. Bhd.
2.4. Coarse aggregate
The type of course aggregate that is used to design the concrete mix in this study is crushed aggregate which mainly retained at 5mm sieve and with a maximum size of 20mm as specified in accordance to BS EN 933-1:2012 shown in figure 3.
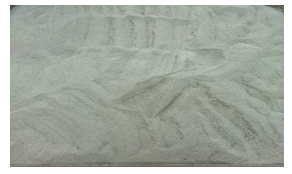
Figure 2: Manufactured Sand
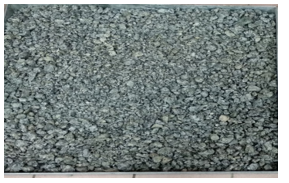
Figure 3: Gravels
2.5. Mix Design Proportion
Before conducting the concrete mixing, the calculation of the mix is done to obtain the exact weight of the concrete materials in accordance to Department of Environmental Method (DOE) as shown in table 1.
The mixes are designed with 0% replacement which is the conventional concrete production with 100% use of natural sand, increased gradually to 25%, 50%, 75% and 100% of M-sand substitute for fine aggregates in concrete production as tabulated in table 2.
2.6. Concrete mixing
In this research, a concrete mixer machine (figure 4) is used to attain the uniformity in a concrete mix. For the preparation of the concrete, the concrete mixers were cleaned before mixing the concrete. Coarse aggregates, fine aggregates, and cement were placed in the mixers for dry mix. Materials were mixed in a dry state for 3 mins. After dry materials mixed properly required volume of water added to the mixture and it is mixed for 2 mins. After unloading the mixture, it is mixed manually to obtained uniformity in the concrete mix.
The freshly mixed concrete poured into the moulds with the size of 150x150x150 (cubes) and 100mm x 100mm x 500mm (beams) size. The poker vibrator was used to eliminate all the air void in the specimens.
2.7. Curing Method
Curing is one of the important process during concrete hardening. The specimens are kept for 24 hours before the specimens undergo curing process. This curing method is according to BS 1881-113:2011. Type of curing used in this research is water curing method. The concrete samples were deposited in a water tank for 7, 28 and 90 days as demonstrated in figure 7.
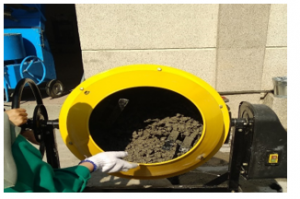
Figure 4: Concrete mixing by using concrete mixture machine
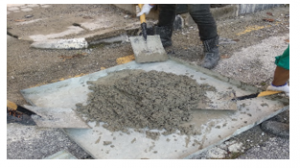
Figure 5: Concrete mixing by hand mix
Table 1: Concrete Mix Design
| Materials | Weight (kg/m3) |
| Water | 180 |
| Cement | 367 |
| Coarse aggregates | 1302 |
| Fine aggregates | 531 |
Table 2: Mix design fine aggregates percentage replacement with manufactured sand
| Materials | Conventional Concrete | Manufactured Sand Concrete | |||
| 1 | 2 | 3 | 4 | ||
| Manufactured Sand | 0% | 25% | 50% | 75% | 100% |
| River Sand | 100% | 75% | 50% | 25% | 0% |
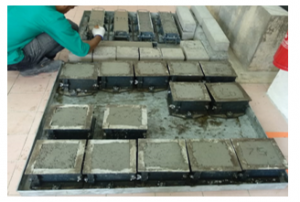
Figure 6: Concrete cubes and beams kept for 24 hours before curing
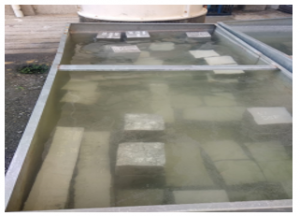
Figure 7: Water curing tank
3. Tests on Hardened Concrete
3.1. Compression strength Test
The test for the compression strength of the hardened concrete that was carried out on all the cube samples of size 150mm x 150mm x150mm in order to measure the development of the strength of each sample of the concrete. The test is conducted as per BS EN 12390-3. For each curing days mentioned, three concrete cubes were tested for all mixtures to obtain the average of compression strength. The readings are taken at 7,28, and 90 days by using a Digital Compression Testing Machine (figure 8). The result of the test shows the maximum load of the concrete can sustain before it fails and the concrete strength after curing days.
3.2. Modulus of rupture Test
This test is performed to investigate the capability of the unreinforced concrete beam to survive the failure in bending. The test is conducted as per BS EN 12390-5. For each curing days mentioned, three beams of size 100mm x 100mm x 500 mm were tested to obtain the average of Modulus of rupture. The readings are taken at 7,28, and 90 days by using a Digital modulus of rupture Testing Machine (figure 9).
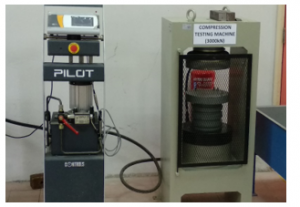
Figure 8: Compression test machine
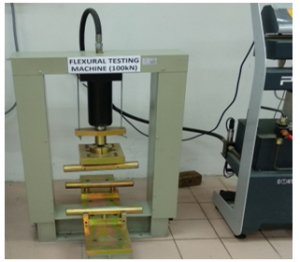
Figure 9: Flexural Testing Machine (Modulus of rupture Test)
3.3. UPV test
In order to investigate the structure and the quality of the concrete containing M-sand as fine aggregate, UPV test was performed on specimen size 150 x 150 x150 mm as per the BS EN 12504-4. 10 Hz pulse is applied to the cube specimen, the wave passed from one side to the other side are recorded as the time taken for the pulse to get through the structure and the result attained are recorded as shown in table 11.
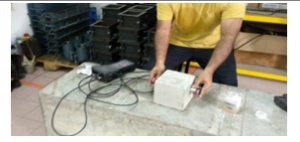
Figure 10: UPV test
Table 3: Quality of concrete as per the UPV test [9] [11].
| Velocity (Km/s) | ≥4.5 | 3.5-4.5 | 3.0-3.5 | 2.0-2.3 | ≤2 |
| Concrete quality | Excellent | Generally good | questionable | Generally poor | Very poor |
4. Results and Discussion
4.1. Compression strength Test
The test for the compression strength of all the samples has been conducted at 7, 28 and 90 days after curing in a water tank. The proportions of different types of fine aggregate and results obtained are tabulated in tables 4,5, and 6 Furthermore, the bar graph figure 12 represents the results of the compression strength obtained on the 90th, 28th, and 7th day for all the concrete mixes. From the tables (4, 5 & 6) and bar graph, it is observer that the highest compression strength obtained is for concrete containing 75% replacement of M sand as fine aggregates, where the compression strength are 51.35 MPa, 44.63MPa and 36.27 for 90,28, and 7 days respectively. And it is also, observes that up to 75% replacement of M-sand in place of river sand compression strength increases gradually with curing ages. It decreases drastically for 100% replacement of M-sand in place of river sand. The lowest concrete strength produce is for 100% replacement of fine aggregates with M-sand where the strength are 17.38 MPa, 33.03Mpa, and 23,68 Mpa for 90, 28 and 7 curing days. 100% replacement of M-sand sand in place of river sand is not applicable for the concrete production since it produces low concrete strength due to its physical properties. Excessive use of M-sand produces poorly graded of aggregates distribution in the concrete mix and increase the surface area of the particles. It leads to decrease in compression strength of concrete. This can be concluded that the optimum value for the natural sand replacement in concrete production is by using 75% of manufactured sand of natural sand. This result is proven for 7,28, and 90 curing days. It is due to the tremendous bonding between fine and coarse aggregates is the main reason for the compression strength increment of concrete with M-sand [7].
Table 4: Compressive test results for 7 days curing
| % of M-Sand | 7days | Average cube strength in MPa
|
||
| Cube strength in MPa | ||||
| specimen 1 | specimen 2 | specimen 3 | ||
| 0 | 31.23 | 29.39 | 29.56 | 30.06 |
| 25 | 32.92 | 31.42 | 29.33 | 31.22 |
| 50 | 23.56 | 33.42 | 38.5 | 31.83 |
| 75 | 38.08 | 35.77 | 34.97 | 36.27 |
| 100 | 30.39 | 15.8 | 24.85 | 23.68 |
Table 5: Compressive test results for 28 days curing
| % of M-Sand | 28 days | Average cube strength in MPa
|
||
| Cube strength in MPa | ||||
| specimen 1 | specimen 2 | specimen 3 | ||
| 0 | 32.74 | 32.86 | 35.53 | 33.71 |
| 25 | 40.49 | 40.22 | 40.99 | 40.57 |
| 50 | 42.24 | 41.09 | 42.2 | 41.84 |
| 75 | 43.14 | 46.71 | 44.03 | 44.63 |
| 100 | 32.48 | 37.99 | 28.62 | 33.03 |
Table 6: Compressive test results for 90 days curing
| % of M-Sand | 90 days | Average cube strength in MPa
|
||
| Cube strength in MPa | ||||
| specimen 1 | specimen 2 | specimen 3 | ||
| 0 | 36.07 | 34.44 | 35.31 | 35.27 |
| 25 | 44.49 | 42.79 | 42.91 | 43.40 |
| 50 | 46.87 | 45.39 | 47.87 | 46.71 |
| 75 | 49.80 | 52.33 | 51.92 | 51.35 |
| 100 | 17.63 | 17.53 | 16.97 | 17.38 |
4.2. Modulus of rupture Test
The test for the modulus of rupture of all the samples has been conducted at 7, 28 and 90 days after curing in a water tank. The proportions of different types of fine aggregate and results obtained are tabulated in tables 7,8 and 9. Furthermore, the bar graph figure 14 represents the results of the modulus of rupture obtained on the 90th, 28th, and 7th day day for all the concrete mixes.
From the bar graph and tables (7,8 & 9) it is observed that the higher modulus of rupture obtained is for concrete 75% replacement of M sand as fine aggregates where the modulus of rupture are 2.83 Mpa, 2.79 MPa and 2.31 Mpa for 90,28, and 7 days respectively. However, for 90 and 28 days of curing modulus of rupture of conventional concrete is higher i.e 2.76 MPa and 2.49 MPa as compared to concrete with 25% and 50% M sand as fine aggregate replacement. The concrete with 100% of manufactured sand as fine aggregate, enhance the modulus of rupture of the concrete with reference to conventional concrete after 90 days of curing. It can be presumed that up to 100% replacement of M sand in place of river sand enhance the modulus of rupture of concrete [7] .
Modulus of rupture is about 10 to 15 per cent of compression strength depending on the size, volume, and types of aggregate used in concrete. Modulus of rupture can be improved by adding mineral admixtures, fibers and superplasticizer using M sand as fine aggregate [8].
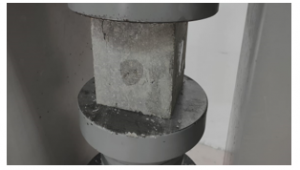
Figure 11: Compression strength test
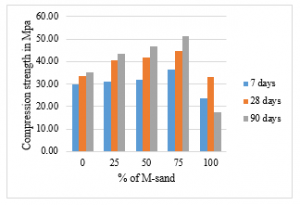
Figure 12: Variation of compression strength at 7,28 and 90 days
4.3. Correlation between modulus of rupture and compression strength
The empirical equation 1 is attained by using MS excel with help the experimental data of compression strength and modulus of rupture of concrete for 28 days of curing. A polynomial relation is attained with a correlation coefficient of 0.7431 between compressive and modulus of rupture.
yf = 0.0097xc 2 – 0.7183xc + 15.544
R² = 0.7431 (1)
. The predicted modulus of rupture of concrete is determined using equation 1,2 and 3 with the help of compression strength results obtained from the 28 days of curing. Yusuf, Jimoh, & Salami [12] reported that the equation 2 and 3 equation suggested by the Indian Standard code and Eurocode Code to determine the modulus of rupture of concrete for 28 days of curing.
yf = 0.7xc5 (2)
yf = 0.3 xc67 (3)
where yf is modulus of rupture in MPa and xc is compression strength in MPa
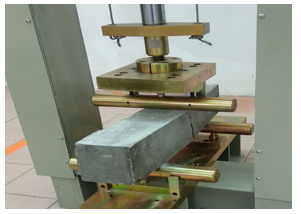
Figure 13: Modulus of rupture test
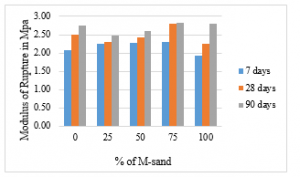
Figure 14: Variation of modulus of rupture at 7,28 and 90 days
From table 10 and figure 15 it is noticed that, the predicted values of modulus of rupture determined using equation 1 is very close to the experimental values of modulus of rupture. The predicated modulus of rupture determined using equation 2 & 3 is very high as compared to equation 1 values. It can be concluded that equation 2 and 3 suggested by IS and EC code is not suitable to evaluate the modulus of rupture of concrete made with M sand.
4.4. UPV test
The UPV test was performed on specimen size 150 x 150 x150 mm according to the BS EN 12504-4 as shown in figure 10. For curing days mentioned, three concrete cubes were tested for all the mixtures to obtain the average of UPV as shown in table 11. From table 11, it is found that UPV is ranging from 3.65 to 4.19 km/s. As per table 3, M-sand and conventional concrete come under good quality concrete.
Table 7: Modulus of rupture test results for 7 days curing
| % of M-Sand | 7days | Average Modulus of rupture in MPa
|
||
| Beam strength in MPa | ||||
| specimen 1 | specimen 2 | specimen
3 |
||
| 0 | 2.34 | 1.89 | 2.03 | 2.09 |
| 25 | 2.39 | 2.28 | 2.08 | 2.25 |
| 50 | 2.31 | 2.09 | 2.42 | 2.27 |
| 75 | 2.23 | 2.36 | 2.34 | 2.31 |
| 100 | 1.96 | 1.91 | 1.9 | 1.92 |
Table 8: Modulus of rupture test results for 28 days curing
| % of M-Sand | 28 days | Average Modulus of rupture in MPa
|
||
| Beam strength in MPa | ||||
| specimen 1 | specimen 2 | specimen 3 | ||
| 0 | 2.61 | 2.43 | 2.44 | 2.49 |
| 25 | 2.3 | 2.32 | 2.31 | 2.31 |
| 50 | 2.47 | 2.46 | 2.35 | 2.43 |
| 75 | 2.81 | 2.76 | 2.8 | 2.79 |
| 100 | 2.63 | 2.36 | 1.74 | 2.24 |
Table 9: Modulus of rupture test results for 90 days curing
| % of M-Sand | 90 days | Average Modulus of rupture in MPa
|
||
| Beam strength in MPa | ||||
| specimen
1 |
specimen
2 |
specimen
3 |
||
| 0 | 2.93 | 2.432 | 2.91 | 2.76 |
| 25 | 2.42 | 2.47 | 2.55 | 2.48 |
| 50 | 2.53 | 2.66 | 2.62 | 2.60 |
| 75 | 2.87 | 2.79 | 2.82 | 2.83 |
| 100 | 2.85 | 2.76 | 2.82 | 2.81 |
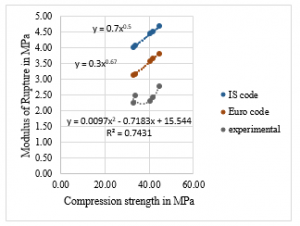
Figure 15: Correlation between modulus of rupture and compression strength for 28 days of curing
4.5. Correlation between compression strength and UPV
The correlation between the UPV and compression strength of the concrete shown in figure 16. It is observed that as the compression strength of concrete increases UPV values also increases as shown in figure 16. Equation 4 is obtained by using MS excel with the help of experimental data of compression strength and UPV of concrete for 28 days of curing. A polynomial relation is attained with a correlation coefficient of 0.8081between compressive and UPV.
- yc = 99.001xv2 – 686.44xv + 1219.8
R² = 0.8081 (4)
where yc is compression strength in MPa and xv is UPV in km/s.
Table 10: Evaluation of Modulus of rupture (Experimental and Theoretical)
| % M-sand 28 days | Experimental | Predicted Modulus of rupture Mpa | |||
| Compression strength
x Mpa |
Modulus of rupture
y Mpa |
eq 1 | eq 2 | eq 3 | |
| 0 | 33.71 | 2.49 | 2.35 | 4.06 | 3.17 |
| 25 | 40.57 | 2.31 | 2.37 | 4.46 | 3.59 |
| 50 | 41.84 | 2.43 | 2.47 | 4.53 | 3.66 |
| 75 | 44.63 | 2.79 | 2.81 | 4.68 | 3.82 |
| 100 | 33.03 | 2.24 | 2.40 | 4.02 | 3.12 |
Table 11: UPV test results
| % of M-Sand | UPV km/s | ||
| 7days | 28days | 90 days | |
| 0 | 3.65 | 3.73 | 3.76 |
| 25 | 3.75 | 3.74 | 3.88 |
| 50 | 3.99 | 3.82 | 4.16 |
| 75 | 4.1 | 3.85 | 4.19 |
| 100 | 3.65 | 3.64 | 3.78 |
5. Conclusion
The replacement of the M-sand in place of river sand in concrete production is a good approach to improve the strength of concrete. From this research, it is determined that the percentage replacement of 75% M Sand as fine aggregates contribute to the best mix design to obtain high durable concrete.
75% replacement of the M-sand in place of river sand exhibit the best compression strength, UPV, and modulus of rupture as compared to other percentages. It is due to the attribute of its physical properties which is rough in surface and angular in shaped exhibit internal friction to produce a good interlocking bond between the particles within the concrete. Even though M Sand can act as fine aggregates in concrete mixtures but fine aggregates cannot be fully replaced with M-sand. Fully replacement of M sand in place of river sand in concrete drastically reduce the compression strength of concrete. However, 100% incorporation of M sand improves the modulus of rupture in concrete.
A novel empirical equations 1 & 4 proposed. Which shows the relationship of compression strength with a modulus of rupture and compression strength with UPV for the concrete containing M-sand as fine aggregate.
According to research conducted and literature review, it is possible to replace the fine aggregate in concrete production by using M-sand. However, a different percentage of the natural sand replacement shows the increasing and decreasing of the concrete strength. Full replacement of the M Sand as fine aggregates in concrete mixing causing the lower performance of the concrete. This concludes that the river sand is still in need of concrete to maintain the eminence of the concrete. Thus, the substitution of M sand in concrete can only as partial substitute of fine aggregates. The natural sand cannot be fully replaced by other material such as M Sand.
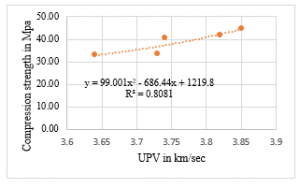
Figure 16: Correlation between UPV and compression strength of concrete for 28 days of curing
- S. Ismail, K.W. Hoe, M. Ramli, “Sustainable Aggregates: The potential and challenge for natural resources conservation,” Procedia – Social and Behavioral Sciences, 101, 100–109, 2013, doi:10.1016/j.sbspro.2013.07.183.
- K. V. Sabarish, P. Paul, M. Mohammed Aslam Khan, S. Gowtham, R. Hariharan, “Utilization of M-sand as a partial replacement for fine aggregate in concrete elements,” International Journal of Civil Engineering and Technology, 9(10), 422–426, 2018.
- X. Ding, C. Li, Y. Xu, F. Li, S. Zhao, “Experimental study on long-term compressive strength of concrete with manufactured sand,” Construction and Building Materials, 108, 67–73, 2016, doi:10.1016/j.conbuildmat.2016.01.028.
- W. Shen, Y. Liu, Z. Wang, L. Cao, D. Wu, Y. Wang, X. Ji, “Influence of manufactured sand’s characteristics on its concrete performance,” Construction and Building Materials, 172(May), 574–583, 2018, doi:10.1016/j.conbuildmat.2018.03.139.
- P.A. Jadhav, D.K. Kulkarni, “Effect of replacement of natural sand by manufactured sand on the properties of cement mortar,” International Journal of Civil and Structural Engineering Volume, 3(3), 621–628, 2013, doi:10.6088/ijcser.2.
- S.L. Chauhan, R.A. Bondre, “Partial replacement of sand by quarry dust in Concrete,” International Journal of Scientific and Research Publications, 5(7), 2250–3153, 2014, doi:10.13140/2.1.2742.0804.
- B.K. Meisuh, C.K. Kankam, T.K. Buabin, “Effect of quarry rock dust on the flexural strength of concrete,” Case Studies in Construction Materials, 8(July 2017), 16–22, 2018, doi:10.1016/j.cscm.2017.12.002.
- T.F. Kala, P. Asha, S. Elavenil, “Properties of concrete using manufactured sand as fine aggregate,” International Journal of ChemTech Research, 11(03), 94–100, 2018, doi:10.20902/ijctr.2018.110337.
- C.B. Cheah, J.S. Lim, M.B. Ramli, “The mechanical strength and durability properties of ternary blended cementitious composites containing granite quarry dust (GQD) as natural sand replacement,” Construction and Building Materials, 197, 291–306, 2019, doi:10.1016/j.conbuildmat.2018.11.194.
- S.K. Rao, P. Sravana, T.C. Rao, “Experimental studies in ultrasonic pulse velocity of roller compacted concrete pavement containing fly ash and M-sand,” International Journal of Pavement Research and Technology, 9(4), 289–301, 2016, doi:10.1016/j.ijprt.2016.08.003.
- S. Akçaözoǧlu, K. Akçaözoǧlu, C.D. Atiş, “Thermal conductivity, compressive strength and ultrasonic wave velocity of cementitious composite containing waste PET lightweight aggregate (WPLA),” Composites Part B: Engineering, 45(1), 721–726, 2013, doi:10.1016/j.compositesb.2012.09.012.
- I.T. Yusuf, Y.A. Jimoh, W.A. Salami, “An appropriate relationship between flexural strength and compressive strength of palm kernel shell concrete,” Alexandria Engineering Journal, 55(2), 1553–1562, 2016, doi:10.1016/j.aej.2016.04.008.
No related articles were found.