
Mentoring Model in an Active Learning Culture for Undergraduate Projects
Volume 5, Issue 4, Page No 805-815, 2020
Author’s Name: Wongpanya Nuankaew1, Kanakarn Phanniphong2, Sittichai Bussaman3, Direk Teeraputon4, Pratya Nuankaew5,a)
View Affiliations
1Faculty of Information Technology, Rajabhat Mahasarakham University, Maha Sarakham, 44000, Thailand
1Faculty of Business Administration and Information Technology, Rajamangala University of Technology Tawan-Ok, Chonburi, 20110, Thailand
3Faculty of Science and Technology, Rajabhat Mahasarakham University, Maha Sarakham, 44000, Thailand
4School of Education, University of Phayao, Phayao, 56000, Thailand
5School of Information and Communication Technology, University of Phayao, Phayao, 56000, Thailand
a)Author to whom correspondence should be addressed. E-mail: pratya.nu@up.ac.th
Adv. Sci. Technol. Eng. Syst. J. 5(4), 805-815 (2020); ![]() DOI: 10.25046/aj050495
DOI: 10.25046/aj050495
Keywords: Active Learning Culture, Educational Data Mining, Engineering Education, Learning Analytics, Lifelong Learning, Mentoring Model

Export Citations
Senior projects allow students to move the learning process from basic knowledge to an interdisciplinary approach. The purpose of this research is (1) to analysis attitude and perception, which is a collaboration between teachers and students to develop a model for clustering of appropriate advisors and advisee who cooperate in senior project, and (2) to develop factors that are significant to predict the right match in senior projects course. Data collection was a questionnaire consisting of 463 samples from 7 administrators, 68 lecturers, 26 staff and 362 students from two institutions: The Rajabhat Mahasarakham University, and the University of Phayao. The research methodology was designed and divided into three sections: preparation, implementation, and conclusion. The result shows that the satisfaction and the overall acceptance level were at a high level (mean = 4.04, S.D. = 0.88). Moreover, the developed model has the highest level of efficiency (accuracy = 98.06%). While the factors that are important for matching recommendations consists of 9 factors: policies of the organization, vision of the organization, mission of the organization, experience and achievements of researchers, qualifications of research team, interest in the research topics, impressions and examples in the past, technology and laboratory support, and budget support. For the future, the researchers are aimed to research on the development of students’ academic achievement and aims to promote a learning culture based on the results of this research.
Received: 17 June 2020, Accepted: 17 August 2020, Published Online: 28 August 2020
1. Introduction
The wireless displacement estimation system in this article is introduced in order to locate the position of user moving along a path indoor and carrying an wearable device only. Such pre-installed devices as fiducial markers on floor [1], infrared LED landmarks on panel [2], wireless communication devices like radio frequency and wireless local area network [3–5] are not required.
The applications of this system are diverse. High-demand areas of application can be listed including defense applications of tactical planning or strategic coordination for soldiers; social life applications for public safety and elderly care; and firefighter rescue applications when they’re stuck and in need of rescue. The common characteristic of the aforementioned applications is the indoor environment with no pre-installed infractructures or devices due to such infractructures as RFID, wireless network, infrared sensor, landmark for vision are unable to installed or have already been destroyed by disaster. Specifically, rescue and security applications often take place in unstable areas that are unsuitable for infrastructure-based systems.
In general, two types of non-infrastructure displacement estimation systems exist and named as the strap-down and the step-and-heading. The strapdown method is integrating the acceleration in order to get displacement. Accumulated errors in the integration process are compensated with reset algorithm in [6]. The step-and-heading method estimates displacement by combining the step size with the yaw (user heading) which is estimated by quaternion-based filters [7–8].
The infrastructure-free displacement estimation system utilizes sensors such as IMU, force sensor, pressure sensor (barometer), ultra-wide band (UWB), etc. Depending on the specific application needs, the sensors are selected and their positions on user’s body can be mentioned as holding in hand [9–10], mounting on foot [11–12], putting at ankle [13], placing at waist [14–16] and attaching at upper torso [17].
All mentioned approaches estimate displacement in two horizontal dimensions. However, Diaz [18] proposed an estimator with IMU put in pocket in order to estimate displacement in the vertical dimension. The inconvenient IMU location for user and the required training are the limitations of Diaz algorithm. Therefore, this article proposes a novel method that doesn’t require training but provide a displacement estimation algorithm for indoor three dimensions (3D), which is able to estimate both the horizontal displacement and vertical displacement. The proposed algorithm is based on the double integration of acceleration with reset at step events in order to eliminate accumulate error due to integrating process. The proposed method is tested when a person climbing/descending staircases.
In this article, the IMU is placed at pedestrian’s waist as shown in Figure 1 for convenient usage.
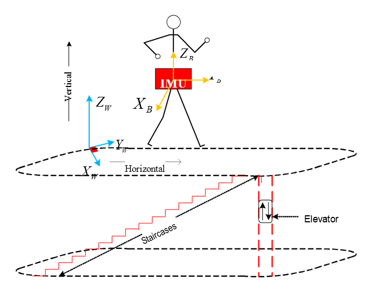 Figure 1: IMU is mounted at pedestrian’s waist and used to estimate 3D displacements.
The rest of the article is organized as follows. The proposed system and algorithm to estimate 3D displacements are introduced in section 2. In section 3, the experiment setting is described and the experimental results are shown. Section 4 concludes the article.
2. Proposed Wireless Displacement Estimation System
2.1. System Overview
The proposed wireless displacement system employed the integrating process with novel velocity update algorithm in [6] in order to convert measured acceleration into displacement. Moreover, the system ultilized IMU module MPU9250 for sensing, Xbee devices for wireless communication and Arduino Fio Board for programming the proposed algorithm. The system was implemented within space as in Figure 1 and various experimental scenarios were designed for testing and evaulating as well. People took part in experiments were tasked to wear mobile device at waist, perform multi-activities freely with normal speed. Experiment data was recorded wirelessly in distance of several hundred meters.
2.2. Attitude Estimation System
In order to make the theoretical basis for all math operations in this article, all coordinate systems (or frames) must be assigned and two frames are assigned as illustrated in Figure 1. The subscript notations of W and B indicate for World and Body, respectively. The East-North-Up (ENU) coordinate system is used as the world reference frame (XWYWZW) while the body coordinate system is assumed to rigidly attached to the IMU and the IMU is mounted at the pedestrian’s waist.
Let ψˆ, θˆ and φˆ be the user heading, IMU pitch and roll angles, respectively. An attitude in three dimensions is estimated based on a quaternion-based Kalman Filter in indirect form by fusing the information from the gyroscope, the accelerometer and the magnetometer.
The employed attitude estimation algorithm has two advantages as follows: 1) reducing computation cost due to dealing with orientation errors instead of dealing direct with orientation which results the state dimension being smaller and its response faster, and 2) two stages update using acceleration and magnetic strength by exploiting two measurements of the difference between accelerometer reading vs the gravity vector and the difference between magnetometer reading vs the magnetic strength vector.
2.3. Classification of Motion Modes
In order to improve displacement estimation accuracy, the motion modes of user carrying IMU must be recognized precisely [19]. Some motion modes including jogging, running, walking with different step sizes have already been done in our previous works [13, 17, 20]. In this article, motion modes of stationary, going up (climbing), going down (descending) staircases and riding a lift are added to update our previous work and enhance our system capabilities. Therefore, the motion modes are organized and indicated by numbers as follows: ’0’ indicates stationary mode; ’1’ indicates descending staircases mode; ’2’ indicates walking on flat surface mode; ’3’ indicates climbing staircases mode; ’4’ indicates riding a lift mode; ’5’ indicates jogging/running mode.
There are many motion modes introduced in [20] and were classified by machine learning based on four decision trees. The device are able to be put in many places including handheld with both portrait and landscape orientations; backpack; purse; belt holder; chest strapped; arm strapped hand still by side; dangling; pocket (consists of pant pocket, shirt pocket, and jacket pocket, in both horizontal and vertical orientations); wrist (ex: smartwatches) and headmount (such as smartglasses).
The algorithm in [20] is a very convenient but it is complicated and time consuming for learning method. Therefore, a simpler method for classification of motion modes is proposed in this article. The entire classification process, as shown Figure 2, consists of: 1) the acceleration in world frame is normalized and compared with a threshold in order to categorize motion modes into stationary, non-stationary and riding a lift modes, and 2) the non-stationary mode is classified into jogging/running, walking, climbing and descending staircases.
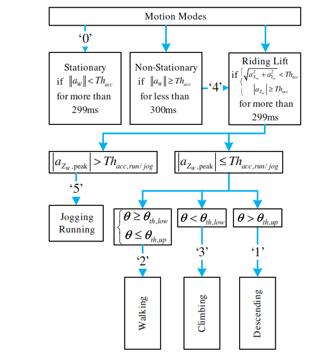 Figure 2: Motion Modes recognized by our work. The notation aW is the acceleration in world frame and the is its vertical component. All the Thacc, Thacc, run/jog, θth, low and θth, up are thresholds for motion modes classification.
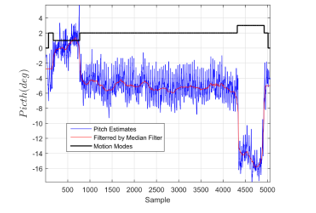 Figure 3: The blue solid line shows pitch angle estimates whereas the red one is the filtered pitch and the black solid line shows the Motion Modes, with values ’0’, ’1’, ’2’, ’3’ represents modes of stationary, descending staircases, walking and climbing up staircases, respectively.
2.3.1. Classification for Non-Stationary mode group:
The mode group of non-stationary consists of walking, jogging/running, climbing/descending staircases. Among them, the climbing/descending staircases motion modes are mentioned in this articles. Basically, classification of climbing/descending staircases is based on the pitch angle thresholds. Firstly, the original pitch estimates (depicted by the blue solid line in Figure 3) are passed through a Median Filter with a 100 samples window before doing a comparison with the pitch angle thresholds. The filtered pitch estimates are depicted by the red solid line in Figure 3. In order to illustrate the feasibility of the classification algorithm, an experiment that a pedestrian performs the following motion modes: stationary, walking, climbing up and descending down staircases with normal step sizes, moving at speed two steps per second, going along with a straight path is conducted and the pitch estimates are shown in Figure 3.
2.3.2. Classification for Riding Lift mode
In order to recognize whether a pedestrian riding a lift or not, the surface acceleration and the absolute of vertical acceleration are compared with a threshold. A pedestrian activity is classified into riding a lift mode if the condition shown in Figure 3 is satisfied. A person is tasked to perform a riding lift activity combined with walking then descending staircases in an experiment. Figure 4 proves the feasibility of classification riding a lift mode.
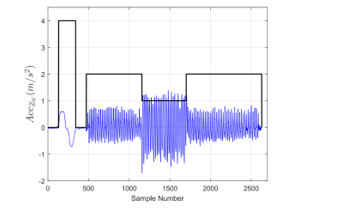 Figure 4: The blue solid line shows vertical acceleration with gravity removal whereas the black solid line shows the Motion Modes, with values ’0’, ’1’, ’2’, and ’4’ represents modes of stationary, descending staircases, walking and riding a lift, respectively.
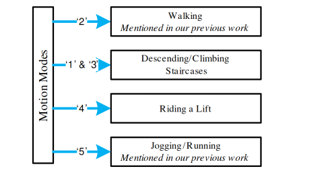 Figure 5: Overview of the proposed in-door localization system. Values ’1’, ’2’, ’3’, ’4’, ’5’ represents modes of descending staircases, walking and climbing up staircases, riding a lift and jogging/running, respectively.
2.4. Displacement Estimation Method
Authors’ previous works [13, 17] described the pedestrian’s walking motion and proposed two walking models applied to estimate displacement in two dimensions with the accuracy up to 97%. In order to enhance our displacement estimation system, an estimator applied for displacement estimation in (3D) including vertical and horizontal directions is developed. The details are described in this section.
2.4.1. System Overview
The displacement estimation system in this article consists of different algorithms accordingly to motion modes recognized by above described classification method. Figure 5 shows the block diagram of the proposed system for 3D displacement estimation.
2.4.2. 3D displacement estimation for descending/climbing staircases motion modes
During going up/down, the step events are defined at the extreme peak positions of the vertical acceleration, one component of the global acceleration with gravity removal. The method in [13] is used to detect the peaks.
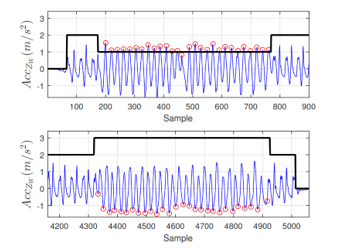 Figure 6: The black solid line shows the Motion Modes, with values ’0’, ’1’, ’2’, ’3’ represents modes of stationary, descending staircases, walking and climbing up staircases, respectively. The red rings are the extreme peak positions when descending (top) and climbing (bottom).
Figure 6. shows the peaks detected based on the data from the same experiment shown in Figure 3. The blue solid line is the vertical acceleration and the black solid line shows the Motion Modes. The step events are 100% detected.
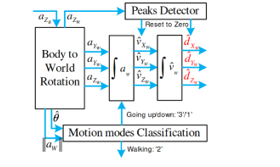 Figure 7: Block Diagram of the estimation algorithm for climbing/descending staircases.
Based on the fact that climbing/descending staircases are the periodic motions and the vertical acceleration is periodic data recored from the IMU mounted on the pedestrian’s body, the entire displacement estimation process is able to be considered as the accumulation of segments. Each segment starts from a step event and ended at the next adjacent step event. However, the accumulating error due to integration affects the estimation accuracy as described in [20]. Unlike putting the IMU at the ankle, placing the IMU at pedestrian’s waist has no chance of zero velocity interval when the normalized global acceleration is equal to zero. Therefore, the authors propose a method in order to obtain the 3D displacement is that integrating twice from global acceleration with gravity removal and that integrating process is reset to zero for velocity and displacement at the step events. The method is illustrated as in Figure 7. The reseting is called refreshing for segments.
2.4.3. 3D displacement estimation for riding a lift motion mode
The 3D displacement estimation when riding a lift is obtained by double integrating the vertical acceleration with gravity removal in world frame. The method was introduced in our previous work [19]. It is described that the integrated velocity is reset in zero vertical acceleration intervals during riding lift interval. Figure 8 illustrates the integrating process. Firstly, the discrete vertical acceleration with respect to the world frame is in the top plot and is with gravity removal when riding a lift one floor. Secondly, the middle plot is the integrated velocity and the bottom plot is the integrated vertical displacement. The red dot value ’non-zero’ in the top plot indicates the zero vertical acceleration intervals where integrated velocity is reset.
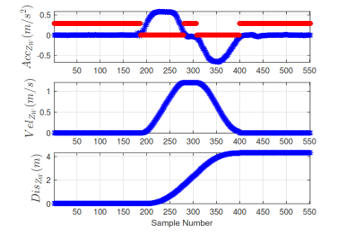 Figure 8: The vertical integration process when riding a lift through one floor.
3. Experiments and Evaluations
The capability of proposed method is tested through experiments conducted by four persons in our research group. In this section, a brief description of the experiment setup is first given, followed by a description of the experimental scenarios and the results obtained.
3.1. Set up
The hardware used to test the proposed method is illustrated in Figure 9, which consists of two parts: 1) the mobile part (attached to the pedestrian) shown in the top portion and 2) the base part shown in the bottom portion. The mobile part consists of an Xbee wireless transmitter, an MPU-9250 IMU sensor board and an Arduino Fio microcontroller Atmega328P board whereas the base part has an Xbee wireless receiver connected to the laptop by virtual serial port via USB port. The transmitter communicates with Fio board using I2C communication protocol. The serial baud rate is set at 115200bps.
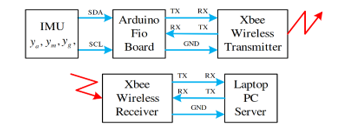 Figure 9: Hardware for experiments, with the mobile part (attached to pedestrian’s waist) shown in the top and the base part shown in the bottom.
The proposed algorithm is implemented in the mobile part with the data acquired in every 25 ms and passed through a complimentary filter with 225 ms time constant.
Four experimental scenarios are set and conducted, namely: 1) which is described in section 3.2 is the experiment of going staircases along a straight path with two action modes climbing and descending for 3D displacement accuracy evaluation; 2) which is described in section 3.3 is the experiment of walking along with a triangular path put together with climbing and descending staircases for combination of heading and displacement accuracy evaluation; 3) which is described in section 3.4 is the experiment of riding a lift through floors; and 4) which is described in section 3.5 is the experiment of 3D displacement estimation that consists of many motion modes.
Four people in our research group aging from 25 to 39 with height ranging from 1.6 meters to 1.86 meters are deployed for these experiments, and all the experiments are conducted. Each test is also repeated for four times.
3.2. Results for climbing/descending staircases
For the first experiments scenario, the straight path includes 2m flat path and 15 stairs as shown in Figure 10. Each stair is 15cm in height and 30cm in length. The straight path has 2.25m ground truth in height (vertical direction) and 7.03m ground truth in horizontal direction. It produces 14.06m traveling ground truth in three dimensions.
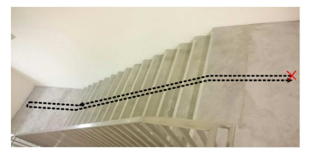 Figure 10: In this figure, the volunteers start from the red mark ‘X’ and performs motion modes of stationary, descending, climbing along a straight path depicted by the black bold dot line.
On stairs, both horizontal and vertical displacements are obtained by double integration with zero reset at step events. The heading is determined by method in [9]. Figure 11 shows the side view of an experimental result and illustrates the both vertical and horizontal estimates.
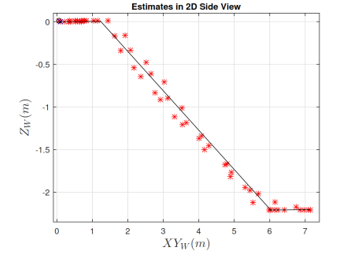 Figure 11: In this figure, both horizontal and vertical estimates are represented by the red asterisk ‘*’ when walking, descending/climbing staircases along with a straight path. (XYW) is the horizontal direction. The black solid line is the ground truth.
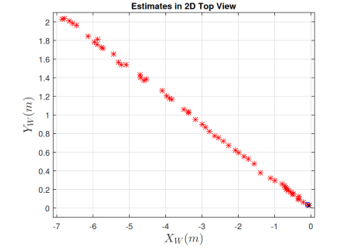 Figure 12: In this figure, the horizontal estimates are represented by the red asterisk ‘*’ when walking, descending/climbing staircases along with a straight path.
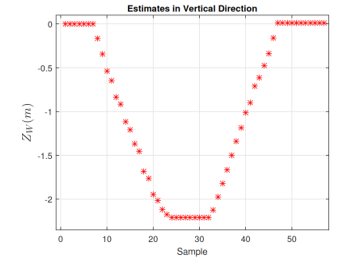 Figure 13: In this figure, the vertical estimates are represented by the red asterisk ‘*’ when walking, descending/climbing staircases along with a straight path.
The vertical estimates are positions of pedestrian in upward direction (ZW) and the horizontal estimates are computed by taking normalization of pedestrian positions in both north (YW) and east (XW) directions. Let (XYW) be the representation of horizontal direction.
Next, Figure 12 shows the view from top and illustrates the horizontal estimates only. Finally, Figure 13 illustrates the vertical estimates only.
In the three figures, the red asterisk ‘*’ represents the estimated positions, the blue ‘O’ represents the starting point and the black ‘X’ represents the ending point.
3.3. Results for walking and climbing/descending staircases
For the second experimental scenario, a traveling path includes two triangular paths (Figure 14(a)) in two different floors which are connected by 30 stairs of 15cm in height and 30cm in length (Figure 14(c)). The triangle has 3 edges in 11m length and its vertices are circled with 1/3 ring of 1m radius. The pillar in Figure 16(a) is one of triangle vertices. The walking path from a triangle to staircases is 9m for the top level (Figure 14(b)) and 11m for the bottom level (Figure 14(d)). The walking path at middle of staircases is 3m (Figure 14(c)). In order to obtain the highest accuracy in measurement as ground truth for evaluation, the staircase height is measured by Fluke 411D Laser Distance Meter and the number of staircases between two floors are counted. There are 30 staircases with 14.5cm height between two floors at Singapore University of Technology and Design, Building 1. This experimental set produces totally 114.62m traveling ground truth in three dimensions.
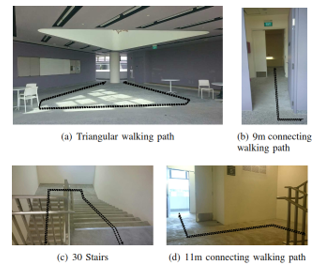 Figure 14: The second experimental scenario in the building.
When walking, the walking model and method in [18] is applied for displacement estimation while double intergrating process is employed for displacement estimation when climbing/descending staircases. For illustrating, an experimental result in 3D is shown in Figure 15.
3.4. Evaluation for the first two experimental scenarios
In order to evaluate the method performance, all the Euclidean distances in three dimensions between the starting point and the ending point are computed for both described experimental scenarios. In addition, all the differences between estimated height for each experiment and the staircase height ground truth are also computed for the first experimental scenario. The root means square errors of the Euclidean distances and the height differences are then calculated. The evaluation results are summarized in Table 1.
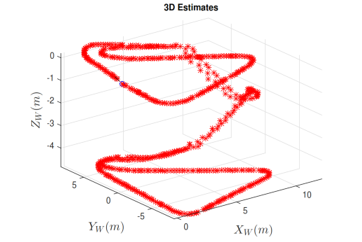 Figure 15: In this figure, the 3D estimates are shown when walking along a triangular path, climbing/descending 30 stairs.
Table 1: Performance of four people conducted experimental scenarios described in Section 3.3
| RMSE [m] | RMSE [%] | |
| 3D distance for descending, climbing along with Straight Path | 0.5 | 3.56 |
| Height Differences for descending, climbing along with Straight Path | 0.26 | 11.56 |
| 3D distance for travelling on the Triangular Shape Path | 1.64 | 1.43 |
3.5. Results and evaluations for riding a lift
In this experimental scenario, four members in our research group are tasked to ride a lift upward four times, then downward four times. Three experimental sets are designed such as riding a lift through one floor only as shown in Figure 8, riding lift through multiple floors with one floor stop as shown in Figure 16, riding lift through 40 floors as shown in Figure 17.
Figure 8 shows one of 16 experimental results in total for the first experimental set including 2 upward direction and 2 downward direction rode by 4 persons at Building 1. The experimental results are evaluated by the root mean square error based on the ground-truth of 4.35 meters, which is 0.0334 meters or 0.77%.
Figure 16 shows one of 8 experimental results in total for the second experimental set including 1 upward direction and 1 downward direction rode by 4 persons at Building 1. The experimental results are evaluated by the root mean square error based on the ground-truth of 4.35 meters, which is 0.0384 meters or 0.88%.
Figure 17 shows one of 4 experimental results in total for the third experimental set including 2 upward direction and 2 downward direction rode by 1 person at Block 90. There are 20 staircases with 13.5cm height between two floors of Block 90. The experimental results are evaluated by the root mean square error based on the ground-truth of 2.7 meters, which is 1.7909 meters or 1.66%.
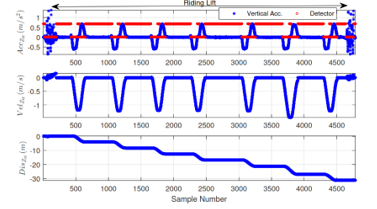 Figure 16: In this figure, the vertical estimates are shown when riding a lift through multiple floors.
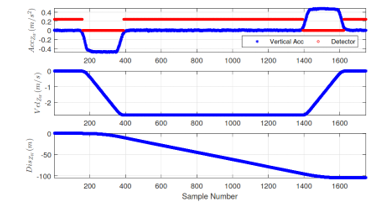 Figure 17: In this figure, the vertical estimates are shown when riding a lift through 40 floors.
3.6. Result and evaluation for 3D displacement estimation
A person is tasked to conduct experiments of walking from starting point, entering a lift, riding a lift upward one floor, followed by a walking out of a lift, descending staircases and walking again to starting point. The experimental result of this scenario is illustrated as in Figure 18.
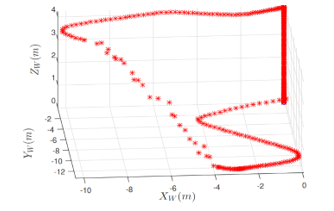 Figure 18: In this figure, the 3D estimates are shown when riding a lift through one floor then walking and descending straircases.
The experiment is repeated 4 times. The Euclidean distances between starting point and ending point are calculated for evaluation, which distance average of four experimental results is 0.71 meters.
4. Conclusion
A simple motion mode classification for climbing/descending staircases comes with an algorithm to estimate both vertical and horizontal displacements by utilizing information from global acceleration with gravity removal have been proposed in this article. The estimation based on integrating process with zero reset at the extreme peaks of the vertical, rather than horizontal, acceleration. Authors have given new method to estimate indoor 3D displacements as a basic for positioning of pedestrian without knowing of stair measurements and provided the most convenient IMU location at waist. In order to verify displacement estimation system’s feasibility and evaluate its performance, a range of experiments which are grouped into two sets of experiment including straight path, and triangular shape path are conducted by four subjects. In each set, people who tasked to perform experiments are required to move at normal step size and at speed 2 steps per second. The experimental results have demonstrated the capability of the algorithm via a RMS displacement error of 3.56% for straight path and 1.43% for the triangular shape path.
Finally, the algorithm in this article is only focusing on climbing upstairs and descending downstairs. The displacement estimations when pedestrian acts in other motion modes like standing, walking on escalator and standing in evaluator will be researched in the future work.
Conflict of Interest
The authors declare no conflict of interest.
Acknowledgment
This project is supported by Singapore University of Technology and Design (SUTD) Temasek Lab, Pillar of Engineering Product Development (EPD), Changi 487372, Singapore.
In addition, this project is supported by Van Lang University (VLU) Electronics and Electrical Engineering Division, Ho Chi Minh City 700000, Vietnam.
- P. Nuankaew, P. Temdee, “Matching of compatible different attributes for compatibility of members and groups” Int. J. Mob. Learn. Organ., 13(1), 4–29, 2019. https://doi.org/10.1504/IJMLO.2019.096469.
- P. Nuankaew, W. Nuankaew, K. Phanniphong, S. Imwut, S. Bussaman, “Students Model in Different Learning Styles of Academic Achievement at the University of Phayao, Thailand” Int. J. Emerg. Technol. Learn. IJET, 14(12), 133–157, 2019. https://doi.org/10.3991/ijet.v14i12.10352.
- F. M. van der Kleij, “Comparison of teacher and student perceptions of formative assessment feedback practices and association with individual student characteristics” Teach. Teach. Educ., 85, 175–189, Oct. 2019. http://doi.org/10.1016/j.tate.2019.06.010.
- C. Brandmiller, H. Dumont, and M. Becker, “Teacher Perceptions of Learning Motivation and Classroom Behavior: The Role of Student Characteristics” Contemp. Educ. Psychol., 101893, 2020. http://doi.org/10.1016/j.cedpsych.2020.101893.
- C.-Y. Chen and P. P. Chong, “Software engineering education: A study on conducting collaborative senior project development” J. Syst. Softw., 84(3), 479–491, 2011. http://doi.org/10.1016/j.jss.2010.10.042.
- D. A. Morley, “Enhancing networking and proactive learning skills in the first year university experience through the use of wikis” Nurse Educ. Today, 32(3), 261–266, 2012. http://doi.org/10.1016/j.nedt.2011.03.007.
- I. Gnizy, E. Baker William, and Grinstein Amir, “Proactive learning culture: A dynamic capability and key success factor for SMEs entering foreign markets,” International Marketing Review, 31(5), 477–505, 2014. https://doi.org/10.1108/IMR-10-2013-0246.
- B.-K. Joo and T. Lim, “The Effects of Organizational Learning Culture, Perceived Job Complexity, and Proactive Personality on Organizational Commitment and Intrinsic Motivation,” Journal of Leadership & Organizational Studies, 16(1), 48–60, Aug. 2009. https://doi.org/10.1177/1548051809334195.
- A. Ruiz-Iniesta, G. Jimenez-Diaz, M. Gomez-Albarran, “Recommendation in Repositories of Learning Objects: A Proactive Approach that Exploits Diversity and Navigation-by-Proposing” in 2009 Ninth IEEE International Conference on Advanced Learning Technologies, 543–545, 2009. http://doi.org/10.1109/ICALT.2009.23.
- D. Gallego, E. Barra, S. Aguirre, G. Huecas, “A model for generating proactive context-aware recommendations in e-Learning systems” in 2012 Frontiers in Education Conference Proceedings, 1–62012, 2012. http://doi.org/10.1109/FIE.2012.6462246.
- M. Reuter et al., “Learning Factories’ Trainings as an Enabler of Proactive Workers’ Participation Regarding Industrie 4.0” Procedia Manuf., 9, 354–360, 2017. http://doi.org/10.1016/j.promfg.2017.04.020.
- S. Moon, J. G. Carbonell, “Proactive learning with multiple class-sensitive labelers” in 2014 International Conference on Data Science and Advanced Analytics (DSAA), 32–38, 2014. http://doi.org/10.1109/DSAA.2014.7058048.
- P. Chapman, J. Clinton, R. Kerber, T. Khabaza, T. Reinartz, C. Shearer, R. Wirth, “Promoting reading comprehension and critical–analytic thinking: A comparison of three approaches with fourth and fifth graders” Contemp. Educ. Psychol., 46, 101–115, 2016. http://doi.org/10.1016/j.cedpsych.2016.05.002.
- P. Nuankaew, P. Temdee, “Of online community: Identifying mentor and mentee with compatible different attributes and decision tree” in 2015 12th International Conference on Electrical Engineering/Electronics, Computer, Telecommunications and Information Technology (ECTI-CON), 1–6, 2015. http://doi.org/10.1109/ECTICon.2015.7207130.
- P. Nuankaew, P. Temdee, “Determining of compatible different attributes for online mentoring model” in 2014 4th International Conference on Wireless Communications, Vehicular Technology, Information Theory and Aerospace Electronic Systems (VITAE), 1–5, 2014. http://doi.org/10.1109/VITAE.2014.6934434.
- P. Nuankaew, W. Nuankaew, T. Thamma, “The Recommended System for the Relationship between Educational Programs and Stu-dents’ Interests” in International Conference on Digital Arts, Media and Technology, 2-3, 2016.
- W. Tan, A. Tang, T. Wang, W. Tan, L. Li, Z. Zhang, “An Overall Lifecycle Modeling Method for E-Learning Services and the Cooperative Mechanism Based on PCDA” in 2013 IEEE International Conference on Systems, Man, and Cybernetics, 669–674, 2013. http://doi.org/10.1109/SMC.2013.119.
- D. A. Vidhate, P. Kulkarni, “Performance enhancement of cooperative learning algorithms by improved decision making for context based application” in 2016 International Conference on Automatic Control and Dynamic Optimization Techniques (ICACDOT), 246–252, 2016. http://doi.org/10.1109/ICACDOT.2016.7877588.
- C.-T. Chang, C.-Y. Tsai, S.-E. Peng, H.-H. Tsai, P.-T. Yu, “On the Design of Multi-User Streaming Feedback System for Application of Cooperative Learning” in 2016 International Computer Symposium (ICS), 656–659, 2016. http://doi.org/10.1109/ICS.2016.0134.
- P. Maresca, E. Gómez, J. Caja, C. Barajas, R. Ledesma, “Academic Learning Platform for Practical Classes: A Learning Model in Manufacturing Engineering” Procedia Eng., 132, 205–212, 2015. http://doi.org/10.1016/j.proeng.2015.12.471.
- A. Bouabid, P. Vidal, J. Broisin, “Integrating Learning Management Systems and Practical Learning Activities: The Case of Computer and Network Experiments” in 2009 Ninth IEEE International Conference on Advanced Learning Technologies, 398–402, 2009. http://doi.org/10.1109/ICALT.2009.181.
- A. Mathew, V. Pangracious, A. Varghese, A. Thomas, D. Mathew, J. George, “PROJECT HAWK: An innovative introduction of practical learning and entrepreneurship in engineering education” in 2012 2nd Interdisciplinary Engineering Design Education Conference (IEDEC), 34–40, 2012. http://doi.org/10.1109/IEDEC.2012.6186919.
- A. Smith, C. Bluck, “Multiuser Collaborative Practical Learning Using Packet Tracer” in 2010 Sixth International Conference on Networking and Services, 356–362, 2010. http://doi.org/10.1109/ICNS.2010.56.
- G. Hamerly J. Drake, “Accelerating Lloyd’s algorithm for k-means clustering” in Partitional clustering algorithms, Springer, 41–78, 2015. https://doi.org/10.1007/978-3-319-09259-1_2.
- P. Nuankaew, W. Nuankaew, P. Temdee, “Institution recommendation using relationship optimisation between program and student context” Int. J. High. Educ. Sustain., 2(4), 279–302, 2019. https://doi.org/10.1504/IJHES.2019.103365.
- P. Nuankaew, W. Nuankaew, K. Phanniphong, R. Fooprateepsiri, S. Bussaman, “Analysis Dropout Situation of Business Computer Students at University of Phayao” in The Impact of the 4th Industrial Revolution on Engineering Education, Cham, 419–432, 2020. http://doi.org/10.1007/978-3-030-40274-7_42.
- P. Nuankaew, “Dropout Situation of Business Computer Students, University of Phayao” Int. J. Emerg. Technol. Learn. IJET, 14(19), 2019. https://doi.org/10.3991/ijet.v14i19.11177.