
Clustering of Mindset towards Self-Regulated Learning of Undergraduate Students at the University of Phayao
Volume 5, Issue 4, Page No 676-685, 2020
Author’s Name: Pratya Nuankaewa)
View Affiliations
School of Information and Communication Technology, University of Phayao, Phayao, 56000, Thailand
a)Author to whom correspondence should be addressed. E-mail: pratya.nu@up.ac.th
Adv. Sci. Technol. Eng. Syst. J. 5(4), 676-685 (2020); ![]() DOI: 10.25046/aj050481
DOI: 10.25046/aj050481
Keywords: Educational Data Mining, Learning Analytics Model, Learning Styles, Self-Regulated Learning

Export Citations
The effects of Covid-19 severely affected the Thai higher education model. Therefore, there are three significant objectives in this research: (1) to cluster the mindsets and attitudes toward self-regulated learning styles of undergraduate students at the University of Phayao. (2) to construct a predictive model for recommending an appropriate student learning clusters. (3) to evaluate the predictive model that has been constructed. Samples collected a compilation of 472 student satisfaction with questionnaires from three schools, with seven disciplines at the University of Phayao, Thailand. Research tools consisted of statistical and machine learning techniques as follows: frequency, percentage, average, standard deviation, k-means clustering, decision tree techniques, cross-validation methods, confusion matrix performance, accuracy, precision, and recall measurement. Researcher found that the k-means model with the highest accuracy is the decision tree model that was classified into three clusters by dividing the model testing into the leave-one-out cross-validation method with a depth of seven levels of the decision tree model and an accuracy of 98.73%. From the results and studies, it can be concluded that the developed model is effective and reasonable to be further developed as an application for further organizational development.
Received: 22 June 2020, Accepted: 11 August 2020, Published Online: 25 August 2020
1. Introduction
Nowadays, the learning behavior of youth and the new generation has changed dramatically which have made educational system unable to cope with acts that wants to inquire more about the issue than just following what is instructed. The results have created learning that is more aligned with the new generation who demand to know more and expand their interests [1]–[5]. The learning styles of the new generation of children are highly identified as having a limited attention, known as ADHD: Attention Deficit Hyperactivity Disorder [6], [7]. In addition, the device addiction and mobile addiction symptoms are more intensifying and widespread among youth and the younger generation [8].
These type of behaviors often lead into internet addiction [9]. In 2009, a medical study found that the average age of internet addicts was 17.6 years (range: 12-27 years), as the use of internet was nine hours a day and increasing in proportion [9]. In 2016, there was a study of personality and positive orientation in Internet and Facebook addiction [10]. It has been found that age has a significant effect on factors distinguishing both Internet and Facebook addiction. Moreover, young people more often have problem with excessive use with the Internet and Facebook than adults [10]. Therefore, it can be summarized primarily that young people and the new generation are driven by the changes in technology, which has completely changed the learning behavior of students.
At the same time, the social patterns of the new generation have cause changes in the way of communication, making contact, and having a dialogue. Due to the addiction from the mobile phones and the internet, their habit has made them choose to be more associated with online communities rather than interacting with people in a normal society [11]. From the patterns and behaviors of the aforementioned young generation, the results of formal education, which is a basic education for everyone, are not consistent with the proper standards for student behavior of learning in a classroom environment [11], [12]. It is possible that the traditional teaching has been outdated for a long period of time thus presenting itself to be a problem in developing a healthy and sound method for students to make any real progress in learning, and acquiring the necessary employable skills and abilities after graduation. The best solution is to change the style of knowledge management and teaching strategies to suit students.
The learning theory that is consistent and suitable for solving the above problem is the theory of Self-Regulated Learning (SRL), which is a widely accepted theory [13]–[16]. Self-regulated learning strategies can be applied to learning in the new era. It can also be applied to the promotion of Technology Enhanced Learning (TEL), which provides opportunities to increase the learning skills necessary for students [11], [17]. In addition, an important principle of self-regulated strategies is the development of learning that aims learning towards achieving the goals set by the learners themselves [15].
However, learning can happen anywhere and anytime, with each person learning differently, because each day in life presents itself with different situations for exploring something new. Moreover, each event may have similarities or differences with an experience that results in the behavior of the learners who are learning. In addition, when humans learn and achieve academic achievement, the result is a change in learning behavior that is the result from past events or situations. But changing human behavior may not always be learning, due to changes in a certain period of time whereas the person may have to find the self-motivation to get themselves to take part in the learning process.
From the benefits of self-regulated learning strategies, the researchers can use this theory to solve problems and design the learning processes that are appropriate for learners in the new normal education system. This is of vital interest and persuades the researcher to conduct research. The background of the researcher’s past work is the study of the behavior of learners at the tertiary [5], [18], [19] and secondary [20], [21]levels. In addition, the researcher is also interested in developing educational models in order to create a learning model that is truly suitable for the learners [22], [23]. The success and achievement that researchers have found is to support learners to achieve learning success and to combine academic achievement. These are the forces that support and continually motivate researchers to pursue our research.
1.1. Research Objectives
There are three significant objectives: The first objective is to cluster the mindsets and attitudes toward self-regulated learning styles of undergraduate students at the University of Phayao. The second objective is to construct a predictive model for recommending an appropriate student learning clusters. Lastly, the third objective is to evaluate the predictive model that has been constructed.
The expectation of this research is to know the impact of the Covid-19 pandemic, which has had a severe impact on the education model by studying the perception and attitudes towards online and online learning styles of learners at the University of Phayao. In addition, the expected result is knowing the group of learners according to the attitude and self-learning style which will be used for developing the quality and potential of students in the future.
1.2. Research Approach
The research approach has been conducted according to the process of the CRISP-DM methodology [24], [25]. It consists of six steps as follows: business understanding, data understanding, data preparation, modeling, evaluation, and deployment. The details of the research process are presented on the topic of research methodology. Data collection was carried out in a compilation of 472 student satisfaction with questionnaires from three schools, with seven disciplines at the University of Phayao which is stored on the website: https://bit.ly/2BobB8l.
The research consisted of statistical tools and machine learning tools as follows: percentage, mean, average, standard deviation, k-means clustering, decision tree techniques, cross-validation methods, confusion matrix performance, accuracy, precision, and recall measurement.
1.3. Research Ethic
This research has requested permission from the School of Information and Communication Technology, the University of Phayao, and related agencies, by implementing the regulations of the university.
2. Literature Reviews
2.1. Self-Regulated Learning
Self-regulated learning refers to the process of setting goals, controlling, and managing the sources of knowledge based on the motivation of the learners to set learning goals and expect success in intellectual learning [15], [17], [26]–[29].
The composition of the self-regulated learning consists of three important phases [13], [27], [29]. The first phase is the forethought phase, which consists of two important processes as follows: (1) task analysis, and (2) self-motivation beliefs. The second phase is the performance phase, which consists of two important processes as follows: (1) self-control, and (2) self-observation. Finally, the third phase is the self-reflection phase, which consists of two important processes as follows: (1) self-judgment, and (2) self-reaction. Details of the components of the Self-regulated learning are shown in Figure 1.
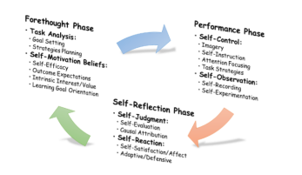 Figure 1: Phases and sub-process of self-regulated learning
From the theory of self-regulated learning, there is a lot of interest in research [13], [14], [17], [28]. It can therefore be concluded that this self-regulated learning theory is appropriate for this research.
2.2. Student Academic Performance
Student academic performance is a method of studying the effectiveness arising from graduation or learners receiving academic achievement. Many researchers have studied learning styles that encourage learners to receive high efficiency [5], [18], [30]–[32]. For example, there has been research works done to study the relationships of multiple variables that affect academic achievement using a method named “Structural Equation Modeling (SEM)” [30]. SEM is a type of statistical model that searches for and describes the relationships between multiple variables. The second example is research which studies the compatibility of different characteristics [32]. In the second example, they attempted to present the concept of the compatibility of the mentor and the receiver by comparing it to a jigsaw. The last example is research that studies the impact of unsuccessful studies or dropouts, in which these researches are discussed in many dimensions and perceptions of the researchers [19], [33].
There are also researchers who study the tools for applying the concepts for measuring and evaluating student performance [33]–[35]. Tools used in their studies include the use of statistical tools and data mining tools: basic statistical tools, decision tree techniques, k-means and k-medoids algorithms, confusion matrix performance, and cross-validation methods.
From the above example, it shows that various researchers clearly value the study of student academic performance. Therefore, it corresponds to the purpose of this research which aims to discover the pattern of relationships affecting graduation or non-graduation as specified by the curriculum.
2.3. Improving Academic Achievement
Generally, researchers in various fields have studied research and development in the science of educational quality development [5], [14], [36]–[38], in which the objectives of each research group are different in methods and perspectives. Some research groups want to study the factors that support and change learners’ behavior and instructional methods [3], [13], [31], [33]. Some research groups want to study and develop tools that support the efficiency of teaching and learning [35], [37], [39]. Some research groups want to apply modern technology to be used in teaching and learning activities [40], [41]. Finally, all research groups have a similar objective, which is to encourage learners to have a positive impact with their studies toward graduation.
However, the concept of improving academic achievement is aimed on raising the level of student achievement performance values [5], [15], [38], [42]. The main goal of this research should focus on the three main components: The first target is to cluster the characteristics of mindset towards self-regulated learning styles of undergraduate students at the University of Phayao. The second target is to construct the predictive model for suggesting the appropriate student cluster. The third target is to evaluate the predictive model that has been developed.
2.4. Educational Data Mining
Educational data mining (EDM) is the science of combining the use of data science tools and educational technology for educational data analysis. It consists of machine learning applications, data mining tools and advanced statistics to carry out the process of educational system success [43]–[45]. In addition, the educational data mining refers to techniques, tools, and research designed to automate the definition of large data sources that are related to learning activities in the educational system [5], [19], [35], [45].
Examples of research in this field include research in application development to be recommended as suitable educational institutions for students [4], [35], [39]. They study and research on learners’ factors, educational institutions’ factors, educational data mining models that encourage learners to study in a suitable educational institution, and develop them into applications. In addition, there are other research studies such as Ahmad’s research which analyzes the educational model to see where the best fit are for a particular program [36]. They study the behavior of learners occurring in online activities through a learning management system known as MOOC. Firdausiah Mansur’s research [37] proposed a personalized learning model to find suitable learning methods based on a deep learning algorithm. Both of their results are impressive because they have applied machine learning applications, data mining tools, and advanced statistics which enabled them to discover some facts from the data.
Finally, it can be concluded that in the analysis of data mining for education it is necessary to find a new perspective that allows teachers to truly understand the learners.
3. Research Methodology
The research methodology was conducted according to the CRISP-DM method [24], [25]. It has six operations in accordance with the principles of CRISD-DM techniques, which include (1) business understanding, (2) data understanding, (3) data preparation, (4) modeling, (5) evaluation, and (6) deployment, as shown in Figure 2 below.
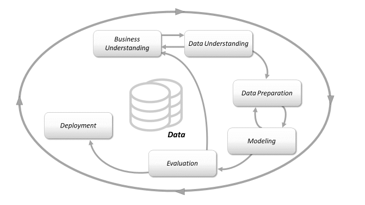 Figure 2: Research Methodology
3.1. Business Understanding
The business understanding phase focuses on understanding the audit objectives and needs from a case perspective and converting this knowledge into a definition of evidence mining problems and a preliminary plan designed to achieve the objectives [24], [25], [46]. For this reason, the researcher aimed at the three objectives of the research as follows: The first objective is to cluster the characteristics of mindset towards self-regulated learning styles of undergraduate students at the University of Phayao. The second objective is to construct the predictive model for suggesting the appropriate student cluster. Finally, the third objective is to evaluate the predictive model that has been developed.
3.2. Data Understanding
The purpose of data understanding phase is to identify data quality problems, construct questions for finding patterns of data, and to examine interesting subset that create assumptions for hidden data [24], [25], [46]. The studied data was on the students of the University of Phayao, Phayao, Thailand. The data collected consisted of students’ data from the School of Information and Communication Technology (ICT), the School of Management and Information Sciences (MIS), and the School of Law at the University of Phayao. In addition, the data collected were from seven disciplines of students majoring in the courses of accounting, business computer, law and accounting, management, marketing, and tourism. The purpose of the various data collection is to get information that covers the attitude of data providers.
3.3. Data Preparation
The data preparation phase aims to design activities that cover all activities to enable data collection for analysis and development of models. It details the sub-steps to prepare the data that will be fed into the research tool to create a model by initial management at raw data. It has five sub-steps to implement: selecting data, cleaning data, constructing data, integrating data, and formalizing data [24], [25], [46].
The data collected were on 472 students from the University of Phayao, Thailand. The data collection is divided into two categories according to the survey type. It consists of 319 students who responded from regular surveys and 153 people who answered from online surveys; details are shown in Table 1 to Table 6. In addition, the data collected in this research is defined in a digital format, which is stored on the website: https://bit.ly/2BobB8l.
Table 1: Data collected is classified by survey types
| Survey Types | Absolute Count | Fraction (Percentage) |
| Regular Survey | 319 | 67.58% |
| Online Survey | 153 | 32.42% |
| Total: | 472 | 100.00% |
Table 1 shows that the regular survey has the largest number of respondents, with 319 students representing 67.58 percent of all respondents.
Table 2: data collected is classified by gender.
| Gender | Absolute Count | Fraction (Percentage) |
| Male | 112 | 23.73% |
| Female | 360 | 76.27% |
| Total: | 472 | 100.00% |
Table 2 shows that Female have the largest number of respondents, with 360 students representing 76.27 percent of all respondents.
Table 3: Data collected is classified by disciplines.
| Disciplines | Absolute Count | Fraction (Percentage) |
| Accounting | 208 | 44.07% |
| Business Computer | 73 | 15.47% |
| Law and Accounting | 28 | 5.93% |
| Management | 3 | 0.64% |
| Marketing | 43 | 9.11% |
| Tourism | 117 | 24.79% |
| Total: | 472 | 100.00% |
Table 3 shows that Accounting have the largest number of respondents, with 208 students representing 44.07 percent of all respondents. The second group that answered the most questionnaire was Tourism, with 117 students representing 24.79 percent.
Table 4: Data collected is classified by affiliation.
| Affiliation | Absolute Count | Fraction (Percentage) |
| School of Information and Communication Technology (ICT) | 73 | 15.47% |
| School of Law | 28 | 5.93% |
| School of Management and Information Sciences (MIS) | 371 | 78.60% |
| Total: | 472 | 100.00% |
Table 4 shows that the School of Management and Information Sciences (MIS) have the largest number of respondents, with 371 students representing 78.60 percent of all respondents.
Table 5: Data collected is classified by learning styles.
| Learning Styles | Absolute Count | Fraction (Percentage) |
| Online Learning Style | 81 | 17.16% |
| Offline Learning Style | 391 | 82.84% |
| Total: | 472 | 100.00% |
Table 5 shows that the collected data is categorized according to the learning styles that students are interested in. Table 5 shows that students are interested in the traditional learning or in front of the classroom, with 391 students representing 82.84 percent of all respondents.
Table 6: Data collected is classified by acceptance of SRL style.
| Acceptance of SRL style | Absolute Count | Fraction (Percentage) |
| Low Level (0-30%) | 18 | 3.81% |
| Medium Level (31-70%) | 418 | 88.56% |
| High Level (71-100%) | 36 | 7.63% |
| Total: | 472 | 100.00% |
Table 6 shows that the level of acceptance to self-regulated learning style is at a medium level (31-70%), with 418 students representing 88.56 percent of all respondents.
3.4. Modeling
Various modeling techniques are selected and implemented, with their parameters being compared to the best values. In general, there are many techniques for the same type of data mining problem. Some techniques require a specific data format data [24], [25], [46]. In addition, modeling is the process of creating a suitable prototype. It consists of four important parts: selecting the modeling techniques, generating test design, building the model, and assessing the model [31], [35].
As mentioned above, the machine learning tools selected are k-means clustering and decision tree techniques. The benefit of the k-means is that it can be recommended for clustering with similar data patterns [31], while the benefit of the decision tree is that it is a structural decision consisting of nodes (features) and leaves (decisions) [35].
In this research, the analysis for clustering and charting of decision tree was based on data from questionnaires filled out by students who were assigned to take part in the research activities. The final result of the modeling is a set of variables (characteristics) that are important for predicting a reasonable cluster for the learners, which will be used to suggest activities for the learners in the next academic year.
3.5. Evaluation
The goal of the evaluation is to evaluate the performance of the results, which aims to construct the significant relationship models [19], [33]. The tools are used in the research, including the cross-validation techniques as shown in Figure 3, and the calculation of confusion matrix as mentioned in Figure 4.
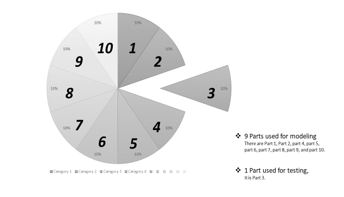 Figure 3: Cross-Validation Techniques
Figure 3 displays the separation of data for evaluating the model. The cross-validation method divides the data into two parts. The first part is used for modeling and the remainder is for testing the model. In addition, model evaluation requires a tool called a confusion matrix to test the model’s performance, with the principles shown in Figure 4.
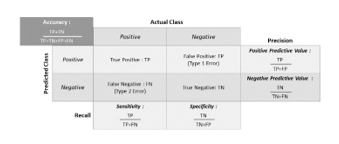 Figure 4: Confusion Matrix Calculation
Figure 4 presents the composition of the confusion matrix performance, which is composed of the actual class and the predicted class. An important benefit of the performance of the confusion matrix is the ability to determine the model’s ability to predict results, such as the predictive ability or accuracy, model precision, model sensitivity, and model specificity (recall measurement). These values are used to determine the actual performance model. Moreover, Figure 4 also demonstrates the formulas and methods for calculating the various performance parameters in detail.
3.6. Deployment
The deployment is intended to bring results and discoveries in order to establish relationships and analyze the relationships that are discovered.
3.6.1. Testing Model Results
As mentioned early, the tools used to evaluate the model consist of two parts: cross-validation method and confusion matrix performance. This section presents the use of evaluation tools in research. The testing process divides the data into two parts according to the cross-validation method principles.
There are three methods of cross-validation in this research. The first method is 10-Fold cross-validation, which used 9-Fold for modeling and 1-Fold for testing. The second method is 50-Fold cross-validation, which used 49-Fold for modeling and 1-Fold for testing. The last method is leave-one-out cross-validation, which used 99 percent of data for modeling and 1 percent of data for testing. However, each time the cross-validation test is reported, the model results are also tested by using the confusion matrix performance.
3.6.2. Applying Model Results
The purpose of applying model results is to manage the developed models. It has four sections as follows: (1) decision tree model, (2) decision tree model applying results, (3) cluster model, and (4) number of members in each cluster.
4. Research Results
In the research results, the researchers classified the research report into four parts which are satisfaction level towards questionnaire, modeling results, model testing results, and model applying results.
4.1. Satisfaction level towards questionnaire
This section summarizes the satisfaction levels of the 472 students, which contain data from three schools and seven disciplines at the University of Phayao. The details of the summary results are shown in Table 8.
In interpreting the data according to the characterization criteria, the interpretation is based on a five-level interpretation method by comparing it with the criteria that divides the level estimation into five equal levels, as followed in Equation (1). The result of the calculation is shown in Equation (2).
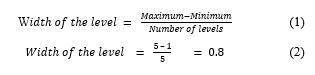 From the calculation results in Equation (2), the interpretation results can be specified as shown in Table 7.
Table 7: Interpretation and Meaning
| Width of the level | Interpretation | Meaning |
| 1.00 – 1.80 | Highly Unacceptable | The lowest level of satisfaction |
| 1.81 – 2.60 | Unacceptable | Low level of satisfaction |
| 2.61 – 3.40 | Acceptable | Satisfaction |
| 3.41 – 4.20 | Highly Acceptable | High level of satisfaction |
| 4.21 – 5.00 | Maximum Acceptable | The highest level of satisfaction |
Table 8: Satisfaction level towards questionnaire
| Question | Average | S.D. | Interpretation |
|
Question 1: What level of self-regulated learning can you apply to your studies? |
3.38 | 0.64 | Highly Acceptable |
|
Question 2: What level do you agree that self-regulated learning is important for online learning? |
3.58 | 0.78 | Highly Acceptable |
|
Question 3: What level do you agree that finding your own knowledge can be more useful than studying in the classroom? |
3.45 | 0.81 | Highly Acceptable |
|
Question 4: What level do you agree that inspiration and motivation have more influence on learning than the advice of teachers? |
3.73 | 0.56 | Highly Acceptable |
| Total Average: | 3.54 | 0.79 | Highly Acceptable |
Table 8 shows the level of satisfaction with the four questionnaires. It can be seen that the overall level of satisfaction is high (3.54). It can therefore be concluded that the students of the University of Phayao are satisfied with the high level of self-regulated learning styles.
4.2. Modeling Results
Modeling results are the various models on different criteria, such as defining the unequal depth of the decision tree, and determining the different types of cross-validation method tests, which have the results shown in Table 9 and Table 10.
Table 9: Modeling results from k-Means clustering
| Cluster Number | Depth of Decision Tree | Cross-validation method | ||
| 10-Fold | 50-Fold | Leave-one-out | ||
| 3 Clusters | Level 2 | 69.06% | 69.09% | 69.07% |
| Level 3 | 89.38% | 89.47% | 89.41% | |
| Level 4 | 90.65% | 91.60% | 91.53% | |
| Level 5 | 92.56% | 92.40% | 92.37% | |
| Level 6 | 95.34% | 95.73% | 95.55% | |
| Level 7* | 98.30% | 98.69% | 98.73%* | |
| Level 8 | 98.30% | 98.69% | 98.73% | |
| Level 9 | 98.30% | 98.69% | 98.73% | |
| 4 Clusters | Level 2 | 59.12% | 59.22% | 59.11% |
| Level 3 | 78.40% | 78.98% | 78.81% | |
| Level 4 | 87.08% | 84.22% | 82.63% | |
| Level 5 | 91.52% | 92.73% | 91.10% | |
| Level 6 | 93.01% | 92.07% | 89.41% | |
| Level 7* | 95.55%* | 95.00% | 92.58% | |
| Level 8 | 95.55% | 95.00% | 92.58% | |
| Level 9 | 95.55% | 95.00% | 92.58% | |
| 5 Clusters | Level 2 | 57.42% | 57.51% | 57.42% |
| Level 3 | 80.93% | 81.00% | 80.93% | |
| Level 4 | 95.35% | 95.62% | 95.55% | |
| Level 5* | 96.83% | 97.07%* | 97.03% | |
| Level 6 | 96.83% | 97.07% | 97.03% | |
| Level 7 | 96.83% | 97.07% | 97.03% | |
| Level 8 | 96.83% | 97.07% | 97.03% | |
| Level 9 | 96.83% | 97.07% | 97.03% | |
| 6 Clusters | Level 2 | 53.61% | 53.62% | 53.60% |
| Level 3 | 56.34% | 58.16% | 58.05% | |
| Level 4 | 77.12% | 77.84% | 77.97% | |
| Level 5 | 86.24% | 85.51% | 84.75% | |
| Level 6 | 93.21% | 93.71% | 93.64% | |
| Level 7* | 97.24% | 97.71% | 97.67%* | |
| Level 8 | 97.24% | 97.71% | 97.67% | |
| Level 9 | 97.24% | 97.71% | 97.67% | |
| 7 Clusters* | Level 2 | 45.77% | 46.24% | 46.19% |
| Level 3 | 56.16% | 56.18% | 56.14% | |
| Level 4 | 71.42% | 73.53% | 77.12% | |
| Level 5 | 82.23% | 85.69% | 86.65% | |
| Level 6 | 88.58% | 90.36% | 89.83% | |
| Level 7 | 94.29% | 94.13% | 94.28% | |
| Level 8 | 96.20% | 95.24% | 95.13% | |
| Level 9* | 97.90%* | 97.00% | 97.03% | |
From Table 9, it shows that the k-means model with the highest accuracy is the decision tree model that is classified into 3 clusters by dividing the model testing into the leave-one-out cross-validation method with a depth of 7 levels of the decision tree model and has an accuracy of 98.73%. In Addition, the testing results classified by other clusters yield a lower accuracy. For example, the 4 clusters with the highest results are 95.55%, the 5 clusters with the highest results are 97.07%, the 6 clusters with the highest results are 97.67%, and the 7 clusters with the highest results are 97.90%.
4.3. Model Testing Results
From the results of the prototype model development, it can be concluded that the model with the highest accuracy is the development of the model from k-means clustering, with the appropriate number of 3 clusters and the leave-one-out cross-validation result with an accuracy of 98.73%. Details of the developed model are shown in Table 10.
Table 10: Model testing results
| Precision Class | 97.37% | 97.50% | 100.00% | 98.37% | 97.96% | 91.67% | 97.30% | ||
| Actual Class | True Cluster_6 | 1 | 0 | 0 | 0 | 0 | 0 | 36 | 97.30% |
| True Cluster_5 | 1 | 0 | 0 | 0 | 0 | 22 | 1 | 91.67% | |
| True Cluster_4 | 1 | 0 | 0 | 1 | 48 | 0 | 0 | 96.00% | |
| True Cluster_3 | 0 | 0 | 0 | 121 | 0 | 0 | 0 | 100.00% | |
| True Cluster_2 | 0 | 1 | 85 | 1 | 0 | 0 | 0 | 97.70% | |
| True Cluster_1 | 0 | 39 | 0 | 0 | 1 | 2 | 0 | 92.86% | |
| True Cluster_0 | 111 | 0 | 0 | 0 | 0 | 0 | 0 | 100.00% | |
|
Accuracy: 97.90% (+/- 2.41%) |
Pred. Cluster_0 | Pred. Cluster_1 | Pred. Cluster_2 | Pred. Cluster_3 | Pred. Cluster_4 | Pred. Cluster_5 | Pred. Cluster_6 | Recall Class | |
| Predicted Class | |||||||||
Table 10 shows that the model performance testing is at the highest level, which can confirm the suitability of the model as well.
4.4. Model Applying Results
From the model that has been selected and demonstrated the performance, this section presents the decision tree model as shown in Table 11, the decision tree rules model for self-testing as shown in the test results in Table 12, the cluster model as shown in Table 13, and number of members in each cluster as shown in Table 14.
Table 11: Decision tree model
| Decision Tree Model |
|
Question 2 > 3.500 | Question 4 > 2.500 | | Question 3 > 3.500 | | | Question 4 > 3.500 | | | | Question 1 > 4.500 | | | | | Question 4 > 4.500: cluster_1 {cluster_1=11} | | | | | Question 4 ≤ 4.500: cluster_5 {cluster_1=1, cluster_5=2} | | | | Question 1 ≤ 4.500 | | | | | Question 2 > 4.500 | | | | | | Question 1 > 3.500: cluster_1 {cluster_1=20} | | | | | | Question 1 ≤ 3.500 | | | | | | | Question 3 > 4.500: cluster_1 {cluster_1=3} | | | | | | | Question 3 ≤ 4.500: cluster_0 {cluster_0=7} | | | | | Question 2 ≤ 4.500 | | | | | | Question 3 > 4.500 | | | | | | | Question 1 > 3.500: cluster_1 {cluster_1=6} | | | | | | | Question 1 ≤ 3.500: cluster_0 {cluster_0=6} | | | | | | Question 3 ≤ 4.500: cluster_0 {cluster_0=71} | | | Question 4 ≤ 3.500 | | | | Question 3 > 4.500: cluster_4 {cluster_1=1, cluster_4=3} | | | | Question 3 ≤ 4.500 | | | | | Question 1 > 3.500: cluster_2 {cluster_2=10} | | | | | Question 1 ≤ 3.500: cluster_4 {cluster_2=1, cluster_4=3} | | Question 3 ≤ 3.500 | | | Question 4 > 4.500: cluster_0 {cluster_0=17, cluster_6=1, cluster_5=1} | | | Question 4 ≤ 4.500: cluster_2 {cluster_2=75} | Question 4 ≤ 2.500 | | Question 3 > 3.500: cluster_2 {cluster_2=1, cluster_4=1} | | Question 3 ≤ 3.500: cluster_3 {cluster_3=4} Question 2 ≤ 3.500 | Question 3 > 3.500 | | Question 1 > 3.500 | | | Question 4 > 3.500: cluster_5 {cluster_5=20} | | | Question 4 ≤ 3.500: cluster_4 {cluster_4=7} | | Question 1 ≤ 3.500 | | | Question 4 > 4.500: cluster_0 {cluster_0=10, cluster_4=1} | | | Question 4 ≤ 4.500: cluster_4 {cluster_4=35} | Question 3 ≤ 3.500 | | Question 4 > 3.500: cluster_6 {cluster_6=36, cluster_5=1} | | Question 4 ≤ 3.500: cluster_3 {cluster_3=117} |
Table 11 shows the decision tree model. It can be developed into a decision tree rules model, as shown in Table 12. Decision tree rules model, it is used to test models using the data collected in the developed model tests.
Table 12: Decision tree rules model applying results
| Rule | Condition (If) | Prediction (Then) |
| 1 | If Question 2 > 3.5 and Question 4 > 2.5 and Question 3 > 3.5 and Question 4 > 3.5 and Question 1 > 4.5 and Question 4 > 4.5 | Then, suitable for cluster_1 = 100% |
| 2 | If Question 2 > 3.5 and Question 4 > 2.5 and Question 3 > 3.5 and Question 4 > 3.5 and Question 1 > 4.5 and Question 4 ≤ 4.5 | then cluster_5 (0 / 1 / 0 / 0 / 0 / 2 / 0) |
| 3 | If Question 2 > 3.5 and Question 4 > 2.5 and Question 3 > 3.5 and Question 4 > 3.5 and Question 1 ≤ 4.5 and Question 2 > 4.5 and Question 1 > 3.5 | Then, suitable for cluster_1 = 100% |
| 4 | If Question 2 > 3.5 and Question 4 > 2.5 and Question 3 > 3.5 and Question 4 > 3.5 and Question 1 ≤ 4.5 and Question 2 > 4.5 and Question 1 ≤ 3.5 and Question 3 > 4.5 | Then, suitable for cluster_1 = 100% |
| 5 | If Question 2 > 3.5 and Question 4 > 2.5 and Question 3 > 3.5 and Question 4 > 3.5 and Question 1 ≤ 4.5 and Question 2 > 4.5 and Question 1 ≤ 3.5 and Question 3 ≤ 4.5 | Then, suitable for cluster_0 = 100% |
| 6 | If Question 2 > 3.5 and Question 4 > 2.5 and Question 3 > 3.5 and Question 4 > 3.5 and Question 1 ≤ 4.5 and Question 2 ≤ 4.5 and Question 3 > 4.5 and Question 1 > 3.5 | Then, suitable for cluster_1 = 100% |
| 7 | If Question 2 > 3.5 and Question 4 > 2.5 and Question 3 > 3.5 and Question 4 > 3.5 and Question 1 ≤ 4.5 and Question 2 ≤ 4.5 and Question 3 > 4.5 and Question 1 ≤ 3.5 | Then, suitable for cluster_0 = 100% |
| 8 | If Question 2 > 3.5 and Question 4 > 2.5 and Question 3 > 3.5 and Question 4 > 3.5 and Question 1 ≤ 4.5 and Question 2 ≤ 4.5 and Question 3 ≤ 4.5 | Then, suitable for cluster_0 = 100% |
| 9 | If Question 2 > 3.5 and Question 4 > 2.5 and Question 3 > 3.5 and Question 4 ≤ 3.5 and Question 3 > 4.5 | Then, suitable for cluster_1 = 25%, and suitable for cluster_4 = 75% |
| 10 | If Question 2 > 3.5 and Question 4 > 2.5 and Question 3 > 3.5 and Question 4 ≤ 3.5 and Question 3 ≤ 4.5 and Question 1 > 3.5 | Then, suitable for cluster_2 = 100% |
| 11 | If Question 2 > 3.5 and Question 4 > 2.5 and Question 3 > 3.5 and Question 4 ≤ 3.5 and Question 3 ≤ 4.5 and Question 1 ≤ 3.5 | Then, suitable for cluster_2 = 25%, and suitable for cluster_4 = 75% |
| 12 | If Question 2 > 3.5 and Question 4 > 2.5 and Question 3 ≤ 3.5 and Question 4 > 4.5 | Then, suitable for cluster_0 = 89.47%, suitable for cluster_5 = 5.26%, and suitable for cluster_6 = 5.26% |
| 13 | If Question 2 > 3.5 and Question 4 > 2.5 and Question 3 ≤ 3.5 and Question 4 ≤ 4.5 | Then, suitable for cluster_2 = 100% |
| 14 | If Question 2 > 3.5 and Question 4 ≤ 2.5 and Question 3 > 3.5 | Then, suitable for cluster_2 = 50%, and suitable for cluster_4 = 50% |
| 15 | If Question 2 > 3.5 and Question 4 ≤ 2.5 and Question 3 ≤ 3.5 | Then, suitable for cluster_3 = 100% |
| 16 | if Question 2 ≤ 3.5 and Question 3 > 3.5 and Question 1 > 3.5 and Question 4 > 3.5 | Then, suitable for cluster_5 = 100% |
| 17 | if Question 2 ≤ 3.5 and Question 3 > 3.5 and Question 1 > 3.5 and Question 4 ≤ 3.5 | Then, suitable for cluster_4 = 100% |
| 18 | if Question 2 ≤ 3.5 and Question 3 > 3.5 and Question 1 ≤ 3.5 and Question 4 > 4.5 | Then, suitable for cluster_0 = 90.90%, and suitable for cluster_4 = 9.10% |
| 19 | if Question 2 ≤ 3.5 and Question 3 > 3.5 and Question 1 ≤ 3.5 and Question 4 ≤ 4.5 | Then, suitable for cluster_4 = 100% |
| 20 | if Question 2 ≤ 3.5 and Question 3 ≤ 3.5 and Question 4 > 3.5 |
Then, suitable for cluster_6 = 97.30% Then, suitable for cluster_5 = 3.70% |
| 21 | if Question 2 ≤ 3.5 and Question 3 ≤ 3.5 and Question 4 ≤ 3.5 then | Then, suitable for cluster_3 = 100% |
| Correct: 464 out of 472 training examples (98.31%) | ||
Table 12 shows the decision tree rules model. It consists of 21 rules. The test results show that the rules can be predicted at a high level, which can accurately predict 464 data sets from a total of 472 data (98.31%). It can therefore be concluded that the developed models are appropriate by showing details of each cluster in Table 13.
Table 13: Cluster model
| Cluster / Attribute | Question 1 | Question 2 | Question 3 | Question 4 |
| Cluster_0 | 3.42 | 4.00 | 3.91 | 4.47 |
| Cluster_1 | 4.24 | 4.76 | 4.67 | 4.71 |
| Cluster_2 | 3.39 | 4.18 | 3.02 | 3.46 |
| Cluster_3 | 3.00 | 2.90 | 2.72 | 2.81 |
| Cluster_4 | 3.14 | 3.10 | 4.12 | 3.36 |
| Cluster_5 | 4.25 | 3.08 | 4.04 | 4.33 |
| Cluster_6 | 3.22 | 2.78 | 2.84 | 4.19 |
Table 13 shows details of each cluster. In addition, Table 14 shows the number of members in each cluster.
Table 14: Number of members in each cluster
| Cluster |
Absolute Count (Member) |
Fraction (Percentage) |
| Cluster_0 | 111 | 23.52% |
| Cluster_1 | 42 | 8.90% |
| Cluster_2 | 87 | 18.43% |
| Cluster_3 | 121 | 25.64% |
| Cluster_4 | 50 | 10.59% |
| Cluster_5 | 24 | 5.08% |
| Total: | 472 | 100.00% |
From Table 9 to Table 10, it details of testing and selection of suitable models. Moreover, Tables 11 to Table 14 are showing the members and the centroid of each cluster. Finally, based on the data and the results of this research it can be concluded that the developed model is very suitable for this study.
5. Research Discussion
In this research, the researcher has divided the discussion process into two sections as follows: the first section is the discussion report of data collection, and the second section is the discussion of the model, testing results and model effectiveness.
5.1. Data Collection Discussion
Based on the summary of the research data collection report from the University of Phayao there were 472 students divided into two groups as follows: the first group is to collect data directly (regular surveys collection) with 319 students. The second group is 153 students from online data collection.
From the data gathered, it can be concluded that this data is small. The researchers should expand the results of the study and gather more data for further analysis in order to comply with data mining principles that require large amounts of data.
5.2. Identify the Headings
Table 9 to Table 14 show the model development process by presenting the analysis results for selecting the model in Table 9, which was done by showing the model performance test in Table 10 and testing the model by data collection in Table 12. It can be concluded that the model is effective and accepted by this research. In addition, Table 13 and Table 14 show the clustering and membership model for each cluster. It can be concluded that each cluster has members distributed appropriately.
6. Conclusion
This research achieved three objectives as follows: The first objective is to cluster the mindsets and attitudes toward self-regulated learning styles of undergraduate students at the University of Phayao. The second objective is to construct a predictive model for recommending an appropriate student learning clusters. Lastly, the third objective is to evaluate the predictive model that has been constructed. Data collection is a compilation of 472 student satisfaction with questionnaires from three schools, and majoring in seven disciplines at the University of Phayao, Thailand. The data consisted of students from the School of Information and Communication Technology (ICT), the School of Management and Information Sciences (MIS), and the School of Law.
The research consisted of statistical tools and machine learning tools as follows: percentage, mean, average, standard deviation, k-means clustering, decision tree techniques, cross-validation methods, confusion matrix performance, accuracy measurement, precision measurement, and recall measurement. The results of the research found that the k-means model with the highest accuracy is the decision tree model that is classified into three clusters by dividing the model testing into the leave-one-out cross-validation method with a depth of seven levels of the decision tree model and has an accuracy of 98.73%. From the results and studies, it can be concluded that the developed model is effective and reasonable to be further developed as an application for further organizational development.
For future studies, the researchers found that the results of this research could be clearly further enhanced. For example, the researcher could use results to cluster learners’ instruction based on their perceptions and attitudes towards managing online instruction based on Self-Regulated Learning theory. In addition, the researcher can use the results of the research into a computer program to facilitate the learners and teachers to use the results of the research in a useful way.
Conflict of Interest
The authors declare no conflict of interest.
Acknowledgment
This research is part of a study on “The Study of Trends and Impacts of Disruptive Technology on the Education System at the School of Information and Communication Technology, the University of Phayao”. This research is supported by the University of Phayao and Rajabhat Mahasarakham University. The authors would like to thank Mrs. Wongpanya Nuankaew, the advisor, lecturers, students, technicians, and all respondents for their entire support.
- P. Olivos, A. Santos, S. Martín, M. Cañas, E. Gómez-Lázaro, Y. Maya, “The relationship between learning styles, motivation to transfer of learning in a vocational training programme” Suma Psicológica, 23(1), 25–32, 2016. http://doi.org/10.1016/j.sumpsi.2016.02.001
- A. Viloria, J. R. López, K. Payares, C. Vargas-Mercado, S. E. Duran, H. Hernández-Palma, M. A. David, “Determinating Student Interactions in a Virtual Learning Environment Using Data Mining” Procedia Comput. Sci., 155, 587–592, 2019. http://doi.org/10.1016/j.procs.2019.08.082
- A. I. Adekitan, O. Salau, “The impact of engineering students’ performance in the first three years on their graduation result using educational data mining” Heliyon, 5(2), 2019. http://doi.org/10.1016/j.heliyon.2019.e01250
- P. Nuankaew, W. Nuankaew, T. Thamma, “The Recommended System for the Relationship between Educational Programs, Students’ Interests” in International Conference on Digital Arts, Media, Technology, 2-3. 2016
- P. Nuankaew, W. Nuankaew, K. Phanniphong, S. Imwut, S. Bussaman, “Students Model in Different Learning Styles of Academic Achievement at the University of Phayao, Thailand” Int. J. Emerg. Technol. Learn. IJET, 14(12), 133–157, 2019.
- D. P. Cantwell, L. Baker, “Association between attention deficit-hyperactivity disorder, learning disorders” J. Learn. Disabil., 24(2), 88–95, 1991.
- P. N. Pastor, C. A. “Reuben, Diagnosed Attention Deficit Hyperactivity Disorder and Learning Disability: United States, 2004-2006. Data from the National Health Interview Survey” Vital and Health Statistics 10(237), 1-14, 2008
- M. Salehan, A. Negahban, “Social networking on smartphones: When mobile phones become addictive” Comput. Hum. Behav., 29(6), 2632–2639, 2013. http://doi.org/10.1016/j.chb.2013.07.003
- R. Tao, X. Huang, J. Wang, H. Zhang, Y. Zhang, M. Li, “Proposed diagnostic criteria for internet addiction” Addiction, 105(3), 556–564, 2010. http://doi.org/10.1111/j.1360-0443.2009.02828.x
- A. Biachnio, A. Przepiorka, “Personality, positive orientation in Internet, Facebook addiction. An empirical report from Poland” Comput. Hum. Behav., 59, 230–236, 2016. http://doi.org/10.1016/j.chb.2016.02.018
- S. K. Sharma, A. Joshi, H. Sharma, “A multi-analytical approach to predict the Facebook usage in higher education” Comput. Hum. Behav., 55, 340–353, 2016. http://doi.org/10.1016/j.chb.2015.09.020
- M. Ozkan, B. Solmaz, “Mobile Addiction of Generation Z, its Effects on their Social Lifes: (An Application among University Students in the 18-23 Age Group)” Procedia – Soc. Behav. Sci., 205, 92–98, Oct. 2015. http://doi.org/10.1016/j.sbspro.2015.09.027
- W. S. Nuankaew, P. Nuankaew, D. Teeraputon, K. Phanniphong, S. Bussaman, “Perception, Attitude Toward Self-Regulated Learning of Thailand’s Students in Educational Data Mining Perspective” Int. J. Emerg. Technol. Learn. IJET, 14(09), 2019.
- P. J. Gaskill, A. Woolfolk Hoy, “Self-efficacy and self-regulated learning: The dynamic duo in school performance. In J. Aronson (Ed.)” Improving academic achievement: Impact of psychological factors on education, 185–208, 2002. https://doi.org/10.1016/B978-012064455-1/50012-9
- B. J. Zimmerman, “Models of self-regulated learning, academic achievement” Self-regulated learning, academic achievement, Springer, 1–25, 1989.
- P. R. Pintrich, “Understanding self-regulated learning” New Dir. Teach. Learn., 63, 3–12, 1995.
- H. C. Schmitz, A. Mikroyannidis, T. Connolly, L. C. E. Law, H. Vieritz, A. Nussbaumer, M. Berthold, C. Ullrich, A. Dhir, “Self–regulated learning in formal education: perceptions, challenges, opportunities” Int. J. Technol. Enhanc. Learn., 6(2), 145–163, 2014.
- P. Nuankaew, W. Nuankaew, S. Bussaman, P. Jedeejit, “Education mining in the relationship between general knowledge, deep knowledge for lifelong learning” in 2017 14th International Conference on Electrical Engineering/Electronics, Computer, Telecommunications, Information Technology (ECTI-CON), 694–697, 2017. http://doi.org/10.1109/ECTICon.2017.8096333
- P. Nuankaew, “Dropout Situation of Business Computer Students, University of Phayao” Int. J. Emerg. Technol. Learn. IJET, 14(19), 2019.
- K. Pupara, W. Nuankaew, P. Nuankaew, “An institution recommender system based on student context, educational institution in a mobile environment” in 2016 International Computer Science, Engineering Conference (ICSEC), 1–6, 2016. http://doi.org/10.1109/ICSEC.2016.7859877
- S. Bussaman, W. Nuankaew, P. Nuankaew, N. Rachata, K. Phanniphong, P. Jedeejit, “Prediction models of learning strategies, learning achievement for lifelong learning” in 2017 IEEE 6th International Conference on Teaching, Assessment, Learning for Engineering (TALE), 192–197, 2017. http://doi.org/10.1109/TALE.2017.8252332
- P. Nuankaew, W. Nuankaew, P. Temdee, “Institution recommendation using relationship optimisation between program, student context” Int. J. High. Educ. Sustain., 2(4), 279–302, 2019.
- P. Nuankaew, W. Nuankaew, T. Thamma, “The Recommended System for the Relationship between Educational Programs, Stu-dents’ Interests” in International Conference on Digital Arts, Media, Technology, 2-3, 2016.
- R. Wirth, J. Hipp, “CRISP-DM: Towards a standard process model for data mining” in Proceedings of the 4th International Conference on the Practical Applications of Knowledge Discovery, Data Mining, 29–39, 2000.
- J. Venter, A. de Waal, C. Willers, “Specializing CRISP-DM for Evidence Mining” in Advances in Digital Forensics III, New York, USA, 303–315, 2007.
- B. L. McCombs, “Self-regulated learning, academic achievement: A phenomenological view” Self-regulated learning, academic achievement, Springer, 51–82, 1989.
- B. J. Zimmerman, “Self-regulated learning, academic achievement: An overview” Educ. Psychol., 25(1), 3–17, 1990.
- B. J. Zimmerman, D. H. Schunk, “Self-regulated learning, academic achievement: Theoretical perspectives” Routledge, 2001.
- B. J. Zimmerman, “Becoming a self-regulated learner: An overview” Theory Pract., 41(2), 64–70, 2002.
- E. Shahzadi, Z. Ahmad, “A study on academic performance of university students” Recent Adv. Stat., 255, 2011.
- P. Nuankaew, P. Temdee, “Matching of compatible different attributes for compatibility of members, groups” Int. J. Mob. Learn. Organ., 13(1), 4–29, 2019.
- P. Nuankaew, P. Temdee, “Determining of compatible different attributes for online mentoring model” in 2014 4th International Conference on Wireless Communications, Vehicular Technology, Information Theory, Aerospace & Electronic Systems (VITAE), 1–5, 2014.
- P. Nuankaew, W. Nuankaew, K. Phanniphong, R. Fooprateepsiri, S. Bussaman, “Analysis Dropout Situation of Business Computer Students at University of Phayao” in The Impact of the 4th Industrial Revolution on Engineering Education, Cham, 2020, 419–432. http://10.1007/978-3-030-40274-7_42
- A. M. Shahiri, W. Husain, N. A. Rashid, “A Review on Predicting Student’s Performance Using Data Mining Techniques” Procedia Comput. Sci., 72, 414–422, 2015. http://doi.org/10.1016/j.procs.2015.12.157
- W. Nuankaew, P. Nuankaew, “The Study of the Factors, Development of Educational Model: The Relationship between the Learner Context, the Curriculum Context in Higher Education” Int. J. Emerg. Technol. Learn. IJET, 14(21), 2019.
- N. B. Ahmad, U. F. Alias, N. Mohamad, N. Yusof, “Principal Component Analysis, Self-Organizing Map Clustering for Student Browsing Behaviour Analysis” Procedia Comput. Sci., 163, 550–559, 2019. http://doi.org/10.1016/j.procs.2019.12.137
- A. B. Firdausiah Mansur, N. Yusof, A. H. Basori, “Personalized Learning Model based on Deep Learning Algorithm for Student Behaviour Analytic” Procedia Comput. Sci., 163, 125–133, 2019. http://doi.org/10.1016/j.procs.2019.12.094
- E. Aronson, “Chapter 10 – Building Empathy, Compassion, Achievement in the Jigsaw Classroom” Improving Academic Achievement, J. Aronson, Ed. San Diego: Academic Press, 209–225, 2002.
- K. Pupara, W. Nuankaew, P. Nuankaew, “An institution recommender system based on student context, educational institution in a mobile environment” in 2016 International Computer Science, Engineering Conference (ICSEC), 1–6, 2016.
- J. A. Meirink, P. C. Meijer, N. Verloop, T. C. Bergen, “Understanding teacher learning in secondary education: The relations of teacher activities to changed beliefs about teaching, learning” Teach. Teach. Educ., 25(1), 89–100, 2009.
- G. Hampden-Thompson, J. Bennett, “Science teaching, learning activities, students’ engagement in science” Int. J. Sci. Educ., 35(8, 1325–1343, 2013.
- W. Nuankaew, P. Nuankaew, S. Bussaman, P. Tanasirathum, “Hidden academic relationship between academic achievement, higher education institutions” in 2017 International Conference on Digital Arts, Media, Technology (ICDAMT), 308–313, 2017. http://doi.org/10.1109/ICDAMT.2017.7904982
- C. Romero, S. Ventura, “Educational data mining: a review of the state of the art” IEEE Trans. Syst. Man Cybern. Part C Appl. Rev., 40(6), 601–618, 2010.
- S. K. Mohamad, Z. Tasir, “Educational data mining: A review” Procedia-Soc. Behav. Sci., 97(2013), 320–324, 2013.
- S. Slater, S. Joksimovic, V. Kovanovic, R. S. Baker, D. Gasevic, “Tools for educational data mining: A review” J. Educ. Behav. Stat., 42(1), 85–106, 2017.
- P. Chapman, J. Clinton, R. Kerber, T. Khabaza, Reinartz, T., C. Shearer, R. Wirth, “CRISP-DM 1.0 Step-by-step data mining guide” SPSS inc, 9, 13, 2000.