
Correlation-Based Incremental Learning Network for Gas Sensors Drift Compensation Classification
Volume 5, Issue 4, Page No 660-666, 2020
Author’s Name: Panida Lorwongtrakool1,a), Phayung Meesad2
View Affiliations
1Department of Information Technology, Faculty of Information Technology and Digital Innovation, King Mongkut’s University of Technology, North Bangkok, 10800, Thailand
2Department of Information Technology Management, Faculty of Information Technology and Digital Innovation, King Mongkut’s University of Technology, North Bangkok, 10800, Thailand
a)Author to whom correspondence should be addressed. E-mail: panida.l@email.kmutnb.ac.th
Adv. Sci. Technol. Eng. Syst. J. 5(4), 660-666 (2020); ![]() DOI: 10.25046/aj050479
DOI: 10.25046/aj050479
Keywords: Classification, Correlation Distance, Gas Sensor, Incremental Learning, Radial Basis Function

Export Citations
A gas sensor array is used for gas analysis to aid in an inspection. The signals from the sensor array are fed into machine learning models for learning and classification. These signals are characterized by time series fluctuating according to the environment or drift. When an unseen pattern is entered, the classification may be incorrect, resulting in decreased model performance. Creating a new model results in the problem of forgetting the old knowledge called Catastrophic Forgetting. Accordingly, this research proposes Correlation-Based Incremental Learning Network (CILN) using the Correlation Distance method to measure similarity and the Gaussian membership function to determine membership of each node. The gas sensor array data is used to verify the proposed algorithm by choosing 16 steady-state features (DR) from 13,910 records which are divided into 6 classes: 1) Ethanol, 2) Ethylene, 3) Ammonia, 4) Acetaldehyde, 5) Acetone, and 6) Toluene. The data are normalized and divided as the training sets into 10%, 20%, 30%, 40%, and 50%, respectively. The proposed algorithm was compared with well-known classifiers. CILN experiment results yield the highest accuracy of 98.96% using 50% of the training data set. It shows that CILN has the incremental learning ability and can be used with data that fluctuate according to the situation.
Received: 19 June 2020, Accepted: 04 August 2020, Published Online: 25 August 2020
1. Introduction
The odor inspection, such as food quality check, environmental perfume check, chemical leak check or even weapons or drugs inspection require experts. However, there are limitations of smelling by human nose, and the effectiveness of smelling depends on individual health. Humans may feel tired, and importantly, the human nose is not suitable for smelling various toxins [1].
Many researchers have tried to devise a variety of inspection methods, such as chemical properties or flavor tests, and these methods require direct contact. Another interesting method is to test odors or gases using an electronic nose or array sensor since this method does not require immersion into the sample but inspect the gas response. Currently, the array sensor is extensively used for inspections, such as potential contagious or chemical contamination inspection during the production process, checking the freshness of pork [2], fungus inspection in strawberries [3], evaluating the quality of black tea [4], identify the type of wine and chinese liquor [5], distinguishing wine making techniques, [6] and medical diagnoses [7-8].
Machine learning is a useful tool for data analysis and data learning. Machine learning is divided into 2 approaches: Batch Learning and Incremental Learning. 1) Batch learning refers to a learning method which learn data at once. 2) Incremental learning (also called online learning) refers to learning methods which is applied to streaming collected over time. In this method, learning functions can be updated when new data is entered into the system [9].
In the real world, input data can be dynamic or streaming depending on the situation or environment, as data change or drift. Therefore, if the model is unable to learn new patterns, the performance of the model will be reduce [4]. Finally, all earlier data sets will no longer be available, and a new model must be created when there are new data. This process also leads to a phenomenon known as catastrophic forgetting [10].
Therefore, to improve the algorithm for learning latest information while keeping the old knowledge of earlier data sets, this research proposes Correlation-Based Incremental Learning (CILN). The proposed algorithm can learn new patterns and adapt itself automatically while keeping existing knowledge.
2. Literature Reviews
2.1. Gas Sensor array
The gas sensor array is important to the electronic nose and is used to detect gas molecules from electrical signals. Each sensor has a different sensitivity to gas. When the gas sensor contact with gas molecules, it responds to the gas, forming a spectrum of different gases called odor fingerprint. The response is recorded and sent to the signal processing system for analysis using proper analysis methods to determine the type of gas [11].
2.2. Incremental Learning
In general, creating a model for classification requires a training set for patterns recognition. When the model has an acceptable performance, it will be used for prediction. However, the general limitation of the model is that it will work well for a period only and, inevitably, a new model needs to be created because the algorithm is not created for incremental learning. Therefore, it is extremely sensitive to continuous data in the form of streaming. A new model needs to be created to solve this problem, and it is unable to use the existing knowledge.
In addition, data in the new situation are still a problem, and there is a need to incremental learning capability [12] by gradually learning knowledge without abandoning or forgetting the existing one without retraining. To solve this problem, incremental learning algorithms must be able to combine new knowledge with previously bought knowledge in a way like human learning methods which are based on earlier learning [13].
Therefore, algorithms that can learn from new data without having to access the earlier set of data and support prior knowledge would be a good method of classification to support both static data and data stream, especially when new data samples are added continuously.
1) Characteristics of Incremental learning
- Incremental learning algorithms handle with continuous data and non-stationary distributions.
- It adapts to new data without forgetting the existing knowledge; it does not need to retrain.
- It is compatible with data streams or big data to create machine learning models faster.
- It uses instance windows or instance weighting mechanism without making modifications to the algorithms. New models are calculated based on time periods of using windows or weights by considering new data received.
- All or some parts of the data are used to create an initial model, check for changes in data (using the detection function), and rebuild models as needed based on new data.
- It can automatically change the learning mechanism to increasingly learn new data. For example, the weights of an artificial neural network are adjusted every time there is a new pattern coming into the system.
2) Types of Incremental Learning
- Instance-incremental learning refers to the system that receives data at Step- the input point , where represents the input domain in n dimensional space and predicts the output . The output, Y, can be either continuous in regression or in classification in one dimensional space.
- Batch incremental learning receive batches of data and must specify the label for each input point, where is the number of data points.
Traditional Artificial Neural Networks (ANNs) work well in jobs with static data, where there is no incremental learning needed. Adding new capabilities to ANNs often results in catastrophic forgetting [10]. Therefore, researchers have attempted to solve this problem. In [14] developed a hybrid system including supervised learning and unsupervised learning online by using Fuzzy and Neural Networks together with Euclidean distance.
In addition, learning algorithms have been developed based on Support Vector Machine (SVM) together with Mahalanobis distance which is an elliptical kernel method for multidimensional data. The ability to classify data was compared with the traditional method using Euclidean distance, and no difference was found [15]. However, scattering of data should be considered when adopting the similarity measurement method.
Using threshold is another way to help learning, adjust the model, and support the integrity of earlier knowledge, while only adding a small number of parameters [16]. The important for a creating an incremental learning model is that it must be done quickly by using a small amount of data and gradually adjusting the model according to the new data while keeping old knowledge without access to the initial training data set [17].
However, it was found that the attempt to improve the recognition system for greater accuracy often result in more complex problems. Hence, Incremental Similarity (IS) has been presented, as it yields high accuracy and low complexity. Incremental Similarity is used for incremental online learning. The system can learn from sample data received, and only some parameters need to be updated. It was found that the efficiency of Incremental Similarity was higher than that of the traditional model [18].
At present, deep learning has received great attention, and it has been used in recognition, such as face recognition. However, the face recognition model without incremental learning after training results in problems with new data during the operation. In [19] introduced the Incremental SVM method that allowed the system to update the classification model in real-time, resulting in the increased accuracy of the system and reduced training time.
However, deep learning processing consists of many connected parameters, and it takes quite a lot of time in the training process, as well as retraining if the structure is not enough. Adding incremental learning capabilities to the system with deep learning can be quite difficult. Therefore, researchers have attempted to invent and adjust the Broad Learning System (BLS) [20] which was created in the form of a flat network where the input is transferred and mapped into feature node. Then, the structure will be expanded broadly to add nodes. The incremental learning algorithm has been developed for rapid change without retraining.
The shallow learning network is more suitable for incremental learning than the deep learning network. It was also found that Radial Basis Function (RBF) is used in incremental learning and is combined with other techniques, such as Neuro-Fuzzy [14]. In addition to RBF, SVM is combined with Mahalanobis distance [15], and Self Organizing Map (SOM) is combined with Euclidean distance [21]. The popular methods used to similarity measure are Euclidean distance and Mahalanobis distance. The Euclidean distance is simple but limited because it is sensitive to scales of variables and suitable for data scattered in circles. The Mahalanobis distance is suitable for elliptically scattered data by considering the covariance matrix to solve the problem of Euclidean distance. Therefore, the similarity measure should be selected based on data scattering. Another interesting similarity measurement method is Correlation distance, as it considers the relationship of variables and is suitable for continuous data. In this research, the researchers proposed incremental learning with Correlation distance, which is a way of measuring similarity to support data that change according to the environment.
2.3. Radial Basis Function
Radial Basis Function is a feed forward neural network with only 1 hidden layer. RBF does not have a complicated structure and is more flexible and faster than Multilayer Perceptron (MLP) architecture, each kernel function is connected to hidden nodes which means the connection to one cluster. Incremental learning by increasing hidden nodes and updating weight and relevant parameters [4]. The norm value between two data points can be calculated by using the general calculation formulas, such as Euclidean distance, Mahalanobis distance, Correlation distance or others as shown in Figure 1.
 Figure 1: The Architecture of RBF
2.4. Correlation Distance
Correlation distance is a statistical measure used to measure the independence of two values or any two vectors. Correlation distance values are between 0 and 1, which can be measured by the variance or standard deviation. It can be calculated according to (1).
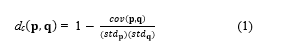
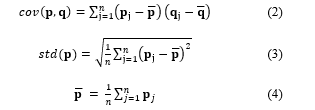 where dc is correlation distance from to ; p and q are any data points and n is number of dimension.
3. Method
The objective of this research is to propose the Correlation-Based Incremental Learning Network by using the Correlation Distance and membership function. The operational structure of CILN, as shown in Figure 2.
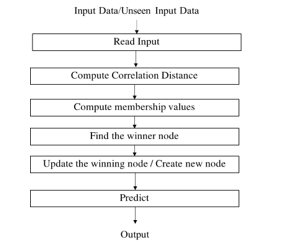 Figure 2: Operational Structure of CILN
Step 1) Set the membership threshold parameter (mth) for determining new neuron, where mth is a value between 0 and 1.
Step 2) Read input data
- Read in a pair of an input pattern p and target t.
- If new knowledge is found set a new neuron WP using p and WT according target t of the input pattern in WP.
Step 3) Read in the next input pattern and its corresponding target, if any.
Step 4) Measure the Correlation distance between the input p and the prototype WP, which are centroids using (5).
![]() Step 5) Compute membership values of each node using the Gaussian-type radial basis function.
Step 5) Compute membership values of each node using the Gaussian-type radial basis function.
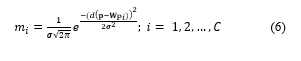 where is membership value, and is Standard Deviation in cluster . will be used to show the scatter of the data in the cluster. value between 0.001 and 0.05 and after the patterns near the prototype are included in the same prototype, the standard deviation is updated accordingly.
Step 6) Find the winner node that has highest membership value [14].
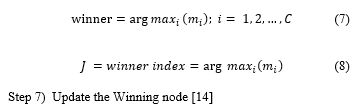 Step 7) Update the Winning node [14]
If mth, the instance is similarity to the winning node, then update weight of the winning node.
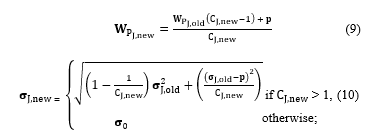 if > 1, (10)
where is new weight, is original weight, is latest input data , and is number of members in the cluster.
If winner mth, the instance is considered node a member of the winning node; then a new node WT is created.
Step8) If in prediction mode, i.e. no target, assign the predicted class to the unseen pattern.
![]() where y is predicted class, is target of the Winner.
where y is predicted class, is target of the Winner.
If in training mode, i.e. there is target of the input p, compute error.
![]() where e is error, t is target, and y is output.
where e is error, t is target, and y is output.
Step 9) Continue process to step 3, until stop condition is met.
4. Experimental Results
4.1. Experimental Data
The data set used in the experiment is the gas sensor data set obtained from the UCI Machine Learning Repository [22]. This data set includes measurements using 16 chemical sensors to measure the gas response at different concentrations. The data set consists of 16 attributes with a total of 13,910 records. This data set has been collected for 36 months from January 2008 to February 2011. The data set was collected from 6 types of pure gas: 1) Ethanol, 2) Ethylene, 3) Ammonia, 4) Acetaldehyde, 5) Acetone, and 6) Toluene. Each gas has added characteristics extracted with different values, making each sensor have 8 features. Therefore, the data set consists of 128 features and is divided into 10 batches in time sequence. The details are shown in Table 1.
The response of the said sensor is read in the form of resistance. Each measurement creates a 16-channel time series data set that responds to the chemicals being measured. In the experiment, the steady-state feature (DR), was selected which means the maximum resistance change compared to the base line.
The signals from 16 sensors showed the characteristics of data consisting of Multivariate Time-series. Since the data in each batch were collected several times, and each batch has a different number of classes (Imbalance class). Therefore, the data obtained are at different concentrations as shown in Figure 3.
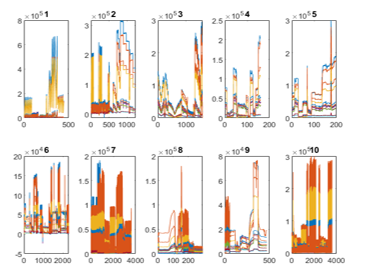 Figure 3: Gas Sensor Array Drift at Different Concentrations Data Set
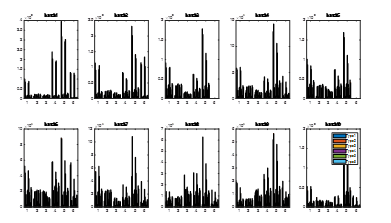 Figure 4: The Odor’s Fingerprint of Gas Sensor Drift Compensation Data Set
Table 1: Experimental data
| Batch ID | Month | Acetone | Acetaldehyde | Ethanol | Ethylene | Ammonia | Toluene | Total |
| Batch 1 | 1, 2 | 90 | 98 | 83 | 30 | 70 | 74 | 445 |
| Batch 2 | 3-10 | 164 | 334 | 100 | 109 | 532 | 5 | 1,244 |
| Batch 3 | 11, 12, 13 | 365 | 490 | 216 | 240 | 275 | 0 | 1,586 |
| Batch 4 | 14, 15 | 64 | 43 | 12 | 30 | 12 | 0 | 161 |
| Batch 5 | 16 | 28 | 40 | 20 | 46 | 63 | 0 | 1997 |
| Batch 6 | 17, 18, 19, 20 | 514 | 574 | 110 | 29 | 606 | 467 | 2,300 |
| Batch 7 | 21 | 649 | 662 | 360 | 744 | 630 | 568 | 3,613 |
| Batch 8 | 22, 23 | 30 | 30 | 40 | 33 | 143 | 18 | 294 |
| Batch 9 | 24, 30 | 61 | 55 | 100 | 75 | 78 | 101 | 470 |
| Batch 10 | 36 | 600 | 600 | 600 | 600 | 600 | 600 | 3,600 |
The characteristic response spectrum is called odor’s fingerprint. Therefore, according to the characteristics of response spectrum, different odors can be distinguished showing the fingerprint of each gas type at various times of each batch, as shown in Figure 4.
4.2. Experimental Setting
To evaluate the effectiveness of the proposed CILN, we selected only 16 steady-state (DR) features that have not been extracted from a total of 128 features. Therefore, the data set has 13,910 records, divided into 6 classes: 1) Ethanol, 2) Ethylene, 3) Ammonia, 4) Acetaldehyde, 5) Acetone, and 6) Toluene. The data were normalized and split into training sets and test sets. The training sets were randomly selected for 10%, 20%, 30%, 40%, and 50%; the rest of the data were used for test sets. The proposed CILN algorithm, which uses Correlation distance measurement, was compared with Euclidean distance and Mahalanobis distance measurement, as well as other well-known classifiers, including NaiveBayes, BayesNet, RBF, SVM, MLP, and Simple Logistics. Comparison of experimental results by Accuracy, Precision, Recall, F-Measure. The experiment steps are shown in Figure 5.
 Figure 5: Experimental Steps
4.3. Experimental Results
The experimental results under certain settings show the comparison of the efficiency of the proposed CILN algorithm which uses Correlation distance measurement method and the incremental learning algorithm which uses Euclidean distance and Mahalanobis distance measurement methods. According to Table 2, CILN yielded top 5 accuracy scores: 98.96%, 98.74%, 98.51%, 97.87% and 96.08% by using 50%, 40%, 30%, 20%, and 10% of the training sets, respectively. Considering all the 3 measurement methods, Correlation distance method gave the highest mean of 98.03%, followed by Euclidean distance method of 93.16% and Mahalanobis distance method of 93.10%. Euclidean distance and Mahalanobis distance methods supply similar accuracy, while Correlation distance method gives a high accuracy. Therefore, the similarity measurement method affects accuracy, and the proposed method is suitable for the gas sensor array drift at different concentrations data set which contains continuous data.
Table 2: Comparison the performance of incremental learning using different similarity measurement methods.
| Similarity Measure |
Training (%) |
Accuracy (%) |
Precision
|
Recall
|
F-Measure
|
| Correlation distance | 10 | 96.08 | 0.85 | 0.96 | 0.90 |
| 20 | 97.87 | 0.90 | 0.99 | 0.94 | |
| 30 | 98.51 | 0.94 | 0.98 | 0.96 | |
| 40 | 98.74 | 0.94 | 0.99 | 0.97 | |
| 50 | 98.96 | 0.95 | 0.99 | 0.97 | |
| Average | 98.03 | 0.92 | 0.98 | 0.95 | |
| Euclidean distance | 10 | 90.13 | 0.69 | 0.84 | 0.76 |
| 20 | 92.44 | 0.74 | 0.91 | 0.82 | |
| 30 | 93.75 | 0.77 | 0.93 | 0.85 | |
| 40 | 93.82 | 0.79 | 0.91 | 0.84 | |
| 50 | 95.64 | 0.84 | 0.94 | 0.89 | |
| Average | 93.16 | 0.77 | 0.91 | 0.83 | |
| Mahalanobis distance | 10 | 87.86 | 0.63 | 0.85 | 0.72 |
| 20 | 93.22 | 0.75 | 0.95 | 0.84 | |
| 30 | 94.38 | 0.80 | 0.94 | 0.86 | |
| 40 | 94.36 | 0.79 | 0.94 | 0.86 | |
| 50 | 95.64 | 0.85 | 0.94 | 0.89 | |
| Average | 93.10 | 0.76 | 0.92 | 0.83 |
Table 3: Comparison of Performance with well-known classifiers
| Algorithm |
Training (%) |
Accuracy (%) |
Precision
|
Recall
|
F-Measure
|
| CILN | 10 | 96.08 | 0.85 | 0.96 | 0.90 |
| 20 | 97.87 | 0.90 | 0.99 | 0.94 | |
| 30 | 98.51 | 0.94 | 0.98 | 0.96 | |
| 40 | 98.74 | 0.94 | 0.99 | 0.97 | |
| 50 | 98.96 | 0.95 | 0.99 | 0.97 | |
| Simple Logistics | 10 | 93.52 | 0.94 | 0.94 | 0.94 |
| 20 | 93.66 | 0.94 | 0.94 | 0.94 | |
| 30 | 95.48 | 0.96 | 0.96 | 0.96 | |
| 40 | 95.70 | 0.96 | 0.96 | 0.96 | |
| 50 | 96.05 | 0.96 | 0.96 | 0.96 | |
| MLP | 10 | 91.37 | 0.92 | 0.91 | 0.91 |
| 20 | 93.37 | 0.94 | 0.93 | 0.94 | |
| 30 | 94.64 | 0.95 | 0.95 | 0.95 | |
| 40 | 94.42 | 0.95 | 0.94 | 0.95 | |
| 50 | 95.64 | 0.96 | 0.96 | 0.96 | |
|
SVM |
10 | 70.71 | 0.80 | 0.71 | 0.71 |
| 20 | 76.23 | 0.85 | 0.76 | 0.78 | |
| 30 | 79.48 | 0.87 | 0.80 | 0.81 | |
| 40 | 82.19 | 0.88 | 0.82 | 0.84 | |
| 50 | 83.89 | 0.89 | 0.84 | 0.85 | |
| BayesNet | 10 | 59.41 | 0.65 | 0.59 | 0.60 |
| 20 | 65.05 | 0.69 | 0.65 | 0.66 | |
| 30 | 65.27 | 0.69 | 0.65 | 0.66 | |
| 40 | 66.30 | 0.70 | 0.66 | 0.67 | |
| 50 | 66.48 | 0.70 | 0.67 | 0.67 | |
| RBF | 10 | 64.29 | 0.67 | 0.64 | 0.64 |
| 20 | 61.94 | 0.65 | 0.62 | 0.60 | |
| 30 | 63.09 | 0.67 | 0.63 | 0.61 | |
| 40 | 62.73 | 0.66 | 0.63 | 0.61 | |
| 50 | 62.78 | 0.66 | 0.63 | 0.61 | |
| NaiveBayes | 10 | 51.56 | 0.60 | 0.52 | 0.52 |
| 20 | 51.24 | 0.60 | 0.51 | 0.52 | |
| 30 | 51.43 | 0.61 | 0.51 | 0.52 | |
| 40 | 51.72 | 0.61 | 0.52 | 0.53 | |
| 50 | 51.45 | 0.60 | 0.52 | 0.52 |
Table 3 shows the comparison of the performance of the proposed CILN algorithm with the well-known classifiers, such as NaiveBayes, BayesNet, RBF, SVM, MLP, and Simple Logistics. Overall, CILN still yielded the highest accuracy of 98.96%, Simple Logistics of 96.05%, MLP of 95.64%, SVM of 83.89%, BayesNet of 66.48%, RBF of 64.29%, and NaiveBayes of 51.72% by using 50%, 50%, 50%, 50%, 50%, 10%, and 40% of the training sets, respectively. It was found that the number of training data sets can affect the accuracy. However, new data entered the classifiers may change according to the environment. Without incremental learning, it will also affect accuracy. Therefore, the algorithm should have incremental learning ability for effective classification.
5. Conclusions and Future Work
Machine learning is a useful tool for analysis and learning. However, data imported into the system are both static data and dynamic data which fluctuate and change according to the environment. Conventional algorithms still lacks incremental learning new data. When new data are added, the algorithm will not be able to learn and adapt, resulting in reduced efficiency. Moreover, all the trained data sets are no longer available, and a new model needs to be created for new data. This process leads to a phenomenon known as catastrophic forgetting, resulting in poor classification performance. Therefore, to solve this problem, this research has proposed Correlation-Based Incremental Learning algorithm that allows the model to learn and improve automatically while maintaining old knowledge using the Correlation distance to measure similarities and membership functions using Gaussian-type Radial Basis Function to determine membership of each node.
Gas sensor data from the UCI machine learning repositories used to evaluate the performance of the proposed algorithm. This data set holds 13,910 measurements from 16 chemical sensors exposed to 6 gases at different concentration levels. This data set has been collected for 36 months from January 2008 to February 2011. The data were collected from 6 types of pure gas: 1) Ethanol, 2) Ethylene, 3) Ammonia, 4) Acetaldehyde, 5) Acetone, and 6) Toluene. In the experiment, only 16 steady-state features (DR) were chosen. The data were normalized and split into training sets and test sets. The training sets were randomly selected for 10%, 20%, 30%, 40%, and 50%; the rest of the data were used for test sets.
The results show that CILN allows the system to learn new patterns while maintaining the old knowledge. The proposed CILN algorithm supplies an initial accuracy of 96.08% by using only the 10% of the training data set which is higher than all classifiers. In addition, CILN yields the highest accuracy of 98.96% when 50% of the training data set was used. It shows that CILN can learn from a small sample size and can adapt and learn new data automatically while keeping the existing knowledge. Therefore, CILN can increase the accuracy of classification and support the time series data which are dynamic data and can be used for environmental or other inspections. Moreover, it was found that using only 16 steady-state features (DR) was sufficient for gas classification without additional feature extraction. In the future work, we will consider reducing the dimensions of data by selecting features, removing noise, and selecting the proper signal range.
Conflict of Interest
The authors declare no conflict of interest.
Acknowledgment
We would like to gratefully acknowledge the King Mongkut’s University of Technology North Bangkok and Rajamangala University of Technology Isan.
- A. Loutfi, S. Coradeschi, G. K. Mani, P. Shankar, J.B.B. Rayappan, “Electronic noses for food quality: A review” Journal of Food Engineering, 144, 103-111, 2015. http://dx.doi.org/10.1016/j.jfoodeng.2014.07.019
- L. Huang, J. Zhao, Q. Chen, Y. Zhang, “Nondestructive measurement of total volatile basic nitrogen (TVB-N) in pork meat by integrating near infrared spectroscopy” computer vision and electronic nose techniques Food Chemistry, 145, 228-236, 2014. http://dx.doi.org/10.1016/j.foodchem.2013.06.073
- L. Pan, W. Zhang, N. Zhu, S. Mao, K. Tu, “Early detection and classification of pathogenic fungal disease in post-harvest strawberry fruit by electronic nose and gas chromatography–mass spectrometry” Food Research International, 62, 162-168, 2014. http://dx.doi.org/10.1016/j.foodres.2014.02.020
- B. Tudu, A. Jana, A. Metla, D. Glosh, N. Bhattacharyya, “Electronic nose for black tea quality evaluation by an incremental RBF network” Sensors and Actuators B: Chemical, 138(1), 90-95, 2009. http://dx.doi.org/10.1016/j.snb.2009.02.025
- Y. Yang, H. Liu, Y. Gu, “A Model Transfer Learning Framework With Back-Propagation Neural Network for Wine and Chinese Liquor Detection by Electronic Nose” IEEE Access, 8, 105278-105285, 2020. https//doi.org/10.1109/ACCESS.2020.2999591
- M. Aleixandre, J. P. Santos, I. Sayago, M. C. Horrillo, J. M. Cabellos, T. Arroyo, “Use of an electronic nose as a tool to differentiate winemaking techniques” in 2015 10th Spanish Conference on Electron Devices (CDE), Madrid, Spain, 2015. https//doi.org/10.1109/CDE.2015.7087490
- B. Schmekel, F. Winquist, A. Vikström, “Analysis of breath samples for lung cancer survival” Analytica Chimica Acta, 840, 82-86, 2014. https://doi.org/10.1016/j.aca.2014.05.034
- E. Westenbrink, R.P. Arasaradnam, N. O’Connell, C. Bailey, C. Nwokolo, K.D. Bardhan, J.A. Covington, “Development and application of a new electronic nose instrument for the detection of colorectal cancer” Biosensors and Bioelectronics, 67, 733-738. 2015. http://dx.doi.org/10.1016/j.bios.2014.10.044
- Q. Wu, D. Snell, “An Introduction to Incremental Learning” Predictive Analytics and Futurism, 13, 18-19, 2016.
- R. M. French, “Catastrophic forgetting in connectionist networks” Trends in Cognitive Sciences, 3(4), 128-135, 1999. http://dx.doi.org/10.1016/S1364-6613(99)01294-2
- Z. Zheng, X. Lin, “Study on Application of Medical Diagnosis by Electronic Nose” World Science and Technology, 14(6), 2115-2119. 2012. http://dx.doi.org/10.1016/S1876-3553(13)60016-2
- V. Losing, B. Hammer, H. Wersing, “Incremental on-line learning: A review and comparison of state of the art algorithms” Neurocomputing, 275, 1261-1274, 2018. https://doi.org/10.1016/j.neucom.2017.06.084
- S. Wan, and L.E. Banta, “Parameter Incremental Learning Algorithm for Neural Networks” IEEE Transactions on Neural Networks, 17(6), 1424-1438, 2006. https://doi.org/10.1016/j.neucom.2017.06.084
- G. G. Yen, P. Meesad, “An effective neuro-fuzzy paradigm for machinery condition health monitoring” IEEE Transactions on Systems, Man, and Cybernetics, Part B (Cybernetics), 31(4), 523-536. 2001. https://doi.org/10.1109/3477.938258
- H. O. Myint, P. Meesad, “Incremental Learning Algorithm based on Support Vector Machine with Mahalanobis distance (ISVMM) for intrusion prevention” in 2009 6th International Conference on Electrical Engineering/Electronics, Computer, Telecommunications and Information Technology. Pattaya, Chonburi, Thailand, 2009. https://doi.org/10.1109/ECTICON.2009.5137129
- Y. Pang, J. Deng, Y. Yuan, “Incremental threshold learning for classifier selection” Neurocomputing, 89, 89-95, 2012. https://doi.org/10.1016/j.neucom.2012.01.012
- K. Diaz-Chito, K. Georgouli, A. Koidis, J. M. del Rincon, “Incremental model learning for spectroscopy-based food analysis” Chemometrics and Intelligent Laboratory Systems. 167, 123-131, 2017. https://doi.org/10.1016/j.chemolab.2017.06.002
- M. Režnáková, L. Tencer, M. Cheriet, “Incremental Similarity for real-time on-line incremental learning systems” Pattern Recognition Letters 74, 61-67, 2016. https://doi.org/10.1016/j.patrec.2016.01.010
- L. Li, Z. Jun, J. Fei, S. Li, “An incremental face recognition system based on deep learning” in 2017 15th IAPR International Conference on Machine Vision Applications (MVA), Nagoya, Japan, 2017. https://doi.org/10.23919/MVA.2017.7986845
- C. L. P. Chen and Z. Liu, “Broad Learning System: An Effective and Efficient Incremental Learning System Without the Need for Deep Architecture” IEEE Transactions on Neural Networks and Learning Systems, 29(1), 10-24, 2018. https://doi.org/10.1109/TNNLS.2017.2716952
- L. Tian and W. Liu, “Incremental intrusion detecting method based on SOM/RBF” in 2010 International Conference on Machine Learning and Cybernetics. Qingdao, China, 2010. https://doi.org/10.1109/ICMLC.2010.5580770
- A. Vergaraa, S. Vembu, T. Ayhan, M.A. Ryan, M.L. Homer, R. Huerta, “Chemical gas sensor drift compensation using classifier ensembles” Sensors and Actuators B: Chemical, 166-167, 320-329, 2012. https://doi.org/10.1016/j.snb.2012.01.074