Machine Learning for Network Intrusion Detection Based on SVM Binary Classification Model

Adv. Sci. Technol. Eng. Syst. J. 5(4), 638–644 (2020);
 DOI: 10.25046/aj050476
Recently, the number of connected machines around the worldwide has become very large, generating a huge amount of data either to be stored or to be communicated. Data protection is a concern for all institutions, it is difficult to manage the masses of data that are susceptible to multiple threats. In this work, we present a novel method of Intrusion Detection System (IDS) based on the detection of anomalies in computer networks. The aim is to use artificial intelligence techniques in the form of Machine Learning (ML) for intrusion detection. For this purpose, we have proposed a Support Vector Machine (SVM) classification model with two kernels, one Polynomial and the other Gaussian. This model is trained and tested with the recent UNSWNB-15 dataset. Regarding the results obtained, we have evaluated our model with six metrics capable of offering all potential threats. As a result, we have achieved a percentage of 94% for the detection rate (DR).
1. Introduction
The application of artificial intelligence in the field of computer network security has become an inescapable reality. In this context, we propose an extended version of an oral communication [1] which deals with network intrusion detection based on the SVM model.
The use of computer network services has become essential in several areas, particularly those related to daily life. The exchange of data can be very costly in the case of sometimes fatal threats, especially when it is a large-scale exchange at the level of governments or businesses [2]. These threats affect the integrity, confidentiality, and availability of these data. Possible solutions for the protection of computer networks are divided into two categories, those related to hardware or those related to software. We can cite firewalls, antivirus, cryptography, etc. as solutions. However, these solutions are insufficient to protect all networks [3]. In order to strengthen network security, another higher level of security such as IDSs is needed.
An IDS is a medium that allows us to protect our computer network from any unwanted activity as described in [4]. It filters incoming and outgoing network traffic to detect possible threats in the network. We distinguish between two types of IDS, the classical ones based on signatures as in the open-source software SNORT. They have a database of intrusion signatures. The signature of each incoming entity is compared with the signatures present in this database. Thus, the signature-based-IDS is very efficient for the detection of common threats and generates a very low FAR (False Alarm Rate). Despite this, it is unable to detect modern attacks. The second type of IDS is based on artificial intelligence techniques using ML for the detection of new attacks (0 Day attack) as described in the work [5]. However, the only problem is the very high false alarm rate generated by this type of IDS. This is the reason why several scientific research works are interested in this topic.
In this article, we present an IDS based on the technique of ML. We have chosen to use an SVM binary classification model associated with a UNSWNB-15 dataset for training and testing the proposed model. This article is structured into seven sections: In section 2, we present the related work. In the next section, we discuss the basic principle of an IDS. Then, section 4 concerns the existing data sources and the description of the UNSWNB-15 data set that we have used in this paper. In Section 5, we present our methods. In section 6, we show the performance of our proposed model with a comparison and interpretation of the results obtained. In the last section, we have a general conclusion and the perspectives of this work.
2. Related Work
In recent years, protecting computer networks against various threats is a priority for most companies. The evolution of cyberattacks requires the use of highly developed ways for the detection of these threats. Among the first works, we can cite the work of James Canady [6] who used the Artificial Neural Network (ANN) classification model in 1998. Netssan P, et al [7] obtained a detection rate of 85.87% with the KDD-CUP 99 dataset by combining two naive Bayesian models and decision trees. Other work using the same KDD-CUP 99 dataset has been proposed by O. Deepen et al [8]. They obtained a DR of 99.9% so the FAR is too low in the order of 1.25%. Also, Divyatmika et al [9] achieved a detection rate close to 99% with the Multilayer Perceptron (MLP) classification model algorithm using KDD-CUP 99 dataset. Finally, G-H Zhou [10] proposed a very efficient model (Detection rate = 99.54%) using a KDD-CUP 99 dataset for an IDS.
In parallel to the above, several works have used different ML algorithms for the detection of threats in computer networks. We cite the work of G. Meena et al [11] who recently published a paper using some Machine Learning algorithms associated with the two datasets NSL-KDD and KDD-CUP 99. Also, L. Dhanabal et al [12] published a study evaluating the efficiency of ML algorithms with the NSL-KDD dataset.
The two datasets KDD-CUP 99 and NSL-KDD are used in most of the previous work. They remain ineffective for the detection of recent attacks, even though the detection rate is very high for the different classification algorithms [13]. Therefore, it is necessary to use a newly updated dataset containing the behavior of modern network traffic. In Section 4, we will develop a study of the different existing datasets to show the effectiveness of a modern intrusion detection system.
3. Intrusion Detection System
An IDS allows us to protect our computer network infrastructure from any malicious activity. These activities are generally targeting the integrity, confidentiality, and availability of data in our network.
We classify IDS according to several criteria such as the type of IDS and the associated classification method. Regarding the type, we have the (N-IDS) and the (H-IDS) (Figure 1):
- N-IDS (Network Intrusion Detection System): It secures the entire network. Its location in the network affects the false alarm rate. For example, if the NIDS is located upstream of a Firewall (Figure 1), then it generates fewer false alarms. Since the traffic is already filtered by the Firewall. Otherwise, if it is placed downstream of a Firewall (location 2). It generates more false alarms.
- H-IDS (Host Intrusion Detection System): It allows the machine to be secured on its own without the use of other systems.
The IDSs are classified according to the detection method as in the work [14]. The first is signature-based-IDS. In this case, the IDS have a signature base compared with the signature of each incoming entity. This allows the IDS to be very favorable for the detection of already known intrusions. However, this first class of IDS only detects modern attacks (0 Day attack) i.e. threats with unknown signatures [15]. The second detection class is anomaly-based-IDS as in [16]. In this work, we have used this last class of threat detection. We have focused on new machine learning techniques. Knowing that an IDS builds a user profile based on the normal behavior of the system. It then monitors the network to identify any abnormal activity in the network. The anomaly-based- IDS can detect modern attacks, but it generates a high FAR in contrary to the signature-based-IDS.
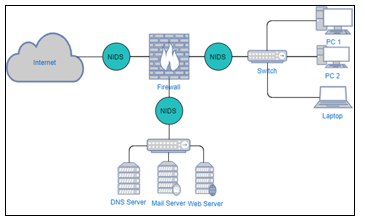 Figure1: Architecture of an IDS
4. Datasets
4.1. IDS-Dataset
Since the end of the 1990s, research work has been developing datasets for IDSs. These data sources are collected from network traffic simulators or by real systems, although the latter is very difficult to achieve because it may contain private data. One of the most widely used data sources is DRAPPA98 [17] published publicly in 1998 by MIT. Also, the dataset KDD-CUP 99 [18] published in 1999. This dataset contains the features of four categories of attacks (DOS, Probe, R2L, U2R). The major problem encountered is the considerable amount of redundant data which makes the use of this dataset difficult. We can also mention NSL-KDD dataset [19]. It is an updated version of the KDD-CUP 99. The NSL-KDD dataset is widely used for the network intrusion classification. Finally, we have other but less popular datasets such as CAIDA, DARPA, ISCX dataset, CICIDS.
4.2. Selecting-dataset
Previous researches are based on the two datasets KDD-CUP 99 and NSL-KDD for the classification of threats in computer networks. The authors of the works [13,20,21] have shown that these datasets encounter significant problems and their use is unreliable. These datasets suffer from a lack of diversity in traffic volumes. They contain duplicate data which does not cover real and recent attacks. To overcome these dataset issues, we have adopted the UNSWNB-15 [22] data source for training and testing our proposed model. Table 1 presents a comparison between the three datasets KDD-CUP 99, NSL-KDD, and UNSWNB-15.
Table 1: Comparison between the three datasets
| Dataset | RNC | RNT | LO | TIC | FPC | MMC |
| KDD Cup 99 | ü | ü | ü | ü | ü | |
| NSL-KDD | ü | ü | ü | ü | ü | |
| UNSW-NB15 (used in our method) | ü | ü | ü | ü | ü | ü |
RNC: Realistic Network Configuration
RNT: Realistic Network Traffic
LO: Labelled Observations
TIC: Total Interaction Capture
FPC: Full Packet Capture
MMS: Many Malicious Scenarios
4.3. UNSWNB-15 dataset description
In this work, we have used a UNSWNB-15 dataset. This dataset was developed by ACCS (Australian Centre for Cyber Security) using IXIA Perfect storm tools. It is published in 2015 by authors Mustapha & Slay [23]. The UNSWNB-15 dataset contains 49 features categorized into six data associations (See Table 2 below).
Table 2: UNSWNB-15 dataset features
| N° | Features | Type | |
| Flow features | 1 | srcip | N |
| 2 | sport | I | |
| 3 | dstip | N | |
| 4 | dsport | I | |
| 5 | proto | N | |
| Basic features | 6 | state | N |
| 7 | dur | F | |
| 8 | sbytes | I | |
| 9 | dbytes | I | |
| 10 | sttl | I | |
| 11 | dttl | I | |
| 12 | sloss | I | |
| 13 | dloss | I | |
| 14 | service | N | |
| 15 | sload | F | |
| 16 | dload | F | |
| 17 | spkts | I | |
| 18 | dpkts | I | |
| Content features | 19 | swin | I |
| 20 | dwin | I | |
| 21 | stcpb | I | |
| 22 | dtcpb | I | |
| 23 | smeansz | I | |
| 24 | dmeansz | I | |
| 25 | Trans_depth | I | |
| 26 | Res_bdy_len | I | |
| Time features | 27 | sjit | F |
| 28 | djit | F | |
| 29 | stime | T | |
| 30 | ltime | T | |
| 31 | sintpkt | F | |
| 32 | dintpkt | F | |
| 33 | tcprtt | F | |
| 34 | synack | F | |
| 35 | ackdat | F | |
| Additional features: general purpose features | 36 | is_sm_ips_ports | B |
| 37 | ct_state_ttl | I | |
| 38 | ct_flw_http_mthd | I | |
| 39 | is_ftp_login | B | |
| 40 | ct_ftp_cmd | I | |
| Additional features: Connection features | 41 | ct_srv_src | I |
| 42 | ct_srv_dst
|
I | |
| 43 | ct_dst_ltm
|
I | |
| 44 | ct_src_ ltm | I | |
| 45 | ct_src_dport_ltm | I | |
| 46 | ct_dst_sport_ltm | I | |
| 47 | ct_dst_src_ltm | I | |
| Labelled features | 48 | attack_cat | N |
| 49 | Label | B | |
| Type:
N: Nominal, I: Integer, F: Float, T: Timestamp, B: Binary |
|||
The UNSW-NB15 dataset provides two label features: ‘Attck_cat’ represent the nine attack types (see table 3). It is used for a Multi-Class classification. The feature ‘label’ is used for binary classification (Normal and Attack). In this work, we choose to use a binary classification based on the second label feature.
Table 3: Types of attacks on UNSWNB-15
| category | Sample |
| DOS | A DOS attack is a malicious activity in a computer network whose purpose is to prevent a network service from working for a given time. |
| Fuzzers | Is a method that randomly generates data to be injected into programs to detect possible vulnerabilities in a computer system. |
| Backdoors | A malicious program that provides access to a remote system for an unauthorized user. |
| Exploit | Consists of exploiting a software or hardware vulnerability in a computer network. |
| Analysis | This type of threat makes it possible to use vulnerabilities in a computer network to collect data useful for identifying future attacks. |
| Generic | This category opposes all block ciphers regardless of their structure. It concerns block cipher defined by given key sizes and blocks. |
| Recognition | This attack consists of discovering a computer system in order to detect vulnerabilities for future attacks. |
| Shellcode | A block of code to be injected into a computer program by a hacker. This makes it possible to exploit system deficiencies for malicious purposes. |
| Worms | A worm activates in a computer system by exploiting various vulnerabilities. It then spreads across the network by selecting other targets. |
5. Proposed model
As we have previously shown, a signature-based-IDS is very efficient to detect the known attacks. However, it has a very low detection rate for recent attacks with unknown signatures. Figure 2 shows the Machine Learning steps followed in our model for the detection of attacks in a computer network. We used the SVM model to separate the two classes (Attack and No-Attack). Since in our case the data are non-linearly separable, we used the two functions with Polynomial and Gaussian kernel. These two functions are known by their good performances at the classification level in the SVM.
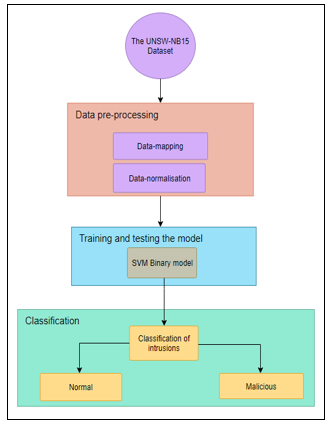 Figure 2: SVM binary classification proposed model
In our experience, the UNSWNB-15 dataset is composed of both CSV (Comma-separated values) files called UNSW_NB15_training_set.csv and UNSW_NB15_testing_set.csv. The first file contains 175 341 records for training the model (68%). However, the second contains 82 332 records for testing the model (32%). This dataset contains an integer, float, timestamp, and binary data type [23].
5.1. Data preprocessing
To train and test our model, a pre-processing step is necessary to select useful data ready for classification.
- Data-mapping: the first pre-processing step is data-mapping. It consists in transforming nominal data into numerical data (see figure 3). For example, the state field contains nominal data (INT, FIN, CON). In this phase, we converted these nominal values into numerical values (1,2,3).
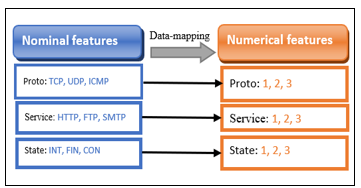 Figure 3: Data-mapping
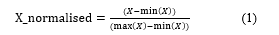
- Data normalization: this step consists of increasing the speed of data processing. In this work, we applied the Min-Max method for data normalization. This consists in putting the numerical data in the margin [0-1] according to the following formula (1):
 5.2. The SVM classifier
In this work, we have two observed classes (Attack and No-Attack). We used the SVM model for binary classification. This model is one of the algorithms of Machine Learning that have provided great performances either in classification or regression. It is a supervised learning model developed by Vapnik. In the case of classification, as in our case, the SVM model consists in finding a better boundary between the two observed classes (attack and No-Attack) (see figure 4). In this case, the data are non-linearly separable. For this purpose, we propose the kernel trick to have an optimal data separation as described in the work [24]. We assign two kernels one Gaussian and the other Polynomial because the data of the UNSWNB-15 dataset are also not linearly separable.
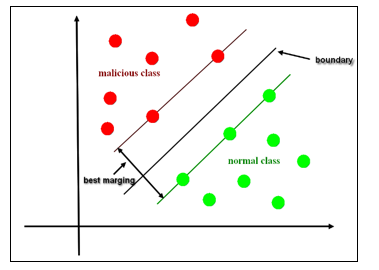 Figure 4: SVM Model hyperplane separation
6. Results and discussions
6.1. Criteria for Evaluating an IDS
The evaluation of an IDS is dependent on two main criteria:
- The Reliability of the IDS: The IDS must produce an alert for each incoming threat. An unreported intrusion is a system failure.
- The relevance of the IDS: Each alert must relate to a real threat. If we have a normal input event and it is classified as an intrusion also considered as well as a system failure. Table 4 presents the 4 possible cases.
Table 4: The confusion matrix
| Predicted Normal | Predicted Abnormal | |
| Normal event | TN | FP |
| Abnormal event | FN | TP |
TP (True Positive): Normal traffic is classified normal
FP (False positive): Normal traffic is classified abnormal.
FN (False Negative): abnormal traffic is classified normal
TN (True Negative): abnormal traffic is classified abnormal.
In our case, the confusion matrix gives the number of right and wrong predicted attacks, the same for the normal class (No-Attack).
6.2. Evaluation metrics of an IDS
To illustrate the effectiveness of our model, in this work we used six evaluation metrics.
We begin with the TPR (True Positive Rate) or Sensitivity. It describes the proportion of the positive class (Attack) correctly classified. The TPR calculates the quality of the IDS in terms of detection. To calculate the TPR, we use formula (2), note that the TPR must be close to 1 for a good IDS.
![]() On the opposite, the FPR (False Positive Rate) or Specificity. It describes the proportion of the negative class (No-Attack) correctly classified. To calculate the FPR, we use the formula (3), note that the FPR must be close to 0 for a good IDS.
On the opposite, the FPR (False Positive Rate) or Specificity. It describes the proportion of the negative class (No-Attack) correctly classified. To calculate the FPR, we use the formula (3), note that the FPR must be close to 0 for a good IDS.
![]() An effective IDS should provide a TPR close to 1 and a FPR close to 0.
An effective IDS should provide a TPR close to 1 and a FPR close to 0.
The third evaluation metric is accuracy, which provides the true predictions for the entire test base. We calculate the accuracy according to the following formula (4):
![]() Accuracy calculation (PR) provides the proportion of true positive predictions in the forecast class (Attack). The accuracy is shown by the following formula:
Accuracy calculation (PR) provides the proportion of true positive predictions in the forecast class (Attack). The accuracy is shown by the following formula:
![]() The fifth metric is RECALL (RE). It returns the proportion of correct predictions in the attack class. It is calculated according to the formula (6):
The fifth metric is RECALL (RE). It returns the proportion of correct predictions in the attack class. It is calculated according to the formula (6):
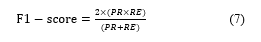
![]() The last metric that we have used is F1-Score. This is a calculation of the harmonic average between precision (PR) and recall (RE). It is calculated according to formula (7):
The last metric that we have used is F1-Score. This is a calculation of the harmonic average between precision (PR) and recall (RE). It is calculated according to formula (7):
 6.3. The obtained results
Our model is tested with the UNSWNB-15 dataset. The SVM classifier is used with two kernel functions Polynomial and Gaussian for binary classification. With this model, we obtained good results in terms of DR for the classes normal and malicious.
The figures 5 and 6 show, respectively the confusion matrix for the two kernels SVM-Gaussian and SVM-Polynomial.
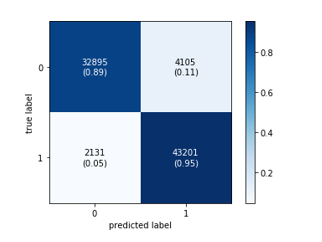 Figure 5: Confusion Matrix for the SVM- Gaussian model
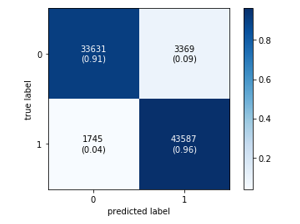 Figure 6: Confusion Matrix for the SVM-Polynomial model
To present our obtained results, we have plotted the ROC curves for the two kernels. These curves represent the TPR (Sensitivity) as a function of FPR (Specificity). They show that we have a very high rate of true positives (close to 1) against a low rate of false alarms (close to 0). This validates the performance of our model.
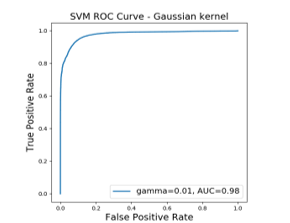 Figure 7: ROC curves correspond to Gaussian kernels
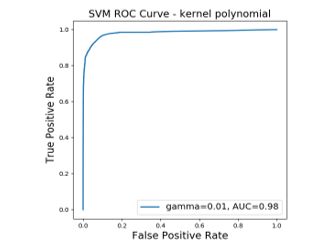 Figure 8: ROC curves correspond to Polynomial kernels
Tables 5 and 6 show the performance of the two kernels SVM-Gaussian and SVM-Polynomial:
- With the Gaussian kernel, we obtained a DR of 94% for the normal class and 91% for the malicious class.
- For the Polynomial kernel, we found slightly high results compared to the Gaussian function. We obtained a detection rate of 95% for the normal class and 93% for the abnormal class.
Table 5. SVM Gaussian kernel results
| Class | Precision (5) | Recall (6) | F1-Score (7) |
| No-Attack | 0.94 | 0.89 | 0.91 |
| Attack | 0.91 | 0.95 | 0.93 |
| Accuracy (4) | 0.93 | 0.92 | 0.92 |
Table 6. SVM Polynomial kernel results
| Class | Precision (5) | Recall (6) | F1-Score (7) |
| No-Attack | 0.95 | 0.91 | 0.93 |
| Attack | 0.93 | 0.96 | 0.94 |
| Accuracy (4) | 0.94 | 0.94 | 0.94 |
6.4. Performance evaluation of the proposed model
To evaluate the effectiveness of our model, we compared our obtained results with those of other work using the same UNSWNB-15 dataset (Table 7). The comparison results of our SVM model with other classification models are good. We obtained for the Polynomial kernel an accuracy equal to 94% as shown in the following table:
Table 7. Comparison with of other models
| Reference | Model | Accuracy | F1-score |
| [25] | RepTree | 88.95 | – |
| [26] | RandomForest | 90.3 | 92.4 |
| [27] | MLP | 86.7 | 89 .22 |
| Proposed model | SVM Kernel- Gaussian | 93 | 92 |
| Proposed Model | SVM Kernel-Polynomial | 94 | 94 |
7. Conclusions and perspective
In this work, we have developed a novel method for detecting attacks in computer networks. For this purpose, we presented a binary model for the classification of intrusions. We used the UNSWNB-15 data source. This source is widely used in the field of cybersecurity. We based on the SVM classifier with two kernel functions SVM-Polynomial and SVM-Gaussian. The evaluation results show high performance for both Gaussian (Accuracy = 93%) and Polynomial (Accuracy = 94%) kernels. In perspective, we will opt for a multi-class classification for the detection of each type of intrusion separately.
- A. BACHAR, N. E. MAKHFI and O. E. Bannay, “Towards a behavioral network intrusion detection system based on the SVM model”, 1st International Conference on Innovative Research in Applied Science, Engineering and Technology (IRASET), Meknes, Morocco, pp. 1-7, 2020. doi: 10.1109/IRASET48871.2020.9092094.
- L.A. Maglaras et al., “Cyber security of critical infrastructures. ICT Express, 4(1), 42-45, 2018. doi:10.1016/j.icte.2018.02.001
- K. Choo, “The cyber threat landscape: Challenges and future research directions”. Computers & Security 30:719–731, 2011. doi: 10.1016/j.cose.2011.08.004
- M. Aydin, M. Ali, A. Halim Zaim, and K. Gökhan Ceylan. “A hybrid intrusion detection system design for computer network security”, Computers & Electrical Engineering, p 517-526, 2009. Doi: 10.1016/j.compeleceng.2008.12.005
- D.K. Bhattacharyya, J.K. Kalita, “Network Anomaly Detection: A Machine Learning Perspective” : CRC Press, 2013.
- J. Cannady, “Artificial Neural Networks for Misuse Detection,” Proc eedings, National Information Systems Security Conference (NISSC ’98 ), October, Arlington ,VA, 443 -456. 1998.
- P. Natesan, P. Balasubramanie, “Multi Stage Filter Using Enhanced Adaboost for Network Intrusion Detection. International Journal of Network Security & Its Applications”, 4(3), 121-135, 2012. doi:10.5121/ijnsa.2012.4308
- O. Depren et al., “An intelligent intrusion detection system (IDS) for anomaly and misuse detection in computer networks. Expert Systems with Applications”, 29(4), 713-722, 2005. doi:10.1016/j.eswa.2005.05.002
- Divyatmika, M. Sreekesh, “A two-tier network based intrusion detection system architecture using machine learning approach. International Conference on Electrical, Electronics, and Optimization Techniques (ICEEOT), 2016. doi:10.1109/iceeot.2016.7755404
- G. Zhou, “An Effective Distance-Computing Method for Network Anomaly Detection. Security Technology Communications in Computer and Information Science”, 177-182, 2011. doi:10.1007/978-3-642-27189-2_19
- G. Meena et al., “A review paper on IDS classification using KDD 99 and NSL KDD dataset in WEKA”. International Conference on Computer, Communications and Electronics (Comptelix), 2017. doi:10.1109/comptelix.2017.8004032
- L. Dhanabal and S. P. Shantharajah, “A study on NSL-KDD dataset for intrusion detection system based on classification algorithms,”International Journal of Advanced Research in Computer and Communication Engineering, 4(6), 446–452, 2015. doi:10.17148/IJARCCE.2015.4696
- N. Moustafa, J. Slay, “The Significant Features of the UNSW-NB15 and the KDD99 Data Sets for Network Intrusion Detection Systems”. 4th International Workshop on Building Analysis Datasets and Gathering Experience Returns for Security (BADGERS), 2015. doi:10.1109/badgers.2015.014
- W. Hu, S. Maybank, “AdaBoost-Based Algorithm for Network Intrusion Detection. IEEE Transactions on Systems, Man, and Cybernetics, Part B (Cybernetics), 38(2), 577-583, 2008. doi:10.1109/tsmcb.2007.914695
- A.L. Buczak, E. Guven, “A Survey of Data Mining and Machine Learning Methods for Cyber Security Intrusion Detection. IEEE Communications Surveys & Tutorials, 18(2), 1153-1176, 2016. doi:10.1109/comst.2015.2494502
- P. Garc´ia-Teodoro, J. D´iaz-Verdejo, G. Maci´a-Fern´andez, E. V´azquez, “Anomalybased network intrusion detection: Techniques, systems and challenges. Comput. Secur. 28(1-2), 18–28, Feb 2009. https://doi.org/10.1016/j.cose.2008.08.003
- L. Lincoln, “DARPA datasets. In: DARPA 1998 & 1999. Datasets. https://www.ll.mit.edu/r-d/datasets. Accessed June 23, 2020
- KDD Cup (1999) KDD Cup 1999 Data. In: KDD Cup 1999 Data. http://kdd.ics.uci.edu/databases/kddcup99/kddcup99.html. Accessed June 23, 2020
- NSL-KDD (2009) NSL-KDD | Datasets | Research | Canadian Insti tute for Cybersecurity | UNB, https://www.unb.ca/cic/datasets/nsl.html Accessed June 23, 2020.
- M. Tavallaee, E. Bagheri, W. Lu, A.A. Ghorbani, “A detailed analysis of the KDD CUP 99 data set”. 2009 IEEE Symposium on Computational Intelligence for Security and Defense Applications, 2009. doi:10.1109/cisda.2009.5356528
- N. Moustafa, J. Slay, “The evaluation of Network Anomaly Detection Systems: Statistical analysis of the UNSW-NB15 data set and the comparison with the KDD99 data set”. Information Security Journal: A Global Perspective, 25(1-3), 18-31, 2016. doi:10.1080/19393555.2015.1125974
- N. Moustafa, “UNSW_NB15 dataset”, IEEE Dataport, 2019. Online Available: http://dx.doi.org/10.21227/8vf7-s525. Accessed June 23, 2020.
- N. Moustafa, J. Slay, UNSW-NB15: “A comprehensive data set for network intrusion detection systems (UNSW-NB15 network data set)”. 2015 Military Communications and Information Systems Conference (MilCIS), 2015. doi:10.1109/milcis.2015.7348942
- B.M. Aslahi-Shahri et al., “A hybrid method consisting of GA and SVM for intrusion detection system. Neural Computing and Applications”, 27(6), 1669-1676, 2015. doi:10.1007/s00521-015-1964-2
- M. Belouch, S. El, M. Idhammad, “A Two-Stage Classifier Approach using RepTree Algorithm for Network Intrusion Detection”. International Journal of Advanced Computer Science and Applications, 8(6), 2017. doi:10.14569/ijacsa.2017.080651
- R. Vinayakumar et al., “Deep Learning Approach for Intelligent Intrusion Detection System”. IEEE Access, 7, 41525-41550, 2019 doi:10.1109/access.2019.2895334
- J. Yan, D. Jin, C. Lee, P. Liu, “A Comparative Study of Off-Line Deep Learning Based Network Intrusion Detection”. 2018 Tenth International Conference on Ubiquitous and Future Networks (ICUFN), 2018. doi:10.1109/icufn.2018.8436774