
A Support Vector Machine Based Technique for Fault Detection in A Power Distribution Integrated System with Renewable Energy Distributed Generation
Volume 5, Issue 4, Page No 577-588, 2020
Author’s Name: Katleho Moloia), Yskandar Hamam, Jacobus Andries Jordaan
View Affiliations
Faculty of Built Environment and Engineering, Dept. of Electrical Engineering, Tshwane University of Technology, Pretoria, 1035, South Africa
a)Author to whom correspondence should be addressed. E-mail: moloikt023@gmail.com
Adv. Sci. Technol. Eng. Syst. J. 5(4), 577-588 (2020); ![]() DOI: 10.25046/aj050468
DOI: 10.25046/aj050468
Keywords: Fault Detection, Feature Extraction, Packet Wavelet Transform, Power System Integration, Renewable Energy Sources, Support Vector Machine

Export Citations
The integration of renewable energy distributed generation (REDG) into the energized distribution power grid has become more popular in recent years. This has been escalated by the general global energy shortages. The REDG has proven to be effective for energy sustainability and reliability. However, there are technical challenges which arise from integrating REDG into the energized power grid. These challenges include the effectiveness of power grid protection against faults. In this paper, a fault diagnostic algorithm is proposed to detect faults in a power system integrated with REDGs. The algorithm utilizes wavelet packet transform (WPT) for signal filtering, support vector machine (SVM) for fault classification and detection. The proposed algorithm is validated using the Eskom 90 bus electrical system and the results obtained show that faults can be detected with a high accuracy of 99%. The Eskom 90 bus system is modelled using DigSilent platform and the algorithm is tested on the WEKA software.
Received: 18 May 2020, Accepted: 17 July 2020, Published Online: 19 August 2020
1. Introduction
The reliable and sustainable source of energy plays a critical role for the potential growth in a state [1]. The global energy sector has been faced with many challenges over the years, such as energy shortages, high levels of air pollution from burning fossil fuel to generate electricity, and the high cost of coal. These problems have led to finding an alternative source of electricity supply to meet the required demands. Renewable energy distribution generators (REDG) for instance, photovoltaic (PV), wind turbine (WT), hydropower, biomass, etc.…, have been effective for energy supply with minimum environmental impact. The flexible introduction of REDGs enables their application to be necessary for formulating a power mix framework for energy sustainability.
The integration of REDGs into the existing distribution power grid has numerous practical aids such as voltage improvement, dependability increase, network performance increase, and power loss minimization [2, 3]. However, integrating REDGs into the power distribution grid changes the traditional trajectory of the energy supply. These changes in the power flow may influence the power balance of the entire power grid [4]. Furthermore, the meteorological and geological dependency of REDGs affects the expansion planning of the power grid, which results in escalated operational costs [5]. Coupled with these problems are there technical effects that arise from integrating REDGs into the power grid such as frequency variation [6], voltage fluctuations [7], reliable and secure power flow [8, 9]. Generally, the performance of the power grid with or without REDGs highly depends on the reliability of the protection system. The high penetration level of REDGs into the grid affects the traditional topology of the protection system. This may result in a catastrophic incident if a fault is not cleared timeously and with great effect. Integrating REDGs into the existing power grid has operational challenges that may affect the technical performance of the system. These challenges include voltage variations, power supply forecasting, frequency fluctuation and load demand management.
A power system grid is prone to faults, whether internally or externally. Electrical protection schemes are essential to timeously eradicate the presence of a fault in the power system [10, 11]. In recent years, numerous methods for power system fault diagnostic have been proposed. In [12], a method base on voltage imbalances and third harmonic distortion (THD) was used to determine the faulty section for an integrated power system network. The passive methods including frequency variations [13, 14], degree of alteration of power frequency [15], power and voltage variation [16], energy mismatch and harmonic content recognition [17] and the degree of variation of reactive power [18], these techniques were applied in power grid integrated network for fault diagnostic. Moreover, undetected faults have an undesirable effect on the overall performance of the power grid, the active algorithms used for fault diagnostic includes frequency signal injection [19], singular and dual harmonic current injection [20, 21], output power variation [22], reactive power control [23, 24], and the impedance measurement method [25, 26], these methods were used to detect faults in power grid integrated network with REDGs.
To improve the fault detection algorithms, artificial intelligence (AI) and machine learning (ML) have been adopted to solve the problem. The AI and ML algorithms have the advantage of discriminating and classifying different types of faults. Fault classification is an important element for reliability improvement and network security. The authors in [27], proposed a fault classification technique based on the decision tree algorithm. The technique was implemented in a PV plant system connected with the distribution network. An artificial neural network (ANN) based method was implemented for fault diagnostic in a system interconnected with WT energy system [28]. Another method based on ANN for islanding and fault detection in microgrids integrated with the power system was proposed [29]. Other AI and ML algorithms used for fault diagnostic in the power system includes fuzzy logic [30, 31], adaptive neuro-fuzzy interface system (ANFIS) [32], and Bayesian classifier [33]. Signal processing plays a major role in improving the fault detection algorithms, signal decomposition techniques which includes wavelet transforms (WT) [34], Hilbert-Huang transform (HHT), multi-resolution analysis (MRA) and Intrinsic Mode Function (IMF) [35] were used for signal tracking to improve the fault detection algorithm. Statistical data analysis is a critical aspect of the decision-making process. The support vector machine (SVM) has been successfully used in power engineering applications for fault diagnostics. The authors in [36], applied SVM for fault detection in high voltage systems. The quadratic function was implemented as an optimal kernel function for effective fault diagnostics. A technique based on SVM for fault diagnostic in active distribution integrated network with the PV plant was proposed [37]. The technique employed SVM for fault classification and isolation. A technique based on a modified multi-class support vector machine (MMC-SVM) was proposed to detect and classify different faults on a power system [38]. A maximal overlap discrete wavelet transform (MODWT) based technique was proposed for fault detection in a power system [39]. In [40], a method based on the multi-agent system (MAS) technique was proposed for fault diagnostic and location in a power system integrated network with DGs. Probabilistic Boolean network (PBN) technique was proposed for fault diagnostic in smart power system grid for performance and technical improvement [41]. A novel technique based on an unknown input observer (UIO) method was proposed for fault detection and isolation on microgrids [42].
1.1. Manuscript Organization
In this work, a hybrid fault diagnostic method based on packet wavelet transform (PWT) and support vector machine (SVM) is proposed. The PWT is used for signal decomposition and feature extraction, this is done to reduce computation burden and improve processing time. The particle swarm optimization (PSO) algorithm is implemented for determining the ideal parameters of SVM for maximum classification and detection. The paper is summarized as follow:
- The SVM method is used for a dual purpose (fault detection and classification).
- Feature extraction and selection technique using WPT is used to minimize the data size to effectively reduce the computational burden and time.
The remaining sections are organized as signal processing, feature extraction and selection are discussed in section 2, In section 3, the SVM method discussed. Section 4. Discussed the implementation of the proposed fault diagnostic method. The results are discussed in section 5, and lastly, a conclusion is drawn in section 6.
2. Signal Processing
Signal tracking and spectrum analysis is an essential element of signal decomposition and have been utilized for numerous signal analysis applications. The application of signal tracking is mostly used to distinguish the signal of interest from a range of present signals. Most power utilities use spectral analysis to analyze the signals recorded from a power system during the fault conditions to determine the nature of the fault. In this present work, WPT is used to track the signals of interest to enhance the fault detection algorithm.
2.1. Wavelet Packet Transform
The WPT technique is a mathematical tool used for tracking and analyzing signals. The WPT may be observed as the simplification of discrete wavelet transform (DWT) that produces more efficient signal analysis results [43]. The WPT can be utilized for numerous expansions of a signal at different levels. The DWT has generally been used for many power systems applications and has proven to be effective. However, DWT doesn’t produce good results for small values. This has led to the implementation of WPT in the present work. When using the WPT, the signal is passed through numerous filters containing both the low and high pass filtering process. The low frequency is represented by the approximation coefficient and the high frequency is represented by the detail coefficient. The and coefficients are supplementary decomposed repetitively to a particular point . The main advantage of WPT over DWT is that more features are obtained and the frequency resolution of WPT is greater than that of DWT.
In the present work, 30 kHz is used as the sampling frequency, and level 4 the decomposition is considered. Shannon’s entropy criterion is selected. The criterion is used to calculate the entropy at each decomposition level [44]. The best decomposition results are obtained when the parent entropy is greater than the total entropy of the decomposed level. The WPT decomposition tree of the present work is presented in Figure 1.
2.2. Extraction of features
The extraction of certain features from a signal is a process of minimizing huge data matrix by selecting significant feature which represents a specific pattern to improve computational processing
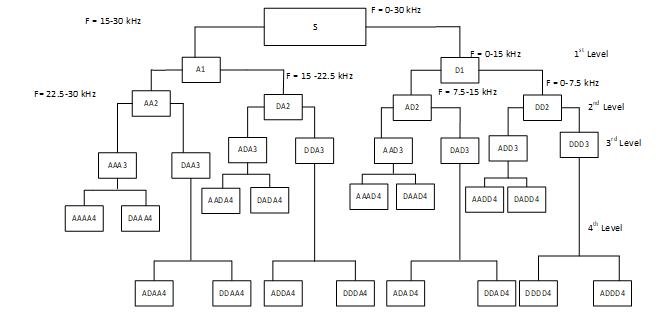 Figure 1: WPT decomposition tree
time. The data matrix is then converted to a feature matrix with fewer data points. The entropy and the energy features are extracted from the fault current signal. Energy is mathematically defined as [45, 46]:
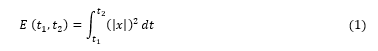 where, is the energy signal between the time range of and is the signal. The value of the energy signal is greater than the value of the normal signal. The entropy feature is used to measure the signal information content [45]. The measured information includes the cost function of the signal defined by the entropy such that the energy signal at zero = 0, the entropy is mathematically defined in eq. (2).
![]() where, is the decomposed coefficient of the signal . The value of the entropy is larger for transient signals and small for normal signals.
where, is the decomposed coefficient of the signal . The value of the entropy is larger for transient signals and small for normal signals.
2.3. Feature Selection
Feature selection is a process of selecting the best features from the developed data matrix. The best features are ranked based on the correlation with the target output, the redundant features are then rejected. The feature selection process is imperative as large redundant data increases computational processing time and gives erroneous results which affect the efficiency of the classification algorithm [47]. The general concept of the feature selection technique is to select the feature which best represents the target. The forward feature selection technique is employed for selecting the best features. The technique is used to calculate the best features at each step iterative and a sub-input features matrix is developed, thus removing the redundant features [47]. The mean square error (MSE) function is used to evaluate the ranking of features determined by the K-nearest neighbor (KNN) technique [48]. The features are ranked from high to low depending on the margin of error.
3. Pattern Recognition and Classification
Pattern recognition and classification have been a subject of interest for many researches in the past decades. The interest has arisen because of the many application ranging from speech recognition, image identification, power system fault, and optical character recognition. It is therefore important to build intelligent machines that can reliably and accurately be used to solve classification problems. Generally, classification is defined as a process of categorization, in which data, objects, and ideas are recognized and understood to produce an accurate response.
3.1. Support Vector Machine
Support vector machine (SVM) was originally established to resolve statistical problems in empirical data modelling. When using SVM, the input data is plotted into a high dimensional space to determine the separating margin between two classes of data. The hyperplane is the separating index between the two classes of data [49]. The hyperplane is optimal when the distance between the class of data sets is maximized. The hyperplane can be calculated using the quadratic programming method defined mathematically as:
subject to

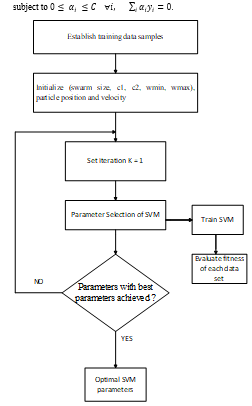 Figure 2: SVM parameter selection process using PSO
Kernel function can be used to solve the problem of non-linearity in statistical analysis. The linear, quadratic, radial bias function (RBF) and sigmoid are the most commonly used kernel functions. The advantage of SVM is that it gives a global solution, it is inclined to overfitting and it converges to local minima. The selection of SVM parameters is a significant and critical task for accurate fault diagnostic in a power distribution system [50]. To improve the performance of SVM, a particle swarm optimization (PSO) scheme is used to select the best parameters of the SVM.
The PSO technique was initially developed by Eberthart and Kennedy to solve optimization in 1995 [51]. The PSO technique is founded on the ordinary conduct of birds during a flight in space. The PSO relies on updating the initial position and velocity of each particle at every iterative until an optimal solution is determined. The process of using the PSO method begins with generating the random particles given by . The best optimization solution is determined by calculating the fitness value of each particle. and finally, the velocity of each particle is modernized by the mathematical representation defined as:
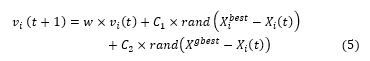 where, is the best global solution, is the solution at the current position, and are the non-negative constants representing the best local and global position weight respectively, and is the inertia coefficient. The position of the particle will be updated using the following expression:
![]() To estimate the fitness value of the SVM by utilizing the PSO technique the fitness function is represented as:
To estimate the fitness value of the SVM by utilizing the PSO technique the fitness function is represented as:
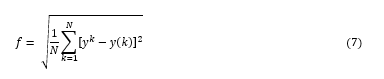 where, denotes the discrete sample number, is the discrete signal, and is the SVM output. The process of obtaining optimal parameters for SVM application is presented by a flow chart in Figure 2.
4. Proposed Fault Detection Technique
Section 4, discussed the proposed fault diagnostic technique which is applied in a power grid network. The fault detection taxonomy proposed in this work is presented in Figure 3. The fault current signal with one cycle is analyzed to detect the fault type that occurred in the power grid network. The fault current signal is decomposed into large frequency sub-bands using WPT. From the disintegrated fault current signal, the statistical signal features (energy and entropy) are extracted. The total set of features to build a matrix is 32 (16 coefficients 2 statistical features). The fault current signal data is then generated considering simulation conditions. The generated data is then divided into the training and testing data.
From the total extracted features using WPT, other features do not forecast the desired results accurately and thus reducing the efficiency of the scheme. A feature selection technique is employed to eliminate features that do not present desired results. The selection technique uses a ranking algorithm to eliminate the features which are redundant and compromises the accuracy of the proposed technique. The best selected features are then fed into a classifier for fault identification. The PSO method is utilized to determine the optimal parameters of the SVM classifier. The fault classification scheme using the SVM technique is presented in Figure 4. From the presented scheme, each phase of the power system has a classification scheme to identify faults occurring in each phase, another SVM scheme is placed to detect ground faults. To accurately classify different fault conditions, the SVM output is either ‘+1’ or ‘0’, where ‘+1’
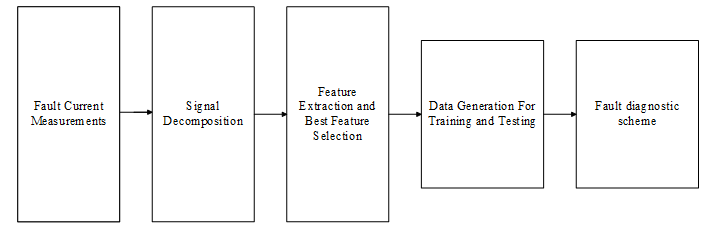 Figure 3: Fault detection taxonomy
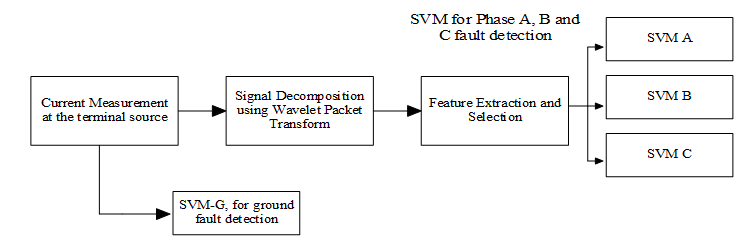 Figure 4: SVM Fault classification scheme
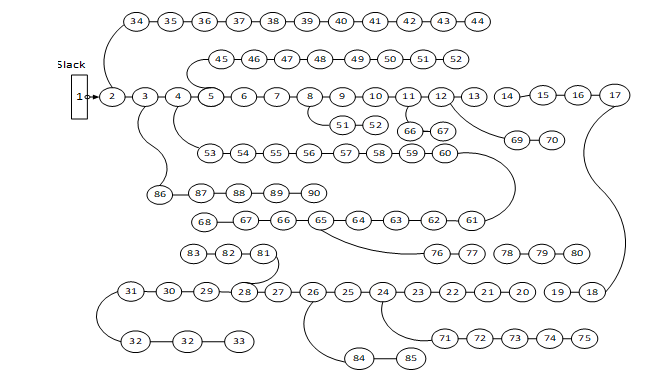 Figure 5: Eskom Network
shows that there is a fault and ‘0’ shows that there is no fault in the power system. In practice the line to line fault is usually misclassified as a line to line to ground, this problem may affect the restoration time. To solve this problem, a separate SVM scheme is positioned between the phase and ground where a zero-phase sequence current pointer is utilized as a directory value as presented in Figure 4. The index threshold value is determined using a trial and error method, in the present work, the value is set at 0.03. The ground fault detection is detected if the directory value is bigger than the set minimum value. The current index can be defined mathematically as:
 where, represents the accurate fault classification.
5. Power System Case-Study
In this work, an Eskom 90 bus 22 kV system is considered. The power system network is modelled using Digsilent Power Factory platform. The PV and WT sources are connected into the network at the location optimally determined to satisfy technical consideration (power loss, voltage stability, fault levels, and power quality, etc.…). The proposed Eskom network is presented in Figure 5. The base voltage of the network is 22 kV and the base apparent power is 100 MVA. The total load connected to the system is 115.5MVA. the maximum fault level at the substation is 15 kA. The PV connected into the system is rated at 50kW and the WT is rated at 120 kVA.
6. Results and Discussion
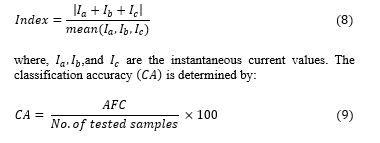
An integrated power mix energy distribution system is considered in this work. The simulated fault current signals are presented in (a)
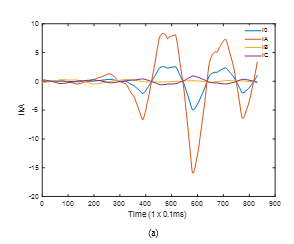
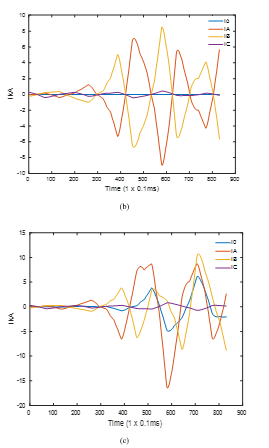
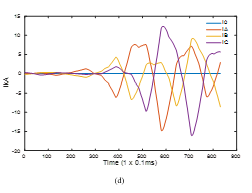 Figure 6: (a) Line-to-ground fault signal, (b) Line-to-line fault current signal, (c) Line-to-line-to-ground fault current signal, (d) Three phase fault current signal
The sampling frequency considered in the present work is taken to be 30 kHz. The WPT scheme is used to decompose the signal at level 4, and the entropy and energy features are extracted. The choice of a mother wavelet is vital for analyzing the signals. In the present work, Daubechies 4 is selected as the best for transient signal analysis. Some of the WPT decomposed features are presented in (d)
Figure 6. Furthermore, the best features are obtained from the extracted features. The best features using WPT to accurately predict the target is presented in Table 1. After the acquisition of best features, the features are subdivided into training and testing data sets. The training and testing parameters with various conditions are presented in Table 2.
Different fault current cases are simulated and the data is subsequently fed into the SVM for classification. A fault training matrix using SVM is detailed in Table 3. In the present work, SVM output is either a ‘+1 or 0’, where +1 shows that there is a fault and 0 is the output of a non-faulty section in the corresponding phase.
Table 1: Best Features
| Signal type | Features | Coefficients |
| Current |
Entropy Energy |
ADAD4 DDDD4 |
Table 2: Training and testing parameters
| Data set | Fault resistance (Ω) | Incipient Angle |
| Test and Training |
0, 1, 5, 15, 35, 80, 105, 150 2, 16, 28, 55, 68, 140, 190 |
00, 300, 400, 600, 700 150,480, 760, 880, 100 |
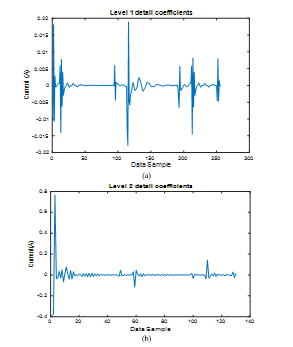
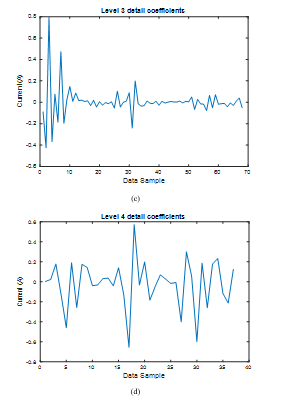 Figure 6: (a) Level 1 Detail Wavelet coefficients, (b) Level 2 Detail Wavelet coefficients, (c) Level 3 Detail Wavelet coefficients, (d) Level 4 Detail Wavelet coefficients
Table 3: SVM classification matrix
| Fault Type | SVMA | SVMB | SVMC | SVMG |
| A-G | +1 | 0 | 0 | +1 |
| B-G | 0 | +1 | 0 | +1 |
| C-G | 0 | 0 | +1 | +1 |
| A-B | +1 | +1 | 0 | 0 |
| A-C | +1 | 0 | +1 | 0 |
| B-C | 0 | +1 | +1 | 0 |
| A-B-G | +1 | +1 | 0 | +1 |
| A-C-G | +1 | 0 | +1 | +1 |
| B-C-G | 0 | +1 | +1 | +1 |
| A-B-C | +1 | +1 | +1 | 0 |
An evaluation fault classification process of selecting the optimal mother wavelet is determined and the results are shown in Table 4. In this present work, we further investigated other signal tracking analysis techniques such as the wavelet transform (WT) and the Fourier transform (FT). Based on the analysis done, the WPT signal analysis technique performed better than both the FT and WT. this is because when using the WPT, both the low and the high frequencies are measured and this improves the data analysis of a signal. From the results, dB4 has the highest accuracy level and thus it is selected for the scheme application. The PSO technique is used to obtain optimal parameters of the SVM. In Table 5, the best SVM parameters are presented. The PSO parameters are presented in Table 6.
Table 4: Mother wavelet performance evaluation
| Mother wavelet | WPT fault diagnostic accuracy (%) | WT fault diagnostic accuracy (%) | FT fault diagnostic accuracy (%) |
| dB1 | 86.3 | 88.1 | 86.1 |
| dB2 | 72.1 | 68.2 | 63.2 |
| dB3 | 88.0 | 90 | 85.4 |
| dB4 | 99.8 | 86 | 81.2 |
| dB7 | 96.4 | 89.3 | 88.6 |
| dB14 | 93.7 | 91.4 | 90.1 |
Table 5: SVM best parameters
| SVM parameters | Fault classification |
| Kernel function | Radial bias function |
| Gamma | 0.35 |
| Cost | Not used |
| Nu | 0.5 |
Table 6: PSO parameters
| PSO parameters | Value |
| 5 | |
| Particle size | 70 |
| No. of iteration | 1000 |
| 0.7 | |
| 0.8 |
In Table 7, the classification results of different fault cases are presented. From the presented results it may be seen that the accuracy of classification is 1321. In the present work, we tested the Naïve Bayes (NB), Neural Network (NN), Decision tree (DT), and K-Nearest Neighbor. These techniques are implemented in a free machine learning platform Waikato Environment for Knowledge Analysis (WEKA). The classification process is carried by developing a classifier based on the training and testing of different class labels. Subsequently, the test data set is applied to the classifier to predict the accuracy of the classification.
The description of the different classifiers is discussed below:
- Naïve Bayes (NB): The NB algorithm is recognized as a fast learning technique. It is a simplified version of the Bayesian classifier and functions and under certain assumptions, (i) Attributes are conditionally independent for the class label, (ii) The prediction process is not affected by the latent attributes [52].
- Decision Tree (DT): The DT is a well-known efficient data mining algorithm for solving difficult problems by formulating computer graphic illustrations. The DT algorithm has been used proficiently to solve real-world problems [53].
- Neural Network (NN): The NN technique was developed by using the biological analysis of a human brain. This algorithm performs better with big data analysis and has proven to be efficient for classification and prediction purposes [54].
The performance of the different classifiers is evaluated using the confusion matrix. The correlation of the predicted instances values of the NB, DT and NN classifiers are presented in Table 8, Table 9 and Table 10 respectively.
Table 7: SVM accuracy
| Fault type | Tested samples | Samples correctly classified | Samples incorrectly classified | Classification accuracy (%) |
| L-G (a-g, b-g, c-g) | 60 400 | 60 075 | 325 | 99.4 |
| L-L (a-b, a-c, b-c) | 60 400 | 60 100 | 300 | 99.5 |
| L-L-G (ab-g, ac-g, bc-g) | 60 400 | 59 905 | 495 | 99.2 |
| LLL (abc) | 30 200 | 16 270 | 530 | 98.2 |
| Total | 211 400 | 196 350 | 1 650 | 99 |
Table 8: Naive Bayes fault classification performance
| NB classifier | Line-Ground | Line-Line | Line-Line-Ground | Line-Line-Line |
| No. of cases | 50 400 | 50 400 | 50 400 | 16 800 |
| Correct classified | 50 010 | 50 000 | 50 130 | 16 080 |
| Incorrectly classified | 390 | 400 | 270 | 720 |
| Correct classified % | 99.2 | 99.2 | 99.5 | 95.6 |
| Mean absolute error | 0.0085 | 0.0811 | 0.0712 | 0.0625 |
| Root mean | 0.0862 | 0.092 | 0.881 | 0.755 |
| Kappa statistic | 0.967 | 0.938 | 0.935 | 0.933 |
| Confidence level (95%) | 96.32 | 95.661 | 96.225 | 95.213 |
Table 9: Decision Tree fault classification performance
| NB classifier | Line-Ground | Line-Line | Line-Line-Ground | Line-Line-Line |
| No. of cases | 50 400 | 50 400 | 50 400 | 16 800 |
| Correct classified | 49 820 | 50 110 | 48 930 | 16 580 |
| Incorrectly classified | 580 | 290 | 1 470 | 220 |
| Correct classified % | 98.8 | 99.4 | 97.1 | 98.6 |
| Mean absolute error | 0.0093 | 0.0098 | 0.0397 | 0.0052 |
| Root mean | 0.0185 | 0.095 | 0.0891 | 0.0712 |
| Kappa statistic | 0.889 | 0.959 | 0.966 | 0.9221 |
| Confidence level (95%) | 95.101 | 96.261 | 97.181 | 97.43 |
Table 10: Neural Network fault classification performance
| NB classifier | Line-Ground | Line-Line | Line-Line-Ground | Line-Line-Line |
| No. of cases | 50 400 | 50 400 | 50 400 | 16 800 |
| Correct classified | 50 120 | 50 325 | 47 635 | 15 990 |
| Incorrectly classified | 280 | 75 | 2 765 | 810 |
| Correct classified % | 99.4 | 99.8 | 94.5 | 95.2 |
| Mean absolute error | 0.0792 | 0.0093 | 0.0235 | 0.0125 |
| Root mean | 0.0193 | 0.0822 | 0.0822 | 0.0961 |
| Kappa statistic | 0.722 | 0.823 | 0.917 | 0.9882 |
| Confidence level (95%) | 96.123 | 98.225 | 95.921 | 95.182 |
The performance comparison of the SVM, NB, DT, and NN techniques applied for classification is presented from
Table 11 to Table 14 respectively. To improve the computational time analysis, the fault current data set is subdivided and a quarter of the data sample is used for fault identification. From the presented results the average precision of SVM, NB, DT, and NN is 99.9%, 83%, 99.7%, and 94% respectively. For this application, the SVM classifier performed better than other tested classifiers in the present work.
Table 11: SVM performance with ¼ data set
| Fault Type | Line-Ground | Line-Line | Line-Line-Ground | Line-Line-Line | Average |
| TP | 0.992 | 0.999 | 0.997 | 0.999 | 0.997 |
| FP | 0.000 | 0.005 | 0.008 | 0.001 | 0.004 |
| Precision | 1.000 | 1.000 | 0.998 | 1.000 | 0.999 |
| Recall | 0.998 | 0.994 | 0.995 | 0.991 | 0.995 |
| F-Measure | 0.999 | 0.993 | 0.991 | 0.998 | 0.995 |
| ROC | 0.999 | 0.994 | 0.989 | 0.998 | 0.995 |
Table 12: NB Performance with ¼ data set
| Fault Type | Line-Ground | Line-Line | Line-Line-Ground | Line-Line-Line | Average |
| TP | 0.931 | 0.920 | 0.951 | 0.972 | 0.944 |
| FP | 0.024 | 0.004 | 0.006 | 0.001 | 0.009 |
| Precision | 0.851 | 0.561 | 0.945 | 0.922 | 0.830 |
| Recall | 0.957 | 0.883 | 0.992 | 0.856 | 0.922 |
| F-Measure | 0.858 | 0.864 | 0.840 | 0.951 | 0.878 |
| ROC | 0.967 | 0.960 | 0.910 | 0.951 | 0.947 |
Table 13: DT Performance with ¼ data set
| Fault Type | Line-Ground | Line-Line | Line-Line-Ground | Line-Line-Line | Average |
| TP | 0.989 | 0.962 | 0.840 | 0.856 | 0.912 |
| FP | 0.032 | 0.001 | 0.003 | 0.001 | 0.009 |
| Precision | 0.997 | 0.998 | 1.000 | 0.991 | 0.997 |
| Recall | 0.991 | 0.999 | 0.985 | 0.993 | 0.992 |
| F-Measure | 0.991 | 0.980 | 0.972 | 0.966 | 0.977 |
| ROC | 0.918 | 0.986 | 0.958 | 0.980 | 0.961 |
Table 14: NN performance with ¼ data set
| Fault Type | Line-Ground | Line-Line | Line-Line-Ground | Line-Line-Line | Average |
| TP | 0.992 | 0.942 | 0.966 | 0.981 | 0.971 |
| FP | 0.001 | 0.000 | 0.000 | 0.002 | 0.001 |
| Precision | 0.999 | 0.957 | 0.922 | 0.887 | 0.941 |
| Recall | 0.965 | 0.921 | 0.989 | 0.968 | 0.961 |
| F-Measure | 0.965 | 0.982 | 0.972 | 0.951 | 0.968 |
| ROC | 0.976 | 0.991 | 0.987 | 0.992 | 0.987 |
7. Conclusion
An increase in electricity demand has enlarged the technical variations of the load-demand phenomenon. To solve this problem external electricity sources have been considered. The environmental attributes of using REDG improves the quality of the air and thus contributing positively to the health of the people. However, integrating REDGs has technical challenges that must be addressed. In the present work, we focus on the fault diagnostic mechanism when the REDGs are integrated into the distribution system. An Eskom power system is modelled, and various fault studies are carried out. In the present work, a fault diagnostic technique is proposed. The method consists of the signal processing scheme, a feature extraction section, feature selection section, and a fault diagnostic section. The WPT is used to decompose the signal into frequency sub-bands, subsequently, the entropy and energy features are selected from the decomposed signal. From the selected features a feature selection scheme is used to select the best features to improve the computational time and reduce burden. The selected features are then fed into the SVM classifier to determine the fault occurrence in the network. The PSO algorithm is used to determine the best parameters of the SVM. We further investigated the effectiveness of other classification algorithms. From the results obtained the SVM classifier performed better with the accuracy of 99%. The future work will entail a fault location scheme in an integrated system.
- K. Kusakana, H. J. Vermaak and G. P. Yuma, “Optimization of hybrid standalone renewable energy systems by linear programming,” Advanced Science Letters, 19(4), 2501-2504, 2013. DOI: 10.1166/asl.2013.4948
- T. Dragicevic, “Model predictive control of power converters for robust and fast operation of AC microgrids,” IEEE Transaction on Power Electronics, 33(7), 6304-6317, 2018.DOI: 10.1109/TPEL.2017.2744986
- T. Dragicevic and M. Novak, “Weighting factor design in model predictive control of power electronic converters: An artificial neural network approach,” IEEE Transaction on Industrial Electronics), 1-12, 2018. DOI: 10.1109/TIE.2018.2875660
- P. M. S. Carvalho, P. F. Correia and L. Ferreira, “Distributed reactive power generation control for voltage rise mitigation in distribution networks,” IEEE Transaction on Power Systems, 23(2), 766-772, 2008. DOI: 10.1109/TPWRS.2008.919203
- W. E. Khttam and M. M. A. Salama, “Distributed generation technologies, definition and benefits,” IEEE Transaction on Power Systems, 71(2), 119-128, 2004 DOI: 10.1016/j.epsr.2004.01.006.
- A. M. Foley, P. G. Leahy, A. Marvuglia and E. J. McKeogh, “Current methods and advances in forecasting of wind power generation,” Renewable Energy, 37(1), 1-8, 2012. DOI: 10.1016/j.renene.2011.05.033
- K. Meng, H. Yang, Z. Y. Dong, W. Guo, F. Wen and X. Xu, “Flexible operational planning framework considering multiple wind energy forecasting service providers,” IEEE Transaction on Sustainable Energy, 7(2), 708-717, 2016. DOI: 10.1109/TSTE.2015.2497698
- M. N. Kabir, Y. Mishra, G. Ledwich, Z. Y. Dong and K. P. Wong, “Coordinated control of control-connected photovoltaic reactive power and battery energy storage systems to improve the voltage profile of a residential distribution feeder,” IEEE Transaction on Industrial Informatics, 10(2), 967-977, 2014. DOI: 10.1109/TII.2014.2299336
- Z. Y. Dong, M. Lu, Z. Lu and K. P. Wong, “A differential evolution based method for power system planning,” in IEEE International Conference on Evolutionary Computation, 2006 DOI: 10.1109/CEC.2006.1688646.
- D. Mlakic, H. R. Baghaee and S. Nikolovski, “Gibbs phenomenonbased based hybrid islanding detection strategy for VSC-based microgrids using frequency shift, THDU and RMSU,” IEEE Transactions on Smart Grids), 1-12, 2018. DOI: 10.1109/TSG.2018.2883595
- “IEEE Standard on Interconnecting Distributed Resources with Electric Power Systems,” IEEE Std. 1547, 2003.
- S. I. Jang and K. H. Kim, “An islanding detection method for distributed generations using voltage unbalance and total harmonic distortion of current,” IEEE Transactions on Power Delivery, 19(2), 745-752, 2014. DOI: 10.1109/TPWRD.2003.822964
- M. Khodaparastan, H. Vahedi, F. Khazaeli and H. Oraee, “A novel hybrid islanding detection method for inverter-based DGs using SFS and ROCOF,” IEEE Transactions on Power Delivery, 32(5), 2162–2170, 2017. DOI: 10.1109/TPWRS.2008.2007002
- X. Wang, W. Freitas, V. Dinavahi and W. Xu, “Investigation of positive feedback anti-islanding control for multiple inverter-based distributed generators,” IEEE Transactions on Power Systems, 24(2), 785-795, 2009. DOI: 10.1109/TPWRS.2008.2007002
- S. J. Huang and F. S. Pai, “A new approach to islanding detection of dispersed generators with self-commutated static power converters,” IEEE Transactions on Power Delivery, 15(2), 500-507, 2000. DOI: 10.1109/61.852975
- S. Salman, “New loss of mains detection algorithm for embedded generation using rate of change of voltage and changes in power factors,” in 7th International Conference on Developments in Power Systems Protection, 2001. DOI: 10.1049/cp:20010105
- A. Samui and S. R. Samantaray, “Assessment of ROCPAD relay for islanding detection in distributed generation,” IEEE Transactions on Smart Grid, 2(2), 391-398, 2011. DOI: 10.1109/TSG.2011.2125804
- S. Nikolovski, H. R. Baghaee and D. Mlakic, “Islanding detection of synchronous generator-based DGs using rate of change of reactive power,” IEEE Systems Journal, 99, 1-11, 2019. DOI: 10.1109/JSYST.2018.2889981
- A. S. Subhadra, P. Reddy and S. B. Modi, “Islanding detection in a distribution system with modified DG interface controller,” International Journal of Applied Power Engineering (IJAPE), 6(3), 135-143, 2017. DOI: 10.11591/ijape
- S. Cavalcante, P. R. Araujo, R. D. Keuton, Alvesa, F. B. Costa and T. O. A. Rochaa, “A wavelet-based hybrid islanding detection system applied for distributed generators interconnected to AC microgrids,” Electrical Power and Energy Systems, 121(2), 1-10, 2020. DOI: 10.1016/j.ijepes.2020.106032
- D. D. Reigosa, F. Briz, C. B. Charro and J. M. Guerrero, “Passive islanding detection using inverter nonlinear effects,” IEEE Transactions on Power Electronics, 32(11), 8434–8445, 2017. DOI: 10.1109/TPEL.2016.2646751
- M. Inci, “Active/reactive energy control scheme for grid-connected fuel cell system with local inductive loads,” Energy, 197(3), 1-15, 2004. DOI: 10.1016/j.energy.2020.117191
- A. T. Kolli and N. Ghaffarzadeh, “A novel phaselet-based approach for islanding detection in inverter-baseddistributed generation systems,” Electric Power Systems Research, 182(2), 1-9, 2020. DOI: 10.1016/j.epsr.2020.106226
- G. Wang, F. Gao, J. Liu, Q. Li and Y. Zhao, “Design consideration and performance analysis of a hybrid islanding detection method combining voltage unbalance/total harmonic distortion and bilateral reactive power variation,” IEEE Transactions on Power Electronics and Applications, 5(1), 86-100, 2020. 10.24295/CPSSTPEA.2020.00008
- M. C. Wrinch, “Negative sequence impedance measurement for distributed generator islanding detection,” University of Britich Columbia, Vancover, BC, Canada, 2008. DOI: 10.14288/1.0065504
- N. Liu, C. Diduch, L. Chang and J. Su, “A reference impedance based passive islanding detection method for inverter-based distributed generation system,” IEEE Journal of Emerging and Selected Topics in Power Electronics, 3(4), 1205-1217, 2015. DOI: 10.1109/JESTPE.2015.2457671
- S. S. Madani, Abbaspour, M. Beiraghi, P. Z. Dehkordi and A. M. Ranjbar, “Islanding detection for PV and DFIG using decision tree and AdaBoost algorithm,” in 3rd IEEE PES Innovative Smart Grid Technologies Europe, Berlin, Germany, 2012. DOI: 10.1109/ISGTEurope.2012.6465818
- F. Bignucolo, A. Raciti and R. Caldon, “Coordinating active and reactive energy balances in islanded networks supported by renewables and BESS,” in 3rd Renewable Power Generation Conference, Naples, Italy, 2014. DOI: 10.1049/cp.2014.0824
- I.Phafula, E. D. M. Koch and K. Nixon, “Preliminary Study of Fault Detection on an Islanded Microgrid Using Artificial Neural Networks,” in IEEE 2020 International SAUPEC/RobMech/PRASA Conference, Cape Town, South Africa, 2020. DOI: 10.1109/SAUPEC/RobMech
- M. Khodaparastan, H. Vahedi, F. Khazaeli and H. Oraee, “A novel hybrid islanding detection method for inverter-based DGs using SFS and ROCOF,” IEEE Transactions on Power Delivery, 32(5), 2162–2170, 2017. DOI: 10.1109/TPWRD.2015.2406577
- S. R. Samantaray, K. El-Arroudi, G. Joos and I. Kamwa, “A fuzzy rule-based approach for islanding detection in distributed generation,” IEEE Transactions on Power Delivery, 25(3), 1427–1433, 2010. DOI: 10.1109/TPWRD.2010.2042625
- D. Mlakic, H. R. Baghaee and S. Nikolovski, ““A novel ANFIS-based islanding detection for inverter–interfaced microgrids,” IEEE Transactions on Smart Grid, 99, 1-13, 2018. DOI: 10.1109/TSG.2018.2859360
- P. Kumar, V. Kumar and B. Tyagi, “A Novel Islanding Detection Technique Based on Event Index Value for Reconfigurable Microgrid,” in IEEE International Conference on Power Electronics, Smart Grid and Renewable Energy , Cochin, India, 2020. DOI: 10.1109/PESGRE45664.2020.9070479
- A. Garg, A. Sinha, M. J. B. Reddy and D. K. Mohanta, “Detection of islanding in microgrid using wavelet-MRA,” in IEEE Conference on Power, Control, Communication and Computational Technologies for Sustainable Growth, Kurnool, India, 2015. DOI: 10.1109/PCCCTSG.2015.7503917
- M. Mishra and P. K. Rout, “Detection and classification of micro-grid faults based on HHT and machine learning techniques,” IET Generation, Transmission & Distribution, 12(2), 388–397, 2018. DOI: 10.1049/iet-gtd.2017.0502
- J. Li and Y. Guo, “Support vector machine based fault detection and diagnosis for HVAC systems,” International Journal of Intelligent Systems Technologies and Applications, 18(2), 204-222, 2019. DOI: 10.1504/IJISTA.2019.097752
- H. R. Baghaee, D. Mlakić, S. Nikolovski and T. Dragičević, “Support Vector Machine-based Islanding and Grid Fault Detection in Active Distribution Networks,” IEEE Journal of Emerging and Selected Topics in Power Electronics, 3(15), 1-19, 2019. DOI: 10.1109/JESTPE.2019.2916621
- F. Mohammadi, G. A. Nazri and M. Saif, “A Fast Fault Detection and Identification Approach in Power Distribution Systems,” in IEEE 2019 International Conference on Power Generation Systems and Renewable Energy Technologies (PGSRET), Istanbul, Turkey, 2019. DOI: 10.1109/PGSRET.2019.8882676
- V.Ashok, A. Yadav and A. Y. Abdelaziz, “MODWT-based fault detection and classification scheme for cross-country and evolving faults,” Electric Power Systems Research, 175, 1-20, 2019. DOI: 10.1016/j.epsr.2019.105897
- A. Mohamed, B. Younes, T. Lamhamdi, H. E. Moussaoui and H. E. Markhi, “Fault Location and Isolation Technique in Smart Distribution Systems with Distributed Generation,” in IEEE 1st International Conference on Innovative Research in Applied Science, Engineering and Technology (IRASET), Meknes, Morocco, 2020. DOI: 10.1109/IRASET48871.2020.9092095
- P. J. Rivera-Torres and O. L. Santiago, “Fault Detection and Isolation in Smart Grid Devices Using Probabilistic Boolean Networks,” Computational Intelligence in Emerging Technologies for Engineering Applications, 872, 165-185, 2020. DOI: 10.1007 /978-3-030-34409-2_10
- H. H. Alhelou, M. E. H. Golshan, N. D. Hatziargyriou and M. P. Moghaddam, ” Novel Unknown Input Observer-based Measurement Fault Detection and Isolation scheme for Micro-Grid Systems,” IEEE Transactions on Industrial Informatics, 15(3), 1-10, 2020. DOI: 10.1109/TII.2020.2970211
- P. Ray and D. P. Mishra, “Support vector machine based fault classification and location of a long transmission line,” Engineering Science and Technology, an International Journal, 10, 1368-1380, 2016. DOI: 10.1016/j.jestch.2016.04.001
- K. Thirumala, A. Kanjolia, T. Jain and A. C. Umarikar, “Empirical wavelet transform and dual feed-forward neural network for classification of power quality disturbances,” International Journal of Power and Energy Conversion , 11(1), 1-19, 2009. DOI: 10.1504/IJPEC.2020.104805
- M. Dashtdar, M. Esmaeilbeig, M. Najafi and M. E. N. Bushehri, “Fault Location in the Transmission Network Using Artificial Neural Network,” Automatic Control and Computer Sciences, 54(1), 39-51, 2020. 10.3103/S0146411620010022
- D. Mourada and E. H. Shehab_Eldinb, “An enhanced ground fault selection and distance measurement approach for single and double circuit fixed series compensated transmission line,” Electric Power Systems Research, 187(3), 1-11, 2020. DOI: 10.1016/j.epsr.2020.106495
- S. Luo, W. Yang and H. Tang, “A novel feature selection method toboost variable predictive model–basedclass discrimination performance andits application to intelligent multi-faultdiagnosis,” Expert Systems Application, 53(2), 104–118, 2020. DOI: 10.1177/0020294019877497
- T. T. Le, R. J. Urbanowicz, J. H. Moore and B. A. McKinney, “Statistical Inference Relief (STIR) feature selection,” Journal of Bioinformatics, 35(8), 1358-1365, 2020. DOI: 10.1093/bioinformatics/bty788
- P. D. Raval and A. S. Pandya, “A Novel Fault Classification Technique in Series Compensated Transmission Line using Ensemble Method,” International Journal of Pattern Recognition and Artificial Intelligence, 34(4), 1-18, 2020. /DOI: 10.1142/S0218001420500093
- H. A. FayedabAmir and F. Atiyac, “Speed up grid-search for parameter selection of support vector machines,” Journal of Applied Soft Computing, 80(4), 202-210, 2019. DOI: 10.1016/j.asoc.2019.03.037
- R. Eberhart and J. Kennedy, “A new optimizer using particle swarm theory,” in Sixth Internationlal Synposium on Micro Machine and Human Science , 1995 DOI: 10.1109/MHS.1995.494215.
- A. H. Jahromi and M. Taheri, “A non-parametric mixture of Gaussian Naive Bayes classifiers based on local independent features,” in Artificial Intelligence and Singnal Processing Conference (AISP), Shieaz, 2017. DOI: 10.1109/AISP.2017.8324083
- A. Trabelsi, Z. Elouedi and E. Lefevre, Decision tree classifiers for evidential attributes values and class labels, Fuzzy Sets Systems, 2018. oi.org/DOI: 10.1016/j.fss.2018.11.006
- J. Gui, T. Liu, D. Tao, Z. Sun and T. Tan, “Representative vector machines: a unfified framework for classical classifiers,” IEEE Trans. Cybern, 46(8), 1877-1888, 2016. DOI: 10.1109/TCYB.2015.2457234