Development of an Adaptive HVAC Fuzzy Logic Controller for Commercial Facilities: A Case Study

Adv. Sci. Technol. Eng. Syst. J. 5(4), 531–539 (2020);
 DOI: 10.25046/aj050463
This paper is a case study of the integration of an energy management system (EMS) in a commercial building. A detailed analysis of this EMS’s impact on energy consumption is presented. High energy demand is very common in commercial and industrial facilities. With this in mind, the present work aims to improve the energy consumption rate within a commercial facility by proposing an energy management system based on a central fuzzy logic controller. Thus, the central controller adapts the energy management to a pre-established schedule taking at consideration primarily the Heating, Ventilation and Air Conditioning (HVAC) of the targeted building.
1. Introduction
The energy consumption is growing considerably in recent years making global warming and climate change an everlasting threat. Commercial activities and individual lifestyles directly impact the energy demand [1], [2]. Therefore, it is very important to exploit energy in a more efficient way without altering the desired comfort [3]-[7]. Heating, Ventilation and Air-Conditioning systems (HVAC) maintain a good indoor air quality through adequate ventilation and provide thermal comfort. However, HVAC systems are among the most energy demanding components within buildings [1], [8]. These elements require about 40% of the overall energy demand causing an excessive and rapid increase in energy consumption leading to a harmful impact on the global environment [3], [9]. In addition, energy consumption is more substantial in residential and commercial facilities [10]. The energy consumption is around 18% in commercial buildings while it is 22% in residential ones for the same components architecture [2], [11]. This energy requirement is due to the poor design and thermic insolation of existing classic commercial buildings and population general behavior [2], [8], [12]. Consequently, new energy efficient technologies and applications are emerging as a key solution capable of facing the building performance challenge [7], [11]-[13]. Furthermore, researchers recently, focus on the management and control of energy in buildings using active control systems within the buildings [8]. Their primary interest is to realize sustainable energy savings, while improving the energy efficiency and maintaining a proper comfort conditions [14-19]. In this scope, the current work is a case study where we propose a new approach to optimally manage energy in a typical commercial facility. In this building, we establish a very specific controlling algorithm in order to reduce the energy consumption as much as possible. The integrated system targets basically the management of loads following various parameters. In addition to the electrical loads, the proposed controller takes account of other parameters such as the building architecture, customers flow, internal and external temperature, energy consumption behavior. The building architecture and load structure is first described. Then, the HVAC components and specification are briefly presented. Moreover, the energy saving methodology is described and the design and modeling of the Fuzzy logic controller is well depicted in addition to the simulation results and analysis.
2. Building description and component models
2.1. Outline description
In a commercial facility, the two main energy-consuming loads are light and the HVAC system. Figure 1 summarizes an analysis study conducted on commercial buildings of the same type with a surface between 1,000 m² and 3,000 m² and present the average loads consumption of these commercial buildings. As shown in Figure 1, the HVAC system consumes about 58% of the total energy; a huge amount compared with the other categories. The lighting system consumes about 17%, followed by office devices with 15% consumption and only 10 % for all the other instruments.
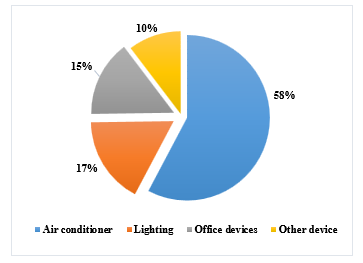 Figure 1: Electrical loads distribution in commercial buildings
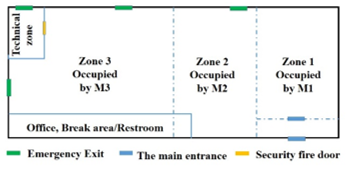 Figure 2: zoning of the HVAC system
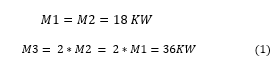
The present case study studies a commercial building located at Oujda, Morocco (34° 40′ 48” N, 1° 54′ 36” W). Oujda city has a Mediterranean climate with a cold, rainy winter and a hot summer. The average annual temperatures are between 15°C and 20 °C. The average temperature in summer is 35 °C and can reach 40 °C. Unlike winter, the average temperature is 18 °C and minimal temperature can drop under 0°C. The building was opened in December 2016, extending over an area of 1600 m², the monthly average electrical consumption is 11879 kWh. The commercial building is equipped with LED lighting system. The HVAC system is divided to three Modules M1, M2 and M3 as presented in Figure 2. The first and second modules control 25 % of the buildings each, the third one is responsible for the rest. The electrical power of the HVAC system is 72KW in average, total power can be divided as follows:
 In a typical commercial store environment, the parameters such as customer flow, collaborators number may be taken into consideration beside internal and external temperature. Indeed, these parameters can be used to assess more details related to the energy consumption. Different works have studied their effect on the overall user’s comfort and building profitability [8, 15].
2.2. Modeling approach
So far, several reviews have been published on modeling methods [20-23], control approaches [24 – 26] and optimization techniques [26]. Besides HVAC systems simple modeling and practical energy savings, recent works target the evaluation of overall system performance [27]. The HVAC modeling techniques are widely discussed in the review study conducted in [28]. The presented models have been classified into three different categories physics-based model, data-driven model and gray-box model. Authors have concluded that each model category has both strengths and weaknesses and none of those models could be commonly used as HVAC system modeling. However, authors recommend to select the most suitable modeling technique based on the case study. In the present study, the modeling approach was carried out according to the commercial building specifications and the required energy ( ) to meet the loads demand of the building. The global data taken at consideration consist of internal parameters (people, HVAC, lighting) and external ones (sun, air, moisture). Thus, the energy need can be written as:
![]() Where represents the energy losses through envelope components of the building and depicts the ventilation/infiltration losses. The energy losses consist of energy transfer outwards from the building in terms of conduction ( ) through envelope components (roof, walls, glazing, ground), ventilation by the HVAC equipment ( ), and infiltration process ( ). This energy can be defined as:
Where represents the energy losses through envelope components of the building and depicts the ventilation/infiltration losses. The energy losses consist of energy transfer outwards from the building in terms of conduction ( ) through envelope components (roof, walls, glazing, ground), ventilation by the HVAC equipment ( ), and infiltration process ( ). This energy can be defined as:
![]() While, energy gain is the useful energy to the building from occupants ( ), lighting equipment ( ) and sun ( ). This can be written as:
While, energy gain is the useful energy to the building from occupants ( ), lighting equipment ( ) and sun ( ). This can be written as:
![]() Based on the studied building specifications, some energy losses could be neglected for simplicity purposes. Therefore, the building conditioning system can be described by energy balance model [29] as follows:
Based on the studied building specifications, some energy losses could be neglected for simplicity purposes. Therefore, the building conditioning system can be described by energy balance model [29] as follows:
![]() Where and are respectively the building inside and outside temperature at the time sequence , is the inside temperature at the time sequence , represents the electric power input at . , and represent respectively the inertia factor, the overall thermal conductivity and the thermal conversion efficiency. The term “ ” in “equation (5)” means that the operator “ “ is used when the HVAC is on cooling mode and “ ” when heating.
Where and are respectively the building inside and outside temperature at the time sequence , is the inside temperature at the time sequence , represents the electric power input at . , and represent respectively the inertia factor, the overall thermal conductivity and the thermal conversion efficiency. The term “ ” in “equation (5)” means that the operator “ “ is used when the HVAC is on cooling mode and “ ” when heating.
3. Energy saving Methodology
3.1. Energy repartition in typical buildings
Authors in [2] propose a review on large-scale energy saving studies. The work deals with the governments energy policies capable of generating noticeable energy savings. Authors also propose a scientific approach for quantifying the potential energy savings by improving the customer operations planning in commercial buildings. The study associates between energy modeling techniques, studies on human behavior in buildings exploitation activities, surveying and sampling methods.
In commercial buildings, less than 50% of office equipment are switched off during off-work hours [1], [2]. In the present case, we also investigate the application of eco-energetic protocols in both operating and non-operating hours. The present study confirmed that the use of traditional eco-energy methods and protocols could save up to 60% of the monthly electric energy consumption. Moreover, authors in [3] confirmed that in HVAC systems, the average energy saving is generally 20–60%, lighting (20–50%), water heating (20–70%) and refrigeration (20–70%). Consequently, it is estimated that in new buildings, an energy economy of up to 50% can be achieved. In almost all cases, HVAC shows the highest share of energy savings, especially in small buildings where HVAC typically accounts for the major portion of the energy use [8], [2].
3.2. Operations time slots
The general electricity cost is not solely related to the total electricity consumption; the daily consumption periods noticeably affect the energy consumption budget [30]. The electricity consumption during a time slot is related to the number of costumers during that period and the classic exterior climate conditions.
In this work, the energy consumption fees are divided into three time slots, each one corresponds to a specific cost. According to [ 31], there are generally three classic time slots: Off-Peak hours, Peak hours, and Full hours. We have closely studied each period in order to understand the evolution of the energy consumption in each slot. This allows us to propose a schedule for the operation of the HVAC system. Table 1 illustrate the difference between the three time slots, and their consumption cost.
Table 1: General time slots in low voltage power subscription
| Time slots | Period | Billing | Subscription cost (MAD/KVA) | ||
| October -March | April-September | Cost (MAD/kWh) | 494 | ||
| Peak-Off hours (T1) | 22h-7h | 23h-7h | C1 | 0,648 | |
| Peak hours (T2) | 7h-17h | 7h-18h | C2 | 0,886 | |
| Full hours
(T3) |
17h-22h | 18h-23h | C3 | 1,241 | |
Figure 3 presents records of the monthly consumption in the studied building. The available records in the study are dispatched on 6 months only: from December 2016 to May 2017.
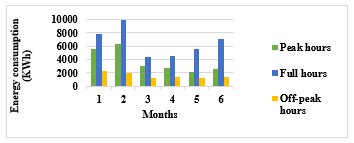 Figure 3: Energy consumption by slot in KWH
During winter season, we have an early sunset which causes a rapid drop in temperature in the evening. Figure 3 illustrates the impact of winter season on the consumption during the designed time slots. As the figure illustrates, the power consumption is at its peak during the Full hours between December and January. This change in consumption is due to the alteration in customers’ flow which increases between 5 pm and 9 pm. On the other hand, during the Off-Peak hours, the energy consumption is very low because during closing time, the building consumes a minimum of the energy. The function cost in this system is essentially based on three variables and can be expressed as:
![]() Where is the actual operating time slot, is related to the number/costumer flow change and is related to the external temperature. The control system aims to reduce as much as possible the cost function (6). In order to grasp the whole concept, the cost function can be expressed in more details as follows:
Where is the actual operating time slot, is related to the number/costumer flow change and is related to the external temperature. The control system aims to reduce as much as possible the cost function (6). In order to grasp the whole concept, the cost function can be expressed in more details as follows:
![]() Where and are variables related to the cost function factors. These variables are subject to seasonal changes and power generation cost in the region. “equation (6)” and “equation (7)” are related by the following equation:
Where and are variables related to the cost function factors. These variables are subject to seasonal changes and power generation cost in the region. “equation (6)” and “equation (7)” are related by the following equation:
![]() Figure 4 and 5 illustrate the variation of the costumer flow and external temperature from 8 am to 10 pm and during a whole 24h period respectively.
Figure 4 and 5 illustrate the variation of the costumer flow and external temperature from 8 am to 10 pm and during a whole 24h period respectively.
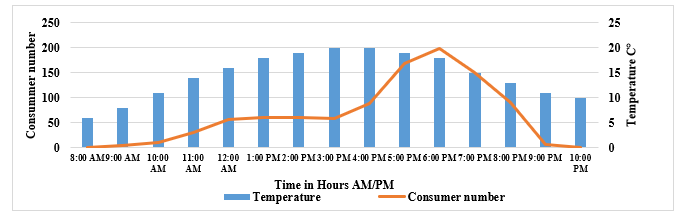 Figure 4: variation of costumer flow and external temperature from 8 am to 10 pm
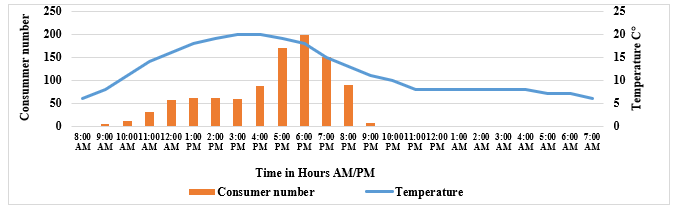 Figure 5 : variation of costumer flow and external temperature during a 24h period.
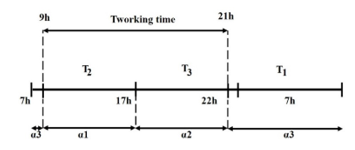 Figure 6: standard working day cost variables
The difference in costumers’ flow in Figure 4 and 5 shows that controlling the HVAC system during off-work periods is not necessary and can guarantee a considerable energy savings. Furthermore, the work conditions, and costumers’ availability are season dependent, thus, the total working time and periods of high activity change gradually along the year. Figure 6 shows the general segmentation of the working time and cost function factors for the studied case.
are directly related to the cost function and represent the portion of time when energy can be represented as entirely consumed inside slots.
![]() On Figure 6 the total working time can be written as:
On Figure 6 the total working time can be written as:
![]() Standard conditions in the present case study where , and , the total working time . At this point, it is clear that the working time, population condition and external conditions should be controlled depending on time segment. Authors in [ 32] the use of PID as control strategy for HVAC systems which resulted in in a high energy consumption. Whereas, in the same study, authors found that the use of HVAC control method presents the most promising results in terms of energy efficiency.
Standard conditions in the present case study where , and , the total working time . At this point, it is clear that the working time, population condition and external conditions should be controlled depending on time segment. Authors in [ 32] the use of PID as control strategy for HVAC systems which resulted in in a high energy consumption. Whereas, in the same study, authors found that the use of HVAC control method presents the most promising results in terms of energy efficiency.
3.3. HVAC Controllers principle
The HVAC system being the key component to energy saving in commercial buildings, studies investigate multiple control strategies in order to encourage their implementation [8,28, 33]. Numerous recent studies have given an emphasis on improving the HVAC system through advanced control algorithms rather than classic control methods [28, 34]. Thus, some control strategies manage the HVAC system based on a day-ahead electricity price and outdoor temperature forecast [30]. Furthermore, existing controllers are generally classified into two major categories: predictive and adaptive controllers [16]. The study in [ 28] offers a critical overview of the modeling technics currently used in HVAC systems with regard to their applicability and acceptance in real practice, the study also summarizes the weaknesses, applications and services of the modeling technics. Authors in [27] present a study where they examine the performance of each HVAC unit, while evaluating the energy consumption and efficiency of each control technic (FLC, PID and simple ON/OFF time slots).
Control policies, also, can be categorized into two major types: model based and data driven [ 35]. Model-based control strategies require mathematical models as much as the building and the HVAC system specifications to generate minimal control rules. The data driven HVAC control strategies operate by adjusting the management parameters. In [28] authors offer a fairly global review on the different algorithms used to improve the HVAC energy management systems. Most used ones are the data mining algorithms, the Artificial Neutral Network (ANN) and the Support Vector Machine (SVM). The work in [27] compared between classic ON/OFF method, PID, Fuzzy logic, Agent based and neural network control. Related to the present case study, we have chosen to base the exploited control strategy on the fuzzy logic system given the promising results obtained [23-27]. Moreover, since the operation of HVAC systems is not linear, classic controllers not suitable for exploitation in such facilities. The common components of Fuzzy Logic Controller (FLC) attached to HVAC systems are well illustrated as block diagrams in various works [27, 36, 37].
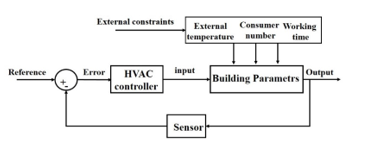 Figure 7: HVAC general control model
The implementation of fuzzy logic based methods requires a qualitative distribution of the inputs and outputs ranges by establishing a direct link to the different comfort zones sought for the clients visiting the facility. Several research works have analyzed this particular point, hence pushing us to adapting the same approach based on the facility’s schedule in present case study [38, 39]. Figure 7 presents a control model of the studied building that depends on the external temperature, consumer number, working time. The three zones of the building are controlled via the Fuzzy logic program taking for each section the main three parameters described before.
4. The proposed design for the Fuzzy logic controller
4.1. Overall description of fuzzy logic controller
The temperature control is achieved by integrating several parameters such as temperature and humidity inputs[38, 39]. In this case study, we implemented two inputs in the designed model; temperature and number of clients. During the test period, we consider that time slots configuration remains unchanged [40- 42]. Figure 8 illustrates the design adopted in present case study. As it can be understood from the figure, temperature variations and clients’ density inside the building are the inputs while the heating or cooling actions represent the outputs. This design is applied to each module zone depending on costumers flow and the frequency of temperature variation.
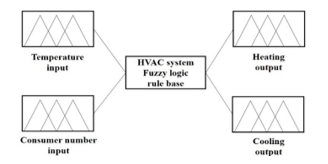 Figure 8: the proposed design of the fuzzy logic controller
In order to enhance the management strategy each of the customers’ flow, opening hours and the temperature is regularly updated by keeping a close feed on present season and any other sudden variations such as vacation periods and time zone change.
4.2. Input variables’ design
- Membership function for the temperature management
In order to establish the membership of temperature variation inputs we used the local weather data registered over the previous year. The sections of temperature vary between very cold conditions when temperatures are less than 14°C and hot conditions when temperatures are above 38°C in Oujda city.
For the temperature membership function, it is divided into five ranges as described in Table 2. The “Too cold range” is reserved for any value below 14°C. For the “Cold” range between 7 and 23°C, “Warm” is the range of 15 and 30°C, the “Hot” range between 23 and 38 °C and the final range “Too Hot” above 38 °C. This segmentation was the key to designing the Ranges of temperature inputs in the fuzzy logic model as presented in Figure 9.
The definition or this partition of the membership function ranges, depends on the region and its climatic conditions. That means if we have another case of study in another region the value of the range may change in term of the variation of the local weather data.
Table 2 : Temperature membership functions
| Membership functions | Range (C°) |
| Too cold | Below 14 |
| Cold | 7-23 |
| Warm | 15-30 |
| Hot | 23-38 |
| Too Hot | Above 38 |
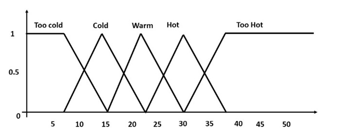 Figure 9 : Ranges of temperature inputs
- Membership function for the costumers’ flow
In this case of study costumers flow is a primary factor in the proposed commercial building EMS. In this perspective, Table 3 shows that the number of membership functions is organized into five categories of clients’ density. The same process as the temperature input was applied for the consumer flow input.
Where the “Very low” range is reserved for 1 to 15 persons followed by the “Low” range between 10 and 30 persons, “Medium” range between 20 and 80 costumers, the “High” range between 60 and 150 peoples and the final range “Very high” is reserved for 120 to 250 costumers. The definition or this partition depends on the region, the building size and the most import the data of the costumers’ flow of the previous years to define the average number of people in each single range. In Figure 10 presents the ranges of clients’ density inputs implemented in fuzzy logic model.
Table 3 : Clients’ density membership functions
| Membership functions | Range (number) |
| Very low | 1-15 |
| Low | 10-30 |
| Medium | 20-80 |
| High | 60-150 |
| Very high | 120- 250 |
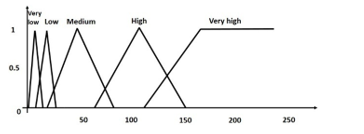 Figure 10: Ranges of clients’ density inputs
4.3. Output variables’ design
Membership functions and ranges are supposed to be similarly designed for each of the units M1, M2 and M3 constituting the HVAC system. Each unit is endowed with its own sensors and aeration control. The author in [17] describes the design of room temperature and humidity controller using Fuzzy Logic. He considered almost the same model of the distribution of the membership functions except that it was categorized in different ranges for cooling and heating functions.
Table 4 : Controller Output membership functions
| Membership functions | Range |
| OFF | 0-0.05 |
| Slow | 0-0.45 |
| Medium | 0.35-0.65 |
| Fast | 0.6-1 |
For this case of study, the Output membership function is organized in four ranges (OFF, Slow, Medium and Fast) into the interval of 0 and 1, either for the cooling or the heating controller output. The used control output in this case study is achieved by adopting two outputs with the same interval functions as illustrated on Table 4 and Figure 11.
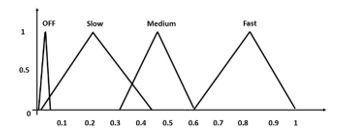 Figure 11: Fuzzy representation of the output membership
4.4. Rule base
The rule base describes the laws and conditions governing the activation of the heating/ventilation system in all the sections , and . Table 5 presents the fixed rules obtained after several operation tests in HVAC system. The control’s rule base in Table 5, shows different possible decision making by the fuzzy logic system for different inputs range, and the considered decision that the fuzzy logic control will made based on the previous input and output membershi
For example, if the Number of consumers is high (between 120-250 consumer) and the temperature is Too Hot (above 39 °C), the decision of the fuzzy logic controller for the three units will be:
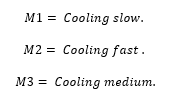 Figure 12 presents a planning example based on the fuzzy logic controller decision. Figure 12 presents a one planning example based on a recorded set of data during summer. During morning working hours M1, M2 and M3 are generally all occupied by workers and store staff, this is why they are all initially activated in order to guarantee minimum comfort conditions. Indeed, between 10h and 12h in the example above, M3 is activated using medium cooling mode because temperature is above 38°C and clients are between 30 and 50 individuals.
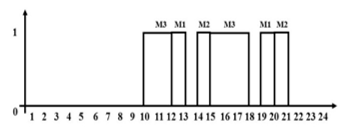 Figure 12 : Example of a HVAC control Schedule
From 12h to 13h, we notice that M3 is still activated but with a change in operating mode (cooling fast) and M1 is initiated in cooling medium. This decision is primarily related to the temperature and clients’ number, however M1 will be rapidly switched off, because the controller anticipates the thermal exchange between the units of the building. The same procedure is followed throughout the day; the controller adapts the internal temperature to the external temperature and clients’ number.
Table 5 : Control’s rules base
| Number of consumers | Temperature C° | ||||
| Too cold | Cold | Warm | Hot | Too-Hot | |
| Very low | M1=OFF
M2= Heating slow M3= Heating Slow |
M1=OFF
M2=OFF M3=OFF |
M1=OFF
M2=OFF M3=OFF |
M1=OFF
M2=OFF M3=OFF |
M1=OFF
M2=OFF M3=OFF |
| Low | M1=OFF
M2=OFF M3= Heating fast |
M1=OFF
M2=OFF M3= Heating fast |
M1=OFF
M2=OFF M3=OFF |
M1=OFF
M2= Cooling medium M3=OFF |
M1=OFF
M2=OFF M3= Cooling medium |
| Medium | M1=Heating slow
M2=OFF M3= Heating medium |
M1=OFF
M2= Heating medium M3=OFF |
M1=OFF
M2=OFF M3=OFF |
M1=OFF
M2=OFF M3=OFF |
M1=OFF
M2=OFF M3=OFF |
| High | M1=OFF
M2= Heating medium M3=OFF |
M1=OFF
M2= Heating slow M3=OFF |
M1=OFF
M2=OFF M3=OFF |
M1=OFF
M2=OFF M3= Cooling medium |
M1= Cooling slow
M2= Cooling medium M3= Cooling fast |
| Very high | M1=OFF
M2=OFF M3=OFF |
M1=OFF
M2=OFF M3=OFF |
M1=OFF
M2= Cooling slow M3=OFF |
M1=OFF
M2= Cooling medium M3= Cooling fast |
M1= Cooling slow
M2= Cooling fast M3= Cooling medium |
5. Study results and analysis
5.1. Impact of the proposed schedule on the fuzzy logic controller
Figure 13 illustrates the impact of adopting the fuzzy logic controller on electric consumption fees of the building, the first month corresponds to December 2016 and number 20 to July 2018.
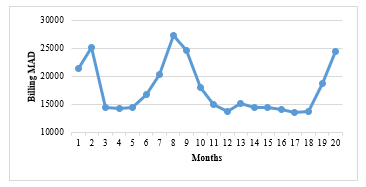 Figure 13: Monthly energy consumption fees in MAD
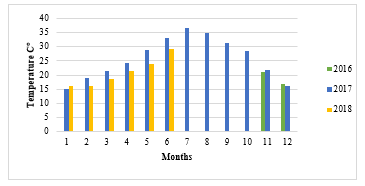 Figure 14: Collected temperature data of the city of Oujda [18].
The control model has been commissioned on June 2017, however it can be seen that there is an increase in power consumption in the month of July 2017 because of the high ambient temperature during the season period and laps of temporary suspension of the controller for technical adaptation. Moreover, the high energy consumption during summer season still poses a technical difficulty even after commissioning the proposed controller. Despite this stiffness we established that a steady decrease of 9.71% energy consumption has been achieved compared with the same period of the previous year. In Figure 14 month corresponds to January and number 12 to December of each corresponding year.
Related to the present case study, we can undoubtedly assume that promising and palpable results have been noticed after only two months from the first introduction of the fuzzy controller. After the first testing period it has been reported to us that the facility has achieved a 30% energy gain. Table 6 presents the recorded energy profit during the testing periods of 2017 and 2018. The recorded gains were calculated based on the following equations:
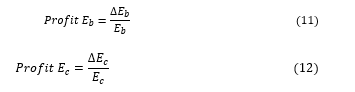 Where is the energy consumption in and is the energy fees in . As it can be seen on Table 6 substantial energy gains have been made which proves the efficiency of the developed controller.
5.2. System simulation and behavior
The ingenuity of the proposed controller is its ability to manage the three areas of the commercial building separately, while taking at consideration the thermal exchange between the three units.
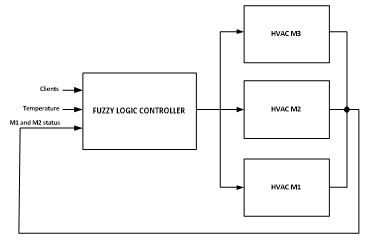 Figure 15: Simulation principle of the fuzzy logic controller
Table 6 : Recorded energy profit during testing periods of 2017 and 2018
| Month | Energy consumption KWh | Profit | ||
| 2017 | 2018 | Profit (EC) | Profit (Eb) | |
| January | 18178 | 8606 | + 52,66% | +43% |
| February | 8673 | 8718 | – 0,52% | + 0,15% |
| March | 8649 | 8338 | + 3,6% | + 2,13% |
| April | 8862 | 8128 | + 8,28% | + 5,2% |
| May | 11033 | 8387 | + 23,98% | + 17,9% |
| June | 14783 | 12651 | + 14,42 % | + 7,42% |
| July | 20494 | 17818 | + 13,06% | + 10,41% |
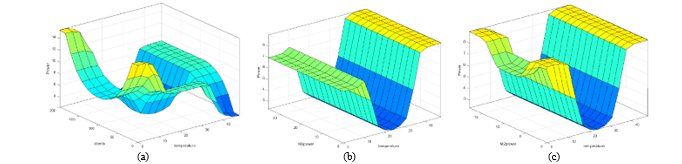 Figure 16: Variation of M1 HVAC power according to (a) ambient temperature and client’s movement, (b) temperature and M3 HVAC power, (c) temperature and M2 HVAC power
Thus, the system, adapts the needed power for air conditioning purpose while exploiting at the same time the already deployed power in the other units. M3 requires the largest share of energy, this is why, during long periods of harsh temperature difference between the inside and the outside of the building, this unit is the main preserver of comfort inside the building. Figure 15 presents the simulation principle of the proposed controller. The controller doesn’t simply adapt the inside ambient temperature based on defined set-points and external conditions, but it also exploits the possibility of under-powering M1 or M2 when the conditions are beneficial. Figure 16 presents all the possible cases for powering M1 based on the external temperature, clients’ movement inside the store and power status of the HVAC system in M2 and M3.
As it can be seen on Figure 16 above, M1’s HVAC system is only activated in extreme cases of temperature and clients’ movement Figure 16 (a). Since the controller exploits the thermal exchange between the building units, power required in the middle of the day is greatly decreased. Furthermore, it can be noticed on Figure 16 (b) and (c) that during normal operating conditions, dissipated power of M1’s HVAC system is greatly reduced, since M2 and M3 can help stabilize temperature inside the building.
6. Conclusion
In this paper, the design and implementation of a new Fuzzy logic controller was introduced into a commercial facility in Morocco. The case study presents how the building was functioning before and how the HVAC system was the primary drainer of energy during infrastructure analysis. The article describes how an appropriate modeling approach was designed in order to assess and quantify the energy loss during each month of the year. Furthermore, the article founded the energy saving methodology on existing research works. Thus, the working time was distributed into operating time slots, each with its own working characteristics defined by workers and visitor’s dynamics. Particularly, in the present case study, special variables were introduced to cover the season time change and personnel interaction with the visitors and clients in the facility. This design allows the HVAC system to adapt automatically to the season without undergoing any change by the management team. During the design phase, input and output variable were carefully selected to minimize the number of uncontrolled events, especially during season shifts.
This case study showed very promising results in terms of energy saving and smoothness in HVAC control. For instance, the integration of this particular controller granted the facility a 20% steady energy savings during the first official test period. The presented controller can also help HVAC oversizing errors caused by classic design methodologies, thus limiting the maximum power subscription. Besides, by taking additional measures such as population flow control and energy efficiency ethics among working staff, a more substantial gain can be achieved. In the upcoming work, we intend to investigate how categorizing areas in the facility, each with its own control strategy, can affect the HVAC system in terms of energy economy.
- E. Delzendeh et al., “The impact of occupants’ behaviours on building energy analysis: A research review” Renewable and Sustainable Energy Reviews, 80, 1061–1071. doi:10.1016/j.rser.2017.05.264.
- A. Elie, et al., “A Comprehensive Framework to Quantify Energy Savings Potential from Improved Operations of Commercial Building Stocks”, Energy Policy, 67, avril 2014, 459 72. DOI.org, doi:10.1016/j.enpol.2013.12.031.
- V.S.K.V. Harish, A. Kumar, “A Review on Modeling and Simulation of Building Energy Systems” Renewable and Sustainable Energy Reviews, 56, avril 2016, 1272 92. DOI.org, doi:10.1016/j.rser.2015.12.040.
- P. Jianli, “A Survey of Energy Efficiency in Buildings and Microgrids using Networking Technologies”, IEEE Communications Surveys & Tutorials, 16(3), 2014, 1709 31. Doi:10.1109/SURV.2014.060914.00089.
- R. Rajeev et al., “Improving the Energy Efficiency of the Existing Building Stock: A Critical Review of Commercial and Institutional Buildings”, Renewable and Sustainable Energy Reviews, 53, janvier2016, 1032 45. Doi:10.1016/j.rser.2015.09.084.
- C. Jinbao et al., “Improving Energy-Efficiency in Public Buildings in China: Challenges and Solutions”, 2009 International Conference on Computational Intelligence and Software Engineering, IEEE, 2009, 1 5. Doi:10.1109/CISE.2009.5362887.
- E.G. Ochieng, “Integration of Energy Efficient Technologies in UK Supermarkets”, Energy Policy, 67, avril 2014, 388 93. Doi:10.1016/j.enpol.2013.12.002
- L. Pérez-Lombard, “A review on buildings energy consumption information. Energy and Buildings”, 40(3), 394–398. doi:10.1016/j.enbuild.2007.03.007
- A. Šimelytė, “Promotion of renewable energy in Morocco. Energy Transformation Towards Sustainability”, 249–287, 2020. doi:10.1016/b978-0-12-817688-7.00013-6
- S. D’Oca, T. Hong, J. Langevin, “The human dimensions of energy use in buildings: A review”, Renewable and Sustainable Energy Reviews, 81, 731–742, 2017. doi:10.1016/j.rser.2017.08.019
- L. Yanfei, Z. O’Neill, “A Critical Review of Fault Modeling of HVAC Systems in Buildings”, Building Simulation, 11(5), October 2018, 953 75, 2018. DOI.org, doi:10.1007/s12273-018-0458-4.
- A.M. Waseem, et al., “Computational Intelligence Techniques for HVAC Systems: A Review”, Building Simulation, 9(4), août 2016, 359 98. Doi:10.1007/s12273-016-0285-4.
- H.S. Mehdi, A Novel Intelligent Control of HVAC System in Smart Microgrid, Journal of Electrical Systems and Information Technology, 4( 2, septembre 2017, 299 309. Doi:10.1016/j.jesit.2017.01.005.
- N. Soares et al., “A Review on Current Advances in the Energy and Environmental Performance of Buildings towards a More Sustainable Built Environment”, Renewable and Sustainable Energy Reviews, 77, September 845 60, 2017. DOI.org (Crossref), doi:10.1016/j.rser.2017.04.027.
- G.Y. Yasin et al., Design and Development of Advanced Fuzzy Logic Controllers in Smart Buildings for Institutional Buildings in Subtropical Queensland” Renewable and Sustainable Energy Reviews, 54, février 2016, 738 44, 2016. DOI.org, doi:10.1016/j.rser.2015.10.105.
- A.I. Dounis, Advanced control systems engineering for energy and comfort management in a building environment—A review. Renewable and Sustainable Energy Reviews, 13(6-7), 1246–1261, 2009. doi:10.1016/j.rser.2008.09.015.
- Woods, Ruth, et al. «The Influence of Users Behaviour on Energy Use in European ShopingCentres: Influence Of User Behaviour on Energy Use » Sustainable Development, 25( 1, janvier 2017, 11 24. Doi:10.1002/sd.1638.
- O.A. Nisiforou, et al. Behaviour, Attitudes and Opinion of Large Entreprise Employees with Regard to their Energy Usage Hbaits and Adoption of Energy Saving Mesures, Energy and buildings, 55, decembre 2012, 299-311. Doi: 10.1016/j.enbuikd.2012.08.034.
- S. Janet, et al., The Energy Cultures Framework: Exploring the Role of Norms, Practices and Material Culture in Shaping Energy Behaviour in New Zealand ». Energy Research & Social Science, 7, 117 23, 2015. Doi:10.1016/j.erss.2015.03.005.
- Invest in Morocco – Power Rates. http://www.invest.gov.ma/index.php?Id=34503&lang=en. Consulted the 17th of November, 2020.
- L.A. Zadeh, Fuzzy Sets, Information and Control, 338–353, (1965).
- S. Adnan, Electric vehicle power electronics cooling system pump control using fuzzy logic” nternational Journal of Advanced Computer Research, 7(31), juin 2017, 111 20. Doi:10.19101/IJACR.2017.730019.
- A. Agarwal, A. Mishra, and M. Dixit, “Design of an Improved Fuzzy Logic based Control System for Washing Machines,” 51(8), 5–10, 2016
- M. Mongkolwongrojn, “Implementation of fuzzy logic control for air conditioning systems, In: Proceedings of 8th International Conference on Control, Automation and Systems, 313–321, 2005.
- G.Y. Yasin, et al., Recent Developments of Advanced Fuzzy Logic Controllers Used in Smart Buildings in Subtropical Climate, Energy Procedia, 61, 2014, 1021 24. Doi:10.1016/j.egypro.2014.11.1015.
- M.M. Gou, et al., Thermal Comfort Based Fuzzy Logic Controller, Building Services Engineering Research and Technology, 22(4), 237 53, 2001. DOI.org (Crossref), doi:10.1177/014362440102200403.
- K. Mahmoud, Investigation of energy saving in HVAC systems : Modeling, simulation, and measurement using fuzzy logic controller ». 2018 IEEE International Conference on Industrial Technology (ICIT), IEEE, 445 50, 2018. DOI.org, doi:10.1109/ICIT.2018.8352218.
- A. Zakia, Modeling Techniques Used in Building HVAC Control Systems: A Review ». Renewable and Sustainable Energy Reviews, 83, 64 84, 2018. DOI.org, doi:10.1016/j.rser.2017.10.044.
- C. Schweppe, Estia: A real-time consumer control scheme for space conditioning usage under spot electricity pricing. Computers & Operations Research, 18(8), 751–765, 1991. doi:10.1016/0305-0548(91)90013-h
- Z. Yanyu et al., Multi-objective optimal control algorithm for HVAC based on particle swarm optimization ». Fifth International Conference on Intelligent Control and Information Processing, IEEE, 417 23, 2014. DOI.org, doi:10.1109/ICICI2014.7010290.
- A. Abdel-Hamid et al., Fuzzy Logic Control of Air-Conditioning System in Residential Buildings, Alexandria Engineering Journal, 54(3), 395 403, 2015. Doi:10.1016/j.aej.2015.03.023.
- M. Abbas, M. Saleem Khan, Fareeha Zafar, « Autonomous Room Air Cooler Using Fuzzy Logic Control System, International Journal of Scientific & Engineering Research 2(5), 2011.
- M. Jamieson, “$3 Billion Opportunity: Energy Management in Retail Operations” , Schneider Electric executive summary, 1-6, 2014.
- R. Nikitha et al.,Token Based Scheduling for Energy Management in Building HVAC Systems ». Applied Energy, 173, 67 79, 2016. DOI.org, doi:10.1016/j.apenergy.2016.04.023.
- G. Ali et al., HVAC System Energy Optimization Using an Adaptive Hybrid Metaheuristic,Energy and Buildings, 152, 149 61, 2017. DOI.org, doi:10.1016/j.enbuild.2017.07.053.
- S. Jaw-Kuen et al., Fuzzy Controller for a Voltage-Regulated Solar-Powered MPPT System for Hybrid Power System Applications, Energies, 8(5), 3292 312, 2015. DOI.org, doi:10.3390/en8053292.
- L. Bortoni-Anzures, et al., Fuzzy Controller for Automatic Steering in Heavy Vehicle Semi-Trailers, Ingeniería, Investigación y Tecnología, 14(1), 1 9, 2013. DOI.org, doi:10.1016/S1405-7743(13)72220-0.
- B. Ben et al., Apportioning Energy Consumption in the Workplace: A Review of Issues in Using Metering Data to Motivate Staff to Save Energy, Technology Analysis & Strategic Management, 26(10) 1196 211, 2014. Doi:10.1080/09537325.2014.978276.
- A. Christina, Co-Simulation of Fuzzy Control in Buildings and the HVAC System Using BCVTB, Advances in Building Energy Research, 12(2), 195 216, 2018. Doi:10.1080/17512549.2017.1279077.
- Z. Ma, An Assessment for Energy Management in Retail Stores, Journal of Energy and Power Engineering, 12(5), 2018. Doi:10.17265/1934-8975/2018.05.002.
- S. Steve, Reducing Energy Demand: A Review of Issues, Challenges and Approaches, Renewable and Sustainable Energy Reviews, 47, 74 82, 2015. Doi:10.1016/j.rser.2015.03.002.
- O. Dartevelle, “ Énergie et commerces, conception et rénovation énergétiques des bâtiments”, Les Cahiers de l’Urbanisme N° 70, Université catholique de Louvain Architecture et Climat Chargés de recherche p92-96, 2008.