Study of the Effect of Abnormalities in the External Ear Inducing Hearing Problems

Adv. Sci. Technol. Eng. Syst. J. 5(4), 477–487 (2020);
 DOI: 10.25046/aj050457
Tinnitus is a phenomenon for which the patient hears sound in the absence of any external sound source. To this day, there is no cure for this phantom sound perception. But it can be masked temporarily to help relief the patient’s pain. In order to allow this, a better understanding of the phenomenon is needed. A validated acoustic model of the outer ear developed by the authors is used in this study. This model allows to study the effect of the presence of an anomaly (a cavity, a swelling or a foreign fluid) in the human auditory canal. These anomalies are modeled as a modification of the section of the ear canal or as an alternation of the medium of sound propagation in the ear canal. A parametric study involving the position, width and height of the anomaly as well as the sound velocity in the ear canal is conducted. The results obtained make it possible to conclude on the effect of each parameter on the frequency response of an auditory canal with anomaly.
1. Introduction
Tinnitus is the perception of a sound for which there is no external stimulus; patients suffering from it perceive a sound which may take the form of ringing, buzzing, beeping, hissing or whooshing [1]. This condition can impair one or both ears. According to national health surveys, almost 10 per cent of adults endure a form of tinnitus [2]. The prevalence of tinnitus among employees subject to workplace noise is 15 per cent [3].
This condition has consequences that can be continuous or intermittent, long-term or short-term, with a sudden or incremental occurrence. This can also be associated with the cardiac or respiratory rhythm. Its magnitude also changes during the day, with a period of morning calm and an evening or nightly rise (nocturnal rhythm) [4].
In addition, tinnitus is related not only to alternation in the auditory system such as speech perception, localization of sound and auditory attention [5-8], but also to affective disorders such as depression or anxiety, insomnia, confusion and lower quality of life [9-11].
There is no official classification of tinnitus recognized by all scientists and doctors. The most common types are two: One dividing tinnitus by manifestation (objective or subjective tinnitus) and the other defining it by the potential cause of tinnitus [12].
Objective tinnitus is the rarest but also the easiest to identify. It is a perceived pulsatile sound produced by the body (vascular or muscular cause) which the examiner may also hear. This type of tinnitus represents about 10 per cent of cases of tinnitus. The 90 per cent remaining are subjective [13].
Subjective tinnitus is only heard by the patient. The frequency perceived does not come from the body, but from one or more body system failures that may be from the cortex to the external auditory canal [14]. It can be caused by ear problems (tinnitus aurium) or cerebral problems (tinnitus cerebri) [1]. This tinnitus is a perceived sensation in the absence of any outer physical source (phantom sound) and its source is hard to determine [14]. It is characterized as persistent after continuous occurrence for 6 months [15].
The symptom of tinnitus can be induced by multiple causes and is often accompanied by loss of hearing at high frequencies linked to ageing. Different parts of the hearing system can cause tinnitus, such as the outer ear [16]. For example, an excessive ear wax can cause pressure in the ear canal and causes a change in the resonance frequency at the eardrum.
According to the second type of classification (potential cause of tinnitus) and, as in [17], the origin of tinnitus may be categorized as:
- Otological origin: The auditory system (external, middle or inner ear) or the auditory nerve. In this case, tinnitus is usually accompanied by hearing loss and sometimes dizziness.
- Central origin: The relay level of central auditory canal;
- Non otological origin: vascular, muscular, cerebral or cervical;
- Unknown origin: if no lesion and no other symptom are
Several efforts have been made in the past to suppress or treat tinnitus. Some of these interventions included the use of drugs for the treatment of tinnitus [18-19]. In some serious cases, the sensation was eliminated by taking drastic actions, like cutting a specific nerve into the ear [20]. This completely removes the ability to hear using that ear.
The improved understanding of tinnitus physiopathological processes during the last decade has opened the way for many medical therapeutic researches [21-25]. The most common treatments used for tinnitus managing are cognitive and behavioral therapy (CBT), tinnitus retraining therapy (TRT) and sound therapy (SD)[26-31].
Cognitive and behavioral therapy is based on the premise that “what matters is not what happens to us, but how we do it.” [25]. In fact, this treatment does not enhance tinnitus appreciation, but allows the individual to ignore it by emotional adjustments and behavioral changes [26].
Tinnitus retraining therapy is one of the most common techniques for managing tinnitus. Its neurophysiological model indicates that the limbic mechanism plays an important role in the perception of tinnitus [27]. The TRT principle is based on the patient’s ability to become accustomed to the tinnitus signal.
Sound therapy is a program that uses external sound to manage tinnitus either via acoustic or electric stimulation [24]. It offers relief from tinnitus for both the short and long term. This treatment aims to minimize patient perception, effectively reducing the signal-to-noise ratio of tinnitus to ambient or surrounding noise [29-31].
Previous tinnitus suppression attempts involved the use of electrical stimulation [32]. In practice, it does not suppress tinnitus, but rather tries to mask the current tinnitus sound with another sound produced by the electrical stimuli. The key purpose of electrical stimulation is to eliminate tinnitus without any additional sound being applied. The direct electrical currents used cause severe damage to the biological tissue and can therefore not be used in the long term [32].
This problem can be fixed by means of an approach in which the tinnitus patient is subjected to a hearing test of varying pitches to determine the frequency of the perceived tinnitus sound. A noise generator (white noise, filtered noise, pink noise, ambient sounds …) is used to mask tinnitus [24, 33]. This generator provides signals both above and below the specified tinnitus frequency.
The corresponding frequency of tinnitus was between 9000 and 11000 Hz for 86 per cent of the 771 patients in an experiment led by Johnson in [34]. The median tinnitus frequency of the 29 patients taking part in Neff’s experiment [33] was 4046 Hz with a standard deviation of 2212,25 Hz. In Reavis experiment [29] on 20 participants, the mean frequency of tinnitus was 6929 Hz with a standard deviation of 2090 Hz.
It should be mentioned that such treatments do not heal tinnitus, but rather superimpose stimulus on the original tinnitus symptom in an attempt to mask the perceived sound. Given the multidisciplinary aspect of the condition, it is better to merge approaches for better results [35-37]. A deeper understanding of the tinnitus syndrome is required to make these masking methods more effective. To this end, further investigations must be carried out into causes that stimulate the phantom frequencies and the loss of hearing at high frequencies.
In this study, an analysis is carried out with the intention of further understanding the effect of certain anomalies that induce tinnitus on the resonance frequency of the human outer ear. An acoustic model previously developed by authors is used in the current research by inserting various diseases or anomalies into it, either through introducing acoustic resonators or by acting on some of its parameters.
The anomalies investigated are those that can lead to:
- A change of section at any position along the ear canal;
- A change in the propagating medium of the sound wave in the outer ear [38].
The introduction of a resonator simulating a swelling makes it possible to model, for example, an excessive presence of earwax, a pimple, an infection or a foreign body in the ear canal (Figure 1). The addition of an acoustic resonator simulating a cavity can make it possible to model anomalies such as lesions of the ear canal. The presence of a foreign fluid in the ear canal can be modeled by acting on the wave propagation velocity parameter in the outer ear. If this fluid is water, the swimmer’s ear disease can be mentioned.
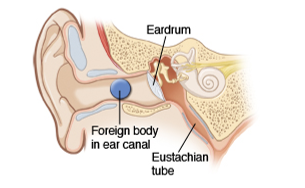 Figure 1: External auditory canal with a foreign body
2. Acoustic model of the outer ear
2.1. Outer ear
The outer ear plays a very significant function in the transmission of human sensory information from the environment to the tympanic membrane. It functions as a low frequency filter, a resonator for the middle range and direction dependent filter on high frequencies to enhance spatial awareness [39].
By providing a narrow entrance to the auditory system, the external ear protects the eardrum from mechanical damage. It provides directional amplification of the incident sound pressure level. It also transforms the incoming sound spectrum which was subjected to diffraction and amplifies acoustic waves at higher frequencies [40]. These properties makes that the ear plays a significant role in spatial hearing.
In an attempt to comprehend these characteristics, it is better to divide the external ear system into its functional elements: the head, torso and pinna acting as diffraction bodies, the concha and the ear canal acting as acoustic resonators, and the eardrum providing an acoustic termination.
Such components must be seen as part of an integrated network, since they work together to transfer sound pressure from the free field to the middle ear entrance, depending on the frequency, direction and anatomy of the hearing system. Human ear models can provide a better understanding of how the human ear responds when it is artificially stimulated.
An acoustic model taking account of this integration is previously developed by authors [41] and is used in this paper to model anomalies present in the outer ear. This model is presented briefly in Figure 2. The purpose of this study is to examine the impact of anomalies on the external ear function. This is done by comparing the frequency response of a healthy external ear to an external ear with an anomaly.
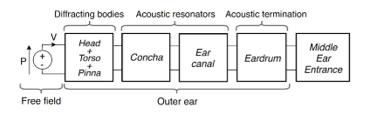 Figure 2: Acoustic Model of the External Ear
2.2. Outer ear acoustic model
The acoustic model presented associates with each part of the outer ear an acoustic resonator modeled by a transfer matrix. These transfer matrices can model a segment of the concha, auditory canal or even the eardrum. These resonators can have several forms (Figure 3) and are used, in this study, to model segments of the ear canal as well as abnormalities present in the outer ear. The corresponding transfer matrix of the outer ear (with or without anomaly) is obtained by multiplying the transfer matrixes of each segment.
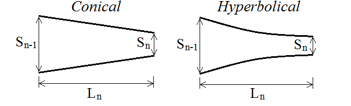 Figure 3: Acoustic resonator segment of different forms with parameters
The ear canal is divided into several segments (Figure 4), the number of segments depends on the precision sought in the calculation. A detailed study of the form as well as the optimal number of segments to approach with good precision the actual shape of the auditory canal is carried out previously by the authors in [41]. This model adopts the sound pressure pi and the mass velocity vi as the two state variables for linking the two ports of the i-th acoustic resonator.
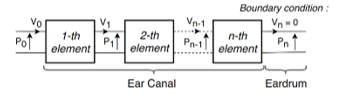 Figure 4: Segments of the ear canal acoustic model and boundary conditions
As illustrated in Figure 4, p0 and v0 represent the acoustic pressure and the mass velocity at the input of first resonator coming from the free field. The acoustic pressure and the mass velocity pn and vn are the outputs of the acoustic model of the outer ear which is also the entrance of middle ear. At the output of the n-th resonator, vn=0 simulates the infinite impedance of the tympanic membrane since it behaves as an obstacle. This is used as a boundary condition for calculating the frequency response of the model.
The transfer matrix of the conical acoustic resonator TC is described in (1). The section parameters are shown in Figure 3.
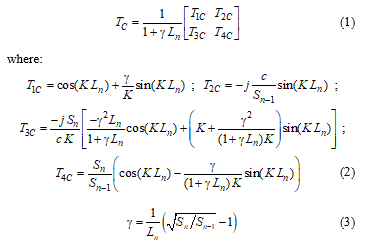 The wave number K (in radius/m) takes into account the attenuation of the sound in the human ear as advised in [42]. It should be mentioned that this segment can be used to model uniform acoustic resonator simply by taking Sn equal to Sn-1. The transfer matrix of the hyperbolical acoustic resonator TH is described in (4).
 The acoustic model is applied to two of the 15 auditory canals published by Stinson et al. [43], referred to in “Canal 4” and “Canal 6.” Canal 4 and Canal 6 are measured from the right ear of a man and the left ear of a woman, respectively. Therefore, this study takes into account both ears and the sex of the individual.
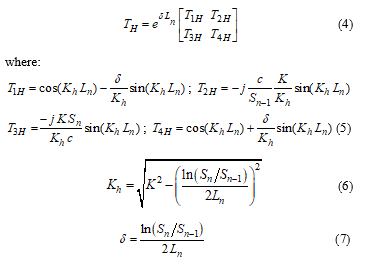
Complete anatomy of the canals studied is available in [43]. The dimensions of the acoustic resonator segments and the variation in diameter over the length of both canals are shown in Figures 5 and 6.
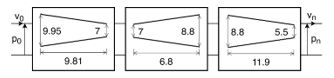 Figure 5: Parameters of the acoustic model of “Canal 4”
 Figure 6: Parameters of the acoustic model of “Canal 6”
Canal 4 has a length of 28.51 mm and canal 6 has a length of 26.69 mm. Despite the fact that these lengths are of the same order of magnitude, there is a very different variation in the section along the ear canal. Both canals are modeled using three acoustic resonators in series. This allows to approach with good precision the true forms of these ear canals. Other segments of acoustic resonators are injected thereafter in order to model anomalies present in these healthy auditory canals.
3. Anomaly modeling
The normal function of transmission of the ear is compromised by alterations in its anatomy. It can be due to individual differences or technical blockages, such as foreign body parts, hearing aid implants, infections or tympanic membrane perforation.
The anomalies studied are those that can cause a difference in the section at any location along the external auditory canal or an alternation in the sound propagation medium in the outer ear. The first type of anomalies, consisting of an obstacle present in the ear canal, may be modeled by swelling or cavities. The parameters concerning this type of anomaly are presented in Figure 7. The second type can be modeled by the presence of a fluid in the auditory canal, which would cause the sound transmission medium to change from the air to the fluid contained in the auditory canal. These abnormalities can cause the resonance frequency of the ear to alter.
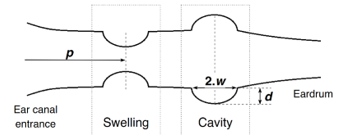 Figure 7 : Parameter definition of anomalies that change the section of the ear canal
Acoustic models of canals 4 and 6 are those of healthy outer ears into which these anomalies will be introduced (Figure 8). Each anomaly is modeled considering its shape. It is modeled by two acoustic resonators in series which can have a conical, hyperbolic or even a uniform section. Given the nature of the obstacle type anomaly studied in this paper, it is modeled using two segments of hyperbolic acoustic resonators as shown in Figure 7.
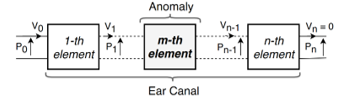 Figure 8 : Insertion of an acoustic resonator modeling anomaly in a healthy auditory canal model
A parametric analysis will be carried out using the acoustic model acquired (auditory canal with anomaly). In this analysis, the effect of position “p”, width “w” and depth “d” of the obstacle type anomaly on the frequency response of the outer ear is investigated. The second type of anomaly concerns the study of the effect of the propagation speed of sound “c” in the ear canal.
Parameters “p” and “w” are expressed as a function of the total length “L” of the ear canal. The position values of the anomaly investigated in this work are 0.2L, 0.35L, 0.5L, 0.65L and 0.8L. The values considered for the anomaly width are 0.05L, 0.1L, 0.15L, 0.2L and 0.25L. The depth parameter “d” is expressed as a function of the width of the anomaly to hold the anomaly in proportion. This parameter can be set to 0.5w, 0.75w, 1w, 1.25w and 1.5w. In order to simulate the different levels of severity of the diseases that cause the presence of fluid in the ear canal, the speed of sound “c” parameter can be set to 350, 500, 650, 800 and 950m/s. This results in a test matrix of 65 cases.
Only one case is presented in Figure 9 given the large number of cases studied. This acoustic model of the “Canal 4” ear canal has a swelling of a width of w = 0.15L and a height of d = 1w at a distance of p = 0.65L from the entrance of the auditory canal. The same procedure applies in the other cases. In cases of abnormalities involving the presence of foreign fluids in the ear canal, the dimensions of the model are similar to those of the healthy model shown in Figures 5 and 6 (only the speed of sound parameter is modified).
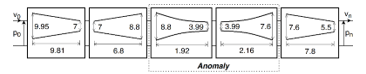 Figure 9 : Acoustic resonator modeling a swelling anomaly (p=0.65L, w=0.15L and d=1w) present in auditory canal « Canal 4 »
4. Results and discussion
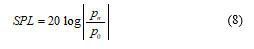
The sound pressure level (SPL) presented in (8) is computed using Matlab. The results are reported in two formats: figures and tables. The figures show the variation in sound pressure level with frequency. The numerical values of the resonance frequencies as well as the gains at these frequencies are presented in the tables to improve the readability of the results.
 4.1. Effect of the propagation medium
Figure 10 shows the effect of the medium of sound propagation, which is characterized by the speed of sound “C”, on the frequency response of the auditory canal. In this simulation, the greater the value of “C”, the greater the volume of fluid contained in the ear.
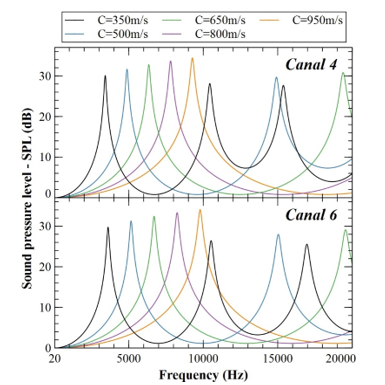 Figure 10 : Frequency response of Canal 4 and Canal 6 to different sound speed values
In the case of “Canal 4”, it can be shown from Figure 10 that the first resonant frequency occurred at 3416, 4898, 6341, 7811 and 9272 Hz at sound velocity of 350, 500, 650, 800 and 950 m/s, respectively. The first resonant frequency for “Canal 6” is 3626, 5154, 6688, 8246 and 9793 Hz, respectively, at 350, 500, 650, 800 and 950 m/s.
It can be observed that only the ear canals with a propagation medium inducing a sound speed of 350, 500 and 650 m/s have a second resonant frequency. This resonant frequency for “Canal 4” is 9413, 14935 and 19388 Hz, respectively, at 350, 500 and 650 m/s. For “Canal 6”, these values are 10529, 15037 and 19556 Hz at sound velocity of 350, 500 and 650 m/s, respectively.
For the third resonant frequency, only the canal providing a propagating medium with a sound velocity of 350 m/s is concerned. “Canal 4” resonates at 15383 Hz and “Canal 6” resonates at 16960 Hz. These ear canals are healthy canals.
These results show that the presence of fluid in the ear canal tends to reduce the number of resonant frequencies of the ear canal in the audible band. The resonance frequency values obtained for “Canal 6” are higher than those found for “Canal 4”. That is due to the disparity in the physiology of these two auditory canals. The presence of a foreign fluid in the ear canal leads to an increase in the speed of sound propagation in this canal, which has a significant effect on the frequency of the resonance. Indeed, the frequency of resonance rises with the speed of sound propagation.
Considering the first resonance frequency, it can be reported that the gains at these frequencies for canals 4 and 6 are almost identical. This gain ranges by an order of magnitude from 30 dB at a sound transmission speed of 350 m/s to 34 dB at a speed of 950 m/s. From these findings, it can be assumed that an increase in the amount of fluid in the ear canal leads to an increase in the sound pressure level.
4.2. Effect of anomaly position
In order to study the effect of the position of a cavity or swelling on the frequency response of the human auditory canal, the parameters of the anomaly width “w” shall be set to 0.15L and the depth or height “d” of the anomaly shall be set at 1w.
Figure 11 indicates the evolution of the SPL as a result of the frequency in the audible band. This concerns the case of swollen auditory canals with various anomaly positions. Figure 12 shows that of auditory canals with a cavity. Table 1 indicates the relative deviation between the resonance frequency findings for a healthy canal and canals with anomaly. The table further shows the variations in SPL observed at these frequencies. It should be noted that for the calculation of these deviations, a healthy auditory canal is used as a reference for all the canals with anomaly.
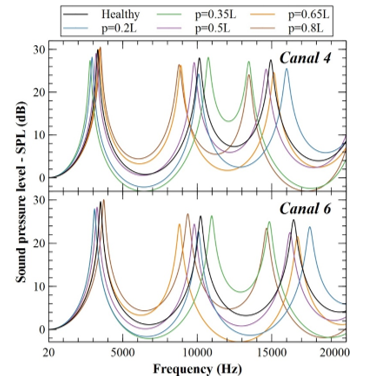 Figure 11 : Frequency response of the auditory canals with a swelling anomaly of different positions p (w= 0.15L and d=1w)
A negative SPL for the swelling located at 0.2L and 0.35L in “Canal 4”, for the frequency bands [4918-7890] Hz and [4592-8344] Hz can be seen from the reading of Figure 11. In these same bands, gains for anomalies of positions 0.65L and 0.8L are significantly higher than those of the healthy canal. Between 15500Hz and 19100Hz, the frequency response of the canals with anomalies at 0.35L and 0.8L is almost identical and presents negative gains.
The frequency response of “Canal 6”, consisting of a 0.2L and 0.35L swelling, shows negative gains in the [5200-8400] Hz band. Same observation for 0.35L and 0.8L in the frequency band [17000-20000] Hz. There are also negative gains for swelling cases in the 0.2L and 0.65L positions in the [12365-14774] Hz and [10951-14664] Hz bands, respectively. The healthy ear canal amplifies the sound of these frequencies. When such abnormalities have occurred, we find that this ear canal starts to decrease the sounds heard at these frequencies.
According to Figure 11 and taking into account the results obtained for “Canal 4”, there are maximum differences of -18.77, -22.82, -10.74, -21.6 and -24.77 dB between the SPL curve of the healthy canal and those of the auditory canals with anomalies at positions 0.2L, 0.35L, 0.5L, 0.65L and 0.8L, respectively. These differences are observed at 14924, 14947, 10175, 10156 and 14955 Hz frequencies at 0.2L, 0.35L, 0.5L, 0.65L and 0.8L respectively. Negative deviations mean that the sound perceived at these frequencies is reduced. This can lead to a slight loss of hearing.
Absolute variations of 15.39, 18.12, 9.26, 19.04 and 20.01 dB between the healthy canal SPL and the canals with anomaly positions of 0.2L, 0.35L, 0.5L, 0.65L and 0.8L, respectively. Such variations are found at 16021, 13464, 9754, 8886 and 8768 Hz frequencies for 0.2L, 0.35L, 0.5L, 0.65L and 0.8L, respectively. Similar observations may be made from “Canal 6”. Indeed, results show very similar variations but with slightly higher frequencies (of the order of 1500 Hz). These positive variations (amplification) may lead to an over-sensitivity to sounds having these frequencies in some cases and for some patients.
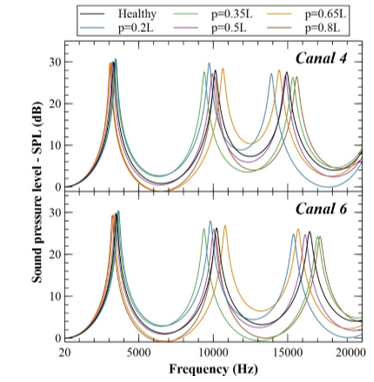 Figure 12 : Frequency response of the auditory canals with a cavity anomaly of different positions p (w= 0.15L and d=1w)
Figure 12 shows that the auditory canals 4 and 6 with a cavity type anomaly do not generally have negative SPL values. From this figure and taking into consideration the obtained results for “Canal 4”, the maximum differences are -18.88, -16.68, -7.54, -12.92 and -14.65 dB between the healthy canal SPL and the auditory canals with 0.2L, 0.35L, 0.5L, 0.65L and 0.8L location anomalies, respectively. Those very variations are found at 14962, 10162, 10197, 10113 and 14911 Hz frequencies at 0.2L, 0.35L, 0.5L, 0.65L and 0.8L respectively.
Absolute differences of 15.91, 16.02, 6.15, 12.74 and 12.53 dB between the healthy canal SPL and the canal with anomalies of 0.2L, 0.35L, 0.5L, 0.65L and 0.8L respectively. These differences are observed at frequencies 13886, 9374, 9875, 10673 and 15630 Hz for positions 0.2L, 0.35L, 0.5L, 0.65L and 0.8L respectively.
For “Canal 6”, these SPL differences are of the same order of magnitude for all the studied cases. However, these differences are observed at higher frequencies of approximately 1500 Hz at 0.2L and 0.8L positions, 6000 Hz at 0.5L and 0.65L positions and almost similar at 0.35L position.
This confirms the observation obtained from the swollen ear canals. However, the variations found for the anomaly of the cavity are smaller than those reported for the anomaly of the swelling.
Table 1: Effect of the position of swelling and cavity anomalies on frequency response for canal 4 and 6
| Resonant frequencies | SPL at resonant frequencies | ||||||
| RF-1 | RF-2 | RF-3 | SPL (RF-1) | SPL (RF-2) | SPL (RF-3) | ||
| Canal 4 | |||||||
| Healthy | 3317 Hz | 10140 Hz | 14940 Hz | 29,96 dB | 28,00 dB | 27,54 dB | |
| Swelling | p=0.2L | -11,6% | -0,49% | 7,10% | -5,94% | -13,4% | -7,33% |
| p=0.35L | -15,6% | 5,92% | -9,84% | -8,68% | 0,39% | -1,27% | |
| p=0.5L | -3,26% | -3,41% | -2,14% | -3,00% | -3,86% | -7,88% | |
| p=0.65L | 2,89% | -12,3% | 1,34% | 0,30% | -6,29% | -10,8% | |
| p=0.8L | 5,19% | -13,4% | -9,84% | 1,97% | -5,57% | -12,5% | |
| Cavity | p=0.2L | 4,49% | -4,08% | -6,96% | 2,37% | 6,25% | -1,23% |
| p=0.35L | 3,11% | -7,34% | 2,68% | 2,77% | -1,39% | -4,68% | |
| p=0.5L | -2,68% | -2,05% | -0,67% | 0,60% | -2,89% | -3,20% | |
| p=0.65L | -6,33% | 5,03% | -3,41% | -0,53% | 1,75% | 1,92% | |
| p=0.8L | -7,54% | -0,39% | 4,42% | -0,90% | -6,04% | -4,03% | |
| Canal 6 | |||||||
| Healthy | 3504 Hz | 10230 Hz | 16470 Hz | 29,61 dB | 26,30 dB | 25,43 dB | |
| Swelling | p=0.2L | -14,0% | -1,56% | 6,62% | -5,64% | -13,6% | -6,53% |
| p=0.35L | -11,5% | 7,23% | -9,90% | -6,62% | 0,19% | -1,77% | |
| p=0.5L | -6,65% | -4,18% | -1,52% | -4,36% | -7,19% | -11,7% | |
| p=0.65L | -0,20% | -13,9% | 1,58% | -0,91% | -7,11% | -15,3% | |
| p=0.8L | 6,14% | -8,45% | -10,9% | 1,69% | 1,86% | -7,75% | |
| Cavity | p=0.2L | 4,22% | -4,09% | -6,56% | 2,60% | 6,35% | -2,44% |
| p=0.35L | 2,11% | -8,33% | 3,28% | 2,57% | -0,61% | -4,76% | |
| p=0.5L | -2,11% | -1,96% | -1,82% | 0,91% | -1,18% | -2,87% | |
| p=0.65L | -5,74% | 5,47% | -4,68% | -0,51% | 2,05% | 2,48% | |
| p=0.8L | -8,11% | -0,59% | 4,25% | -1,05% | -6,92% | -4,52% | |
The calculation of the relative deviations found in Table 1 uses the results reported for healthy auditory canal cases as a reference. Results presented in this table show that for the first resonance frequency (RF-1) and for the swelling case, there is a maximum deviation of -15.6% for “Canal 4” with an anomaly at position 0.35L and a maximum deviation of -14% for “Canal 6” with an anomaly at position 0.2L. In the case of a cavity, there is a maximum deviation of -7.54% for “Canal 4” with an anomaly located at 0.8L and a maximum deviation of -8.11% for “Canal 6” with an anomaly located at 0.8L.
In the case of the second resonance frequency (RF-2) and in the case of swelling, there is a maximum deviation of -13.4% for “Canal 4” with an anomaly at 0.8L and a maximum deviation of -13.9% for “Canal 6” with an anomaly at 0.65L. In the case of a cavity, there is a maximum deviation of -7.34% for “Canal 4” with an anomaly at position 0.35L and a maximum deviation of -8.33% for “Canal 6” with an anomaly at position 0.35L.
There is a maximum deviation of -9.84% in the third resonance frequency (RF-3) and for the swelling anomaly in “Canal 4” with an anomaly at 0.35L and 0.8L. For “Canal 6”, one can observe a deviation of -9.9% for an anomaly located at 0.35L and a maximum deviation of -10.9% for an anomaly at 0.8L. In the case of cavity, there is a maximum deviation of -6.96% for “Canal 4” with an anomaly located at 0.2L and a maximum deviation of -6.56% for “Canal 6” with an anomaly at 0.2L.
It can be deduced that a decrease of the first resonance frequency may be caused by a swelling located at the entry of the auditory canal or a cavity situated towards the tympanic membrane. The result is completely reversed at the second resonance frequency. A swelling effect causes a drop of this frequency at the input and output of the auditory canal for the third resonance frequency. A cavity acts in the same way at the end of the auditory canal.
The effect of anomalies on the SPL at resonance frequencies can also be observed from Table 1. For auditory canals with swelling, there is a maximum deviation of -13.4% corresponding to the SPL at RF-2 for “Canal 4” with an anomaly at 0.2L and a maximum deviation of -15.3% corresponding to the SPL at RF-3 for “Canal 6” with an anomaly at 0.65L. For the auditory canals with a cavity, a maximum deviation of 6.25% corresponding to the SPL at RF-2 for “Canal 4” with an anomaly at position 0.2L and a maximum deviation of -6.92% corresponding to the SPL at RF-2 for “Canal 6” with an anomaly at position 0.8L are observed.
These deviation values remain low, which means that, unlike the swelling anomaly, this anomaly has little effect on the amplitude of the resonance peaks of the ear canal.
4.3. Effect of anomaly width
The parameter of the anomaly location “p” is set to 0.5L and the depth or height “d” is set to 1w to evaluate the influence of the width “w” of a swelling or cavity on the frequency response of the human auditory canal. Figure 13 shows the results obtained for canals 4 and 6 consisting of a swelling with values of different widths. Figure 14 displays the findings for the case of a cavity. Table 2 describes the relative deviations of the resonant frequency and the SPLs at these frequencies, taking as a reference the healthy auditory canal.
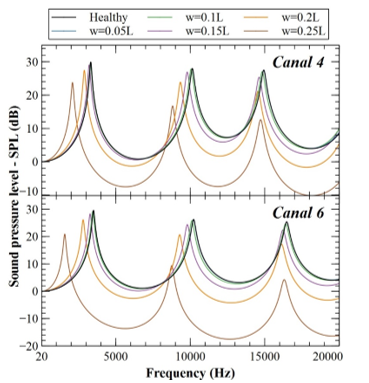 Figure 13 : Frequency response of the auditory canals with a swelling anomaly of different widths w (p= 0.5L and d=1w)
Figure 13 indicates negative magnitudes relating to the reduction of SPL through the ear canal with swelling. These values are -7.55, -7.46 and -10.15 dB, observed in the case of an anomaly of width of 0.25L in “Canal 4” in the frequency bands [3197-7972] Hz, [9666-13960] Hz and [15438-20000] Hz respectively. The anomaly of 0.2L width is also affected by this effect, but at a smaller scale. Therefore, one can assume that the greater the width of the swelling, the greater the risk of hearing loss.
In the case of “Canal 6”, negative gains are noted for anomalies of width 0.2L and width 0.25L for frequency bands [4589-7607] Hz, [10776-14626] Hz and [17637-20000] Hz, and [2288-8398] Hz, [9102-16050] Hz and [16564-20000] Hz respectively. The maximum values observed for the 0.25L width anomaly in the bands mentioned above are -13.62, -17.51 and -16.38 dB. By comparing, on the one hand, the width of these frequency bands and, on the other hand, the minimum SPL values for canals 4 and 6, it can be concluded that “Canal 6” is more affected by a swelling anomaly than “Canal 4”. This is because of their different anatomies.
Maximum absolute deviations between the healthy “Canal 6” SPL curve and those of the swollen canals with anomaly widths 0.05L, 0.1L, 0.15L, 0.2L and 0.25L are -0.52 dB at 10347 Hz, -4.31 dB at 10309 Hz, -12.7 dB at 10262 Hz, -22.76 dB at 10246 Hz and -38.37 dB at 10238 Hz, respectively. Positive deviation values are also observed and are 0.42 dB at 10070 Hz, 3.35 dB at 10025 Hz, 9.21 dB at 9764 Hz, 15.88 dB at 2797 Hz and 18.52 dB at 1548 Hz for swollen “Canal 6” with anomaly widths of 0.05L, 0.1L, 0.15L, 0.2L and 0.25L, respectively.
It can be deduced from these values that the SPL reduces exponentially with an increase in the width of the swelling.
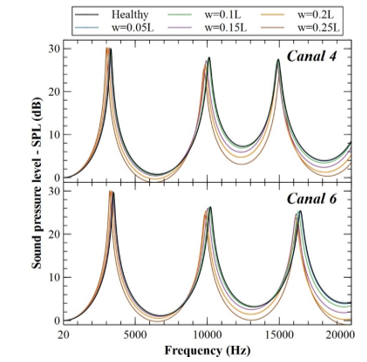 Figure 14 : Frequency response of the auditory canals with a cavity anomaly of different widths w (p= 0.5L and d=1w)
Figure 14 shows that auditory canals 4 and 6 with an anomaly of the cavity type have no negative SPL values. This is in agreement with the observation made in the study of the effect of the anomaly position.
From this figure and taking into consideration the obtained results for “Canal 6”, the maximum absolute deviations are -0.98, -4.34, -8.42, -10.06 and -12.61 dB measured between the healthy canal SPL and the auditory canals with 0.05L, 0.1L, 0.15L, 0.2L and 0.25L width anomalies, respectively. Those variations occurs at 16629, 16580, 16545, 16544 and 10265 Hz frequencies for 0.05L, 0.1L, 0.15L, 0.2L and 0.25L widths respectively. As in the majority of the cases studied, it can be noted that the maximum absolute deviations occur at high frequencies.
For similar anomaly widths, the cavity effect is much less pronounced than swelling effect. This is because the swelling presents an obstacle in the ear canal, while the cavity presents a wider opening of the latter. This observation can easily be made by comparing the shape of the curves in Figures 13 and 14.
Figure 14 also shows that the difference between the SPL curves on the healthy canal and the anomaly canals increases exponentially with the “w” width. It can be deduced that this effect is much more present in the case of swelling anomalies by comparing the differences obtained.
Results presented in Table 2 show that the maximum relative deviations for resonance frequencies RF-1 and RF-2 are observed for an anomaly of a width of 0.25L. That applies to the two types of abnormalities investigated (swelling and cavity). The first resonance frequency (RF-1) for the swelling case presents a maximum deviation of -36.9% and -55.2% for “Canal 4” and “Canal 6”, respectively. In the case of a cavity, there is a maximum deviation of -9.29%, -7.56% for “Canal 4” and “Canal 6”, respectively.
Table 2: Effect of the width of swelling and cavity anomalies on frequency response for canal 4 and 6
| Resonant frequencies | SPL at resonant frequencies | ||||||
| RF-1 | RF-2 | RF-3 | SPL (RF-1) | SPL (RF-2) | SPL (RF-3) | ||
| Canal 4 | |||||||
| Healthy | 3317 Hz | 10140 Hz | 14940 Hz | 29,96 dB | 28,00 dB | 27,54 dB | |
| Swelling | w=0.05L | 0,03% | 0,00% | -0,07% | -0,20% | 0,04% | -0,15% |
| w=0.1L | -0,63% | -0,79% | -0,74% | -0,93% | -0,61% | -1,67% | |
| w=0.15L | -3,26% | -3,41% | -2,14% | -3,00% | -3,86% | -7,88% | |
| w=0.2L | -13,0% | -7,88% | -2,61% | -8,38% | -14,6% | -22,91% | |
| w=0.25L | -36,9% | -13,0% | -1,41% | -20,63% | -40,2% | -54,18% | |
| Cavity | w=0.05L | -0,18% | -0,10% | -0,07% | 0,07% | -0,14% | -0,07% |
| w=0.1L | -1,15% | -0,59% | -0,40% | 0,30% | -0,89% | -0,76% | |
| w=0.15L | -2,68% | -2,05% | -0,67% | 0,60% | -2,89% | -3,20% | |
| w=0.2L | -5,85% | -2,74% | -0,40% | 0,73% | -5,79% | -6,25% | |
| w=0.25L | -9,26% | -3,59% | 0,66% | 0,97% | -9,57% | -9,77% | |
| Canal 6 | |||||||
| Healthy | 3504 Hz | 10230 Hz | 16470 Hz | 29,61 dB | 26,30 dB | 25,43 dB | |
| Swelling | w=0.05L | -0,29% | -0,20% | 0,00% | -0,24% | -0,23% | -0,31% |
| w=0.1L | -1,66% | -1,17% | -0,36% | -1,32% | -1,71% | -2,79% | |
| w=0.15L | -6,65% | -4,18% | -1,52% | -4,36% | -7,19% | -11,72% | |
| w=0.2L | -19,9% | -9,19% | -2,06% | -11,65% | -21,4% | -32,05% | |
| w=0.25L | -55,2% | -14,4% | -0,97% | -29,35% | -64,3% | -83,20% | |
| Cavity | w=0.05L | -0,11% | -0,20% | -0,18% | 0,17% | 0,08% | 0,04% |
| w=0.1L | -0,66% | -0,78% | -0,91% | 0,54% | -0,11% | -0,63% | |
| w=0.15L | -2,11% | -1,96% | -1,82% | 0,91% | -1,18% | -2,87% | |
| w=0.2L | -4,42% | -3,18% | -2,00% | 1,28% | -3,38% | -6,41% | |
| w=0.25L | -7,56% | -3,89% | -1,21% | 1,52% | -6,46% | -9,99% | |
In the case of the second resonance frequency (RF-2) and for swelling anomaly, there is a maximum deviation of -13% and -14.4% for “Canal 4” and “Canal 6”, respectively. In the case of a cavity, there is a maximum deviation of -3.59% and -3.89% for “Canal 4” and “Canal 6”, respectively.
There is a maximum deviation of -2.61% in the third resonance frequency (RF-3) for the swelling anomaly of width 0.2L in “Canal 4”. For “Canal 6”, one can observe a deviation of -2.06% for an anomaly of the same width. In the case of cavity, there is a maximum deviation of -6.67% for “Canal 4” with an anomaly of width 0.15L and a maximum deviation of -2% for “Canal 6” with an anomaly of width 0.2L.
From these deviations, it can be deduced that the effect of the increase in the anomaly width is the maximum for RF-1. This effect is less pronounced for RF-2 and less so for RF-3. It should be noted that the effect on RF-3 is insignificant, regardless of the type of anomaly and its width. However, the influence of this anomaly has a major effect on the SPL at this frequency (RF-3).
The maximum relative deviations of the SPL at resonance frequencies is observed at the third resonance frequency (RF-3). Its value is -9.77% and -9.99% for “Canal 4” and “Canal 6”, respectively in the case of a cavity. In the case of swelling anomaly, there is a maximum deviation of -54.8% and -83.20% for “Canal 4” and “Canal 6”, respectively. From these values, it can be noted that the drop in SPL caused by an increase in anomaly width is very significant, especially at the third resonance frequency.
4.4. Effect of anomaly height/depth
The anomaly position parameter “p” is set to 0.5L and the width “w” is set to 0.15L in order to evaluate the influence of the height/depth “d” of the swelling or cavity on the frequency response of the human auditory canal. In the case of a swelling anomaly, the parameter “d” being studied is called height, and in the case of a cavity anomaly, one can talk about the depth.
Figure 15 shows the results obtained for canals 4 and 6 consisting of a swelling with values of varying heights. Figure 16 shows the data for the cavity case. Table 3 illustrates the relative deviations of the resonant frequency and the SPLs at these frequencies, taking as a reference the healthy auditory canal.
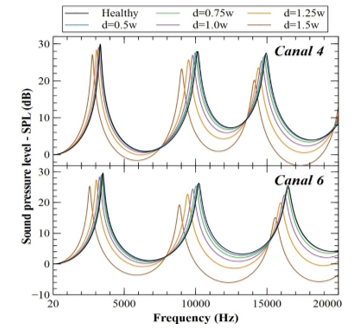 Figure 15 : Frequency response of the auditory canals with a swelling anomaly of different heights d (p= 0.5L and w=0.15L)
Figure 15 indicates negative magnitudes relating to the reduction of SPL through the ear canal with swelling. The maximum of these values, in “Canal 4”, are -1.58 and -2.96 dB, observed in the case of an anomaly of 1.50w height in the frequency bands [4737-7026] Hz and [15776-18849] Hz respectively. Thus, the greater the swelling height, the more risk of hearing loss can be expected.
In the case of “Canal 6”, at frequency bands [5381-7195] Hz, [11601-13834] Hz and [18210-20000] Hz, negative SPL values are noted for anomalies of height 1.25w. Same finding for the anomaly of the 1.50w height in the [4127-7510] Hz, [10037-14501] Hz and [16630-20000] Hz frequency bands. The maximum values observed for the 1.25w height anomaly in the above mentioned bands are -0.865, -1.4 and -0.53 dB, respectively. The maximum values measured for the anomaly of 1.50w height are -3.62, -6.05 and -5.77 dB, respectively.
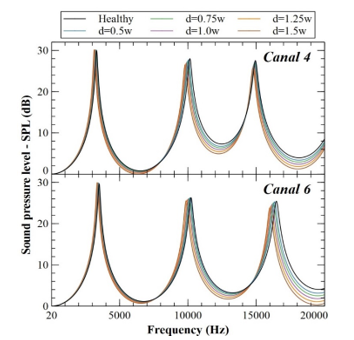 Figure 16 : Frequency response of the auditory canals with a cavity anomaly of different depths d (p= 0.5L and w=0.15L)
Table 3: Effect of the height/depth of swelling and cavity anomalies on frequency response for canal 4 and 6
| Resonant frequencies | SPL at resonant frequencies | ||||||
| RF-1 | RF-2 | RF-3 | SPL (RF-1) | SPL (RF-2) | SPL (RF-3) | ||
| Canal 4 | |||||||
| Healthy | 3317 Hz | 10140 Hz | 14940 Hz | 29,96 dB | 28,00 dB | 27,54 dB | |
| Swelling | d=0.5w | 0,24% | -0,79% | -0,47% | -0,87% | -0,36% | -1,71% |
| d=0.75w | -0,9% | -1,71% | -1,07% | -1,67% | -1,46% | -3,92% | |
| d=1.00w | -3,26% | -3,41% | -2,14% | -3,0% | -3,86% | -7,88% | |
| d=1.25w | -7,60% | -6,26% | -3,55% | -5,24% | -8,25% | -14,49% | |
| d=1.5w | -16,5% | -11,0% | -5,49% | -9,55% | -17,0% | -26,7% | |
| Cavity | d=0.5w | -0,63% | -0,89% | -0,20% | 0,43% | -1,04% | -0,98% |
| d=0.75w | -1,60% | -1,46% | -0,47% | 0,53% | -1,89% | -1,96% | |
| d=1.00w | -2,68% | -2,05% | -0,67% | 0,60% | -2,89% | -3,20% | |
| d=1.25w | -3,92% | -2,71% | -0,94% | 0,63% | -4,04% | -4,65% | |
| d=1.5w | -5,28% | -3,40% | -1,20% | 0,63% | -5,25% | -6,28% | |
| Canal 6 | |||||||
| Healthy | 3504 Hz | 10230 Hz | 16470 Hz | 29,61 dB | 26,30 dB | 25,43 dB | |
| Swelling | d=0.5w | -1,37% | -0,78% | 0,06% | -1,28% | -1,63% | -2,63% |
| d=0.75w | -3,22% | -2,05% | -0,49% | -2,47% | -3,69% | -5,98% | |
| d=1.00w | -6,65% | -4,18% | -1,52% | -4,36% | -7,19% | -11,72% | |
| d=1.25w | -13,0% | -7,7% | -3,16% | -7,7% | -13,54% | -21,55% | |
| d=1.5w | -26,4% | -13,3% | -5,40% | -14,52% | -26,77% | -40,54% | |
| Cavity | d=0.5w | -0,57% | -0,68% | -0,79% | 0,61% | -0,11% | -0,55% |
| d=0.75w | -1,26% | -1,27% | -1,28% | 0,81% | -0,53% | -1,53% | |
| d=1.00w | -2,11% | -1,96% | -1,82% | 0,91% | -1,18% | -2,87% | |
| d=1.25w | -3,11% | -2,74% | -2,31% | 1,01% | -2,02% | -4,44% | |
| d=1.5w | -4,25% | -3,57% | -2,85% | 1,05% | -2,97% | -6,21% | |
It should be mentioned that the frequency bands mentioned above in the case of anomaly of 1.25w height are far more restricted than that of anomaly of 1.50w height. It can be seen from these values that the influence of the height of the anomaly is less significant than the other effects studied, but remains quite important especially for the swelling case.
As in the study of the effect of the position and the width of the anomaly, the SPL curve presents no negative values in the case of the auditory canals in the presence of a cavity (Figure 16). Curves obtained for auditory canals with anomalies show greater deviations for “Canal 6” than for “Canal 4”. This can be easily confirmed by reading Figure 16 and Table 3.
Considering the results shown in Figure 16 for “Canal 6”, the maximum absolute deviations are -3.82, -6.15, -8.42, -10.51 and -12.38 dB measured between the healthy canal SPL and the auditory canals with 0.5w, 0.75w, 1w, 1.25w and 1.50w depth anomalies, respectively. Those variations occurs at 16589, 16567, 16545, 16535 and 16530 Hz frequencies for 0.5w, 0.75w, 1w, 1.25w and 1.50w depths respectively. It can be noted that the maximum absolute deviations occur at high frequencies for all considered cases. These deviations are observed at an almost identical frequency (around 16550 Hz) for all studied cases. This can also be shown that these differences correlate linearly with increasing depth d parameter.
By taking into account, for example, the results of the swelling case in “Canal4” available in Table 3, it can be observed that the deviations in resonance frequency varies from -0.24% for the height of 0.1w to -16.5% for the height of 1.5w. This shows that the resonance frequency varies linearly with the height / depth of the anomaly. It can also be found that the SPL deviation at the resonance frequency varies from -0.87% at a height of 0.1w to -9.55% at a height of 1.5w. This shows that the SPL at resonance frequency varies in an exponential manner with the height/depth of the anomaly.
Reading from Table 3, maximum relative deviations in terms of frequency resonance and SPL at those frequencies are all observed for 1.5w, which is the highest depth/height value considered in the analysis. In the case of “Canal4” with a 1.5w depth swelling, the deviation is -16.5%, -11%, -5.49% at the first, the second and the third resonant frequencies respectively. The deviation in SPL is -9.55%, -17%, -26.7% at the first, the second and the third resonant frequencies respectively.
The effect of increasing the anomaly depth is most pronounced for RF-1. This effect is less significant for RF-2 and even less for RF-3. The opposite effect is observed with respect to the SPL at these frequencies. The same observation can be made from both canals (4 and 6) as well as the two anomalies (cavity and swelling).
5. Conclusion
An investigation is conducted in this paper with the purpose of better understanding the influence of some abnormalities which may cause tinnitus. A previously developed and validated acoustic model associates an acoustic resonator with each part of the outer ear. Such resonators can have several forms which may be used to model a human auditory canal. The model is used for adding various anomalies into it, either by incorporating acoustic resonators or by operating on the parameters of it. The abnormalities examined are those that may induce a change in the external auditory canal section, or an alternation in the external ear ‘s sound transmission medium.
The acoustic model is applied to two auditory canals that are found in the literature where anomalies are inserted. A parametric study is conducted taking into account the influence of an anomaly’s location, width and depth simulating an obstacle on the outer ear’s frequency response. This research also discusses the influence of the propagation speed of sound in the ear canal to model a form of ear condition like swimmer’s ear. This is done by contrasting the frequency response of a healthy external ear to an external ear with an anomaly.
It can be concluded in the light of the results that the presence of fluid in the ear canal tends to decrease its number of resonant frequencies in the audible band. The more fluid the ear canal has, the higher the resonant frequency and the higher the sound pressure level at it.
A swelling at the entrance of the auditory canal or a cavity at the end of it may result in a significant drop in the first resonance frequency value. The finding at the second frequency of resonance is entirely inverted. A swelling effect causes this frequency to drop for the third resonance frequency at the input and output of the auditory canal. A cavity at the end of the auditory canal functions in the same way. The auditory canal SPL’s response decreases exponentially with an increase in the anomaly’s width. The effect of the anomaly width increase is the maximum for first resonant frequency. The drop in SPL at third resonance frequency is the most significant.
The effect of the anomaly’s height is less significant than the other parameters studied, but remains very important especially for the case of swelling. For this case, the more the height of the anomaly, the more probability of hearing loss can be expected. The deviation between the resonant frequency for the healthy canal and the one with anomaly correlate linearly with increasing height/depth parameter. However, the deviation of the SPL at resonance frequency varies exponentially with the height/depth.
Across all the cases analyzed, it is observed that, when contrasting it with the swelling anomaly, the cavity has less effect on the frequency response of the auditory canal. This is due to the fact that the swelling in the ear canal presents an obstacle while the cavity presents a wider opening. The frequency response of auditory canals with the same anomaly is not identical. This amounts to the disparity of their anatomies.
All anomalies cause changes in SPL, resulting in increases in some frequency ranges and, at the same time, attenuation in other ranges. This can lead to hearing loss or over-sensitivity to sound having these frequencies. This could lead to tinnitus with severities that rely on the physiology and psychology of the individual.
- C. Coelho, R. Santos, Roberto, K. Campara, R. Tyler, “Classification of Tinnitus” Otolaryngologic Clinics of North America, S0030-6665(20), 30052–9, 2020. https://doi.org/10.1016/j.otc.2020.03.015
- J. M. Bhatt, H. W. Lin, N. Bhattacharyya, “Prevalence, severity, exposures, and treatment patterns of tinnitus in the United States” JAMA Otolaryngol Head Neck Surg., 142(10), 959–965, 2016. https://doi.org/10.1001/jamaoto.2016.1700
- E. A. Masterson, C. L. Themann, S. E Luckhaupt, J. Li, G. M. Calvert, “Hearing difficulty and tinnitus among US workers and non-workers in 2007” American Journal of Industrial Medicine, 59(4), 290–300, 2016. https://doi.org/10.1002/ajim.22565
- E. Josse, Les acouphènes. Traitement par l’hypnose, Resilience-pys, 2006.
- K. J. Trevis, N. M. McLachlan, S. J. Wilson, “Cognitive Mechanisms in Chronic Tinnitus: Psychological Markers of a Failure to Switch Attention” Frontiers in psychology, 7, 2016. https://doi.org/10.3389/fpsyg.2016.01262
- D. Ivansic, O. Guntinas-Lichius, B. Müller, G. F. Volk, G. Schneider, C. Dobel, “Impairments of Speech Comprehension in Patients with Tinnitus-A Review” Frontiers in aging neuroscience, 9, 2017. https://doi.org/10.3389/fnagi.2017.00224
- P. Hyvärinen, “Neurophysiologically-based approaches to tinnitus diagnostics and treatment,” Ph.D Thesis, Aalto University, 2016.
- L. Jagoda, N. Giroud, P. Neff, A. Kegel, T. Kleinjung, M. Meyer, “Speech perception in tinnitus is related to individual distress level – A neurophysiological study” Hearing Research, 367, 48–58, 2018. https://doi.org/10.1016/j.heares.2018.07.001
- B. Langguth, A. B. Elgoyhen, “Current pharmacological treatments for tinnitus” Expert Opinion on Pharmacotherapy, 13(17), 2495–2509, 2012. https://doi.org/10.1517/14656566.2012.739608
- D. A. Colucci, “Insomnia and Tinnitus: A Worrisome Cycle” The Hearing Journal, 70(6), 43–45, 2017. https://doi.org/10.1097/01.HJ.0000520670.39014.4c
- S. Weidt, A. Delsignore, M. Meyer, M. Rufer, N. Peter, N. Drabe, T. Kleinjung, “Which tinnitus-related characteristics affect current health-related quality of life and depression? A cross-sectional cohort study” Psychiatry Research, 237, 114–121, 2016. https://doi.org/10.1016/j.psychres.2016.01.065
- T. Rodebaugh, E. Lenze, “Tinnitus” JAMA, 323, 2020. https://doi.org/10.1001/jama.2020.0697
- E. Coulon, “Les acouphènes ou l’impossible silence: étiologie, physiopathologie et tentatives de traitement, ” Ph.D Thesis, Mixed Faculty Of Medicine And Pharmacy Of Rouen, 2002.
- I. Adamchic, T. Toth, C. Hauptmann, M. Walger, B. Langguth, I. Klingmann, P. A. Tass, “Acute effects and after-effects of acoustic coordinated reset neuromodulation in patients with chronic subjective tinnitus” NeuroImage: Clinical, 15, 541–558, 2017. https://doi.org/10.1016/j.nicl.2017.05.017
- B. Mazurek, H. Olze, H. Haupt, A. J. Szczepek, “The more the worse: the grade of noise-induced hearing loss associates with the severity of tinnitus” International Journal of Environmental Research and Public Health, 7(8), 3071–3079, 2010. https://doi.org/10.3390/ijerph7083071
- O. Zagólski, “Management of Tinnitus in Patients with Presbycusis” International Tinnitus Journal, 12(2), 175–178, 2006.
- N. Julien, O. Sterkers, “Les acouphènes” La vie médicale, 16, 661–667, 1990.
- P. S. Guth, J. Risey, W. Briner, P. Blair, H. T. Reed, G. Bryant, C. Norris, G. Housley, R. Miller, “Evaluation of amino-oxyacetic acid as a palliative in tinnitus” Annals of Otology, Rhinology, and Laryngology, 99(1), 74–79, 1990. https://doi.org/10.1177/000348949009900113
- R. Salvi, E. Lobarinas, W. Sun, “Pharmacological Treatments For Tinnitus: New And Old” Drugs of the future, 34(5), 381–400, 2009. https://doi.org/10.1358/dof.2009.034.05.1362442
- E. C. Nam, R. Lewis, H. H. Nakajima, S. N. Merchant, R. A. Levine, “Head rotation evoked tinnitus due to superior semicircular canal dehiscence” The Journal of Laryngology & Otology, 124(3), 333–335, 2010. https://doi.org/10.1017/S0022215109991241
- D. M. Baguley, D. McFerran, D. Hall “Tinnitus” The Lancet, 382(9904), 1600–1607, 2013. http://doi.org/10.1016/S0140-6736(13)60142-7
- R.F. Cima, D. Kikidis, B. Mazurek, H. Haider, C Cederroth, A. Noreña, A. Lapira, A. Bibas, D. Hoare, “Tinnitus healthcare: a survey revealing extensive variation in opinion and practices across Europe” BMJ Open, 10, 2020. http://doi.org/10.1136/bmjopen-2019-029346
- F. Zamiri, M. Moosapour, R. Hoseinabadi, “Tinnitus Treatments and Managements” Global Journal of Otolaryngology, 13(5), 01–04, 2018. https://doi.org/10.19080/GJO.2018.13.555874
- R.S Hallam, S.C Jakes, C. Chambers, R. Hinchcliffe, “A comparison of different methods for assessing the intensity of tinnitus” Acta Otolaryngol, 99, 501–508, 1985. https://doi.org/10.3109/00016488509182253
- H. Selye, Du rêve à la découverte, Éditions de La Presse, 66–68, 1973.
- T. Fuller, R. F. Cima, B. Langguth, B. Mazurek, J. Vlaeyen, D. Hoare, Cognitive behavioural therapy for tinnitus, Cochrane Database of Systematic Reviews, 2020. http://doi.org/10.1002/14651858.cd012614.pub2
- P. J. Jastreboff, “25 Years of tinnitus retraining therapy” HNO, 63, 307–311, 2015. https://doi.org/10.1007/s00106-014-2979-1
- C. Formby, R. Scherer, “Rationale for the Tinnitus Retraining Therapy Trial” Noise & health, 15, 134–142, 2013. https://doi.org/10.4103/1463-1741.110299
- K. M. Reavis, V. S. Rothholtz, Q. Tang, J. A. Carroll, H. Djalilian, F. G. Zeng, “Temporary suppression of tinnitus by modulated sounds” Journal of the Association for Research in Otolaryngology : JARO, 13(4), 561–571, 2012. https://doi.org/10.1007/s10162-012-0331-6
- R. Soleimani, M. M. Jalali, T. Hasandokht, “Therapeutic impact of repetitive transcranial magnetic stimulation (rTMS) on tinnitus: a systematic review and meta-analysis” European archives of oto-rhino-laryngology, 273(7), 1663–1675, 2016. https://doi.org/10.1007/s00405-015-3642-5
- M. Pedemonte, Chapter 7 – Tinnitus treatment during sleep, The auditory system in sleep 2nd edition, 2018. https://doi.org/10.1016/B978-0-12-810476-7.00007-5
- ATA Newsletter, American Tinnitus Association, 10(1), 1–4, 1985.
- P. Neff, L. Zielonka, M. Meyer, B. Langguth, M. Schecklmann, W. Schlee, “Comparison of Amplitude Modulated Sounds and Pure Tones at the Tinnitus Frequency: Residual Tinnitus Suppression and Stimulus Evaluation” Trends in hearing, 23, 1–16, 2019. https://doi.org/10.1177/2331216519833841
- R. M. Johnson, J. Fenwick, “Masking Levels (Minimum Masking Levels) and Tinnitus Frequency” The Journal of Laryngology & Otology, 98(S9), 63–66, 1984. https://doi.org/10.1017/S1755146300090132
- M. Ralli, A. Greco, R. Turchetta, G. Altissimi, M. de Vincentiis, G. Cianfrone, “Somatosensory tinnitus: Current evidence and future perspectives” Journal of International Medical Research, 45(3), 933–947, 2017. https://doi.org/10.1177/0300060517707673
- G. Shekhawat, K. Kobayashi, G. Searchfield, “Methodology for studying the transient effects of Transcranial Direct Current Stimulation combined with Auditory Residual Inhibition on Tinnitus” Journal of Neuroscience Methods, 239, 28–33, 2014. https://doi.org/10.1016/j.jneumeth.2014.09.025
- H. Teismann, A. Wollbrink, H. Okamoto, G. Schlaug, C. Rudack, C. Pantev, “Combining transcranial direct current stimulation and tailor-made notched music training to decrease tinnitus-related distress–a pilot study” PloS one, 9(2), 1–11, 2014. https://doi.org/10.1371/journal.pone.0089904
- J. Melloui, O. Bouattane, J. Bakkoury, “Study of the effect of a cause of tinnitus on the resonant frequency of the outer ear” in 1st International Conference on Innovative Research in Applied Science, Engineering and Technology (IRASET), Meknes, Morocco, 2020. https://doi.org/10.1109/IRASET48871.2020.9092217
- B.B. Ballachanda, “Theoretical and applied external ear acoustic” Journal of the American Academy of Audiology, 8(6), 411–420, 1998.
- E. A. G. Shaw, Acoustical Characteristics of the Outer Ear, Encyclopedia of Acoustics, M.J. Crocker (Ed.), 1325–1335, 2007. https://doi.org/10.1002/9780470172537.ch105
- J. Melloui, O. Bouattane, J. Bakkoury, “Acoustic model of the human outer ear” International Journal of Engineering & Technology, 7(4), 3286–3293, 2018. https://doi.org/10.14419/ijet.v7i4.15842
- H. Hudde , A. Engel, “Measuring and modeling basic properties of the human middle ear and ear canal. Part II: Ear canal, middle ear cavities, eardrum, and ossicles” Acta Acustica united with Acustica, 84(5), 894–913, 1998.
- M.R. Stinson, B.W. Lawton, “Specification of the geometry of the human ear canal for the prediction of sound pressure level distribution” The Journal of the Acoustical Society of America, 85(6), 2492-2503, 1989. https://doi.org/10.1121/1.397744