The Sound of Trust: Towards Modelling Computational Trust using Voice-only Cues at Zero-Acquaintance
 , Syibrah Naim 2, Zahid Akhtar 3, Ahmad Sufril Azlan Mohamed 1, Kamran Siddique* 4
Adv. Sci. Technol. Eng. Syst. J. 5(4), 469–476 (2020);
 DOI: 10.25046/aj050456
Trust is essential in many interdependent human relationships. Trustworthiness is measured via the effectiveness of the relationships involving human perception. The decision to trust others is often made quickly (even at zero acquaintance). Previous research has shown the significance of voice in perceived trustworthiness. However, the listeners’ characteristics were not considered. A system has yet to be produced that can quantitatively predict the degree of trustworthiness in a voice. This research aims to investigate the relationship between trustworthiness and different vocal features while considering the listener’s physical characteristics, towards modelling a computational trust model. This study attempts to predict the degree of trustworthiness in voice by using an Artificial Neural Network (ANN) model. A set of 30 audio clips of white males were obtained, acoustically analyzed and then distributed to a large group of untrained Malaysian respondents who rated their degree of trust in the speakers of each audio clip on a scale of 0 to 10. The ANOVA test showed a statistically significant difference of trust ratings across different types and intensities of emotion, duration of audio clip, average fundamental frequencies, speech rates, articulation rates, average loudness, ethnicity of listener and ages of listener (p <.01). The findings conclude that Malaysians tend to trust white males who talk faster and longer, speak louder, have an f0 between 132.03Hz & 149.52Hz, and show a neutral emotion or rather stoic (arousal<.325). Results suggest that Indians are the most trusting Malaysian ethnic group, followed by Bumiputera from East Malaysia and then followed by Malays. Chinese are the least trusting Malaysian ethnic group. The data was fed into an ANN model to be evaluated, which yielded a perfect percentage accuracy (100%) in degree of trustworthiness 39.70% of the time. Given a threshold of two-point deviation, the ANN had a prediction accuracy of 76.86%.
1. Introduction
Trust is a fundamental part of various commercial and interpersonal relationships, especially wherever risk, uncertainty, or interdependence exist. Human trust is influenced by perception, intuition, environment and many other factors to the human centred scheme that is generally defined in any communication systems, natural and synthetic environment in everyday human interaction. Investigating state of the art in theoretical studies in trust and extending the finding as a base to symmetrically model and simulate trust in synthetic agents is crucial, especially in this digital era. In [1] it is stated that an abundance of information about other people can be determined through only a quick observation of their expressive behaviour. Humans can gauge trustworthiness in zero acquaintance situations [1], [2]. Zero acquaintance is a situation in which perceivers make judgments about targets they are given no opportunity to interact with [3]. Several other studies have been conducted previously with regards to zero acquaintance [4]–[7], with each experiment utilizing thin slices that last from 5 seconds to 30 seconds each. In a successful study by Mohammad and Kiritchenko [8], only short 10-second audio clips were used to detect the effects of prosodic features of voice on personality. Therefore, the 10s length is enough to capture personality impressions at zero acquaintance while lightening the load on the listeners.
In recent years, many studies have shown the significance and importance of voice in perceived trustworthiness. These studies have analysed the effect of various vocal cues (e.g., pitch, speech rates, and fundamental frequency (f0)) on trustworthiness. However, prior research did not consider the characteristics of the listener (the rater/ trustor). It is important to include the characteristic of the listener as well, since trust is a concept that involves two parties [9].
Recently, chatbots or robots have started taking over the roles of teachers and tutors [10]. One such example of a chatbot would be Jill Watson, who was created to handle forum posts by students [11]. However, chatbots communicate primarily via text, which would be inconvenient visually impaired students or students who suffer from dyslexia. Furthermore, [12] indicated that a chatbot’s suggestions are not fully trusted by humans. Since voice has a significant impact on perceived trustworthiness, people might trust the chatbots more if the chatbots had a trustworthy voice. Therefore, this research aims to determine the specific characteristics displayed in a “trustworthy” voice. When it comes to chatbots, many studies have been conducted to investigate the aptitude and efficiency of the chatbot applications, ignoring the voice characteristics. One interesting study in the potential of having chatbot imitate human ability during a conversation is by [13]. The outcome of the study showed that the “uncanny valley” effect (where people become uncomfortable to a lifelike robot to a certain point) is lowered by using psychophysiological responses in simple chatbox developments compared to a multifaceted one.
A prediction model would be useful to measure the degree of trustworthiness of the chatbot’s synthetic voice before releasing it to the public. There has yet to be a system that can quantitatively predict the degree of trustworthiness in a voice.
This research aims to investigate the relationship between vocal cues and trustworthiness at zero acquaintance, and to predict the degree of trustworthiness of a voice by using an Artificial Neural Network (ANN) model. However, there are several constraints.
Firstly, the chosen audio clips only consist of white male speakers and the accents of the voices are therefore only limited white accents. Secondly, the survey does not consider the listener’s emotional state at the point of answering. Thirdly, due to time and financial constraints, this survey was only open to Malaysians. Hence, all the findings of this study are only valid and applicable among Malaysians.
2. Background and Related Work
In recent years, the significance of voice in perceived trustworthiness has been investigated in many previous studies [14]–[18]. Many papers have also investigated the effect of individual vocal cues on trust at zero acquaintance.
In [19] it is noted that pitch has a small role in detecting cheating probability of infidelity among committed romantic partners, but it does not represent the entire picture. Hughes and Harrison [19] did not consider other acoustical measures or any combination of different acoustic measures in the research.
The authors in [20] utilized data-driven voice computational modelling to study the relationship between acoustics and perceived trustworthiness in the single word “hello”. The findings demonstrate a strong acoustical basis for perceived voice personality. However, this research did not take the listener characteristics into consideration at all.
In [18] it is investigated the effect of trustworthiness impressions on vocal expressive and person characteristics and how the relationship can be explained by acoustical profiles. In [18] it is indicated that positive speaker valence but not arousal, consistently predict greater perceived trustworthiness. Furthermore, female as compared with male speakers and younger voices compared with older were perceived as more trustworthy. However, [18] did not consider the ethnicity of the listener. Ethnicity of listeners is vital as interpersonal trust is largely influenced by culture [21]–[23].
A computer based, acoustic profile of Steve Job’s tone of voice was created by Niebuhr et al. [24] Findings indicate that all the melodic features of charisma could be found in his tone of voice. However, this study is purely from the author’s assumption of Steve Jobs as a charismatic speaker, and the author did not take into consideration the perception of the general public. Furthermore, this study only investigated the perception of charisma in a voice and not trustworthiness.
With regards to evaluating the voice of an artificial intelligence (A.I.) instructor, [10] indicated that students who perceive themselves as being “older” trust the older A.I. voice more than a younger A.I. voice. Although this study did consider the listener’s age, they did not consider other acoustic or prosody characteristics of the A.I. instructor’s voice.
There also exists some degree of dissension regarding the direction of association between fundamental frequency (f0) and trustworthiness. On one hand, a deception study indicated that participants consistently raised their f0 when lying [25] while another study indicated the opposite [26]. Yet another further study found no differences in f0 or other acoustic characteristics when analyzing deceptive and truthful messages [27]. This situation highlights the fact that there exist inconsistent results from research regarding the direction of association between fundamental frequency (f0) and trustworthiness.
Research has also used prosody features to measure trustworthiness. In [28] the authors used the investment game to assess the effect of prosody characteristics on trust attributes. Although higher investments (higher trust) were associated with faster articulation rate and higher pitch, this finding might have been influenced by game behavior and game turn, both of which have the highest effect on investments (trust).
Evidently, previous research has only considered the impact of several different vocal cues on trust at zero acquaintance. This research aims to provide a more comprehensive analysis of the effect of vocal cues on trust at zero acquaintance by including more vocal features. The specific acoustic characteristics that will be investigated in this research are (a) Mean f0 (b) Min f0 (c) Max f0 (d) Mean Intensity/Loudness (e) Min Intensity (f) Max Intensity (g) Articulation Rate (h) SD of f0 (i) Speech Rate.
Most of the researches mentioned did not consider the characteristics of the listener (the rater). When the characteristics of the listener were considered, the ethnicity of the listener was not taken into consideration. It is important to include the characteristics of the listener as well, since trust is a concept that involves two parties [9]. This study will, at the very least, take the physical characteristics of the listener into consideration e.g. age, gender, English proficiency, and ethnic groups. In addition to that, this study will also consider the arousal and valence of the emotion displayed by the speaker.
3. Recent Algorithms Used to Measure / Predict Trust
Very few studies have attempted to quantitatively measure the degree of trustworthiness. Korovaiko and Thomo [29] have attempted to predict trust from online review ratings by using Random Forest models and Support Vector Machines, and [30] have tried predicting trust and distrust between two strangers in social networks by using an inference algorithm. Finally, complete content and organizational editing before formatting. Please take note of the following items when proofreading spelling and grammar.
ANN models have also been used to create a broker-assisting trust and reputation system and to investigate the potential determinants of relationship quality in relationship marketing [31, 32]. Although the research conducted by [32] is closely related to this research, it considers trust as one of the measurements of relationship quality instead of the feature to be predicted.
Lee et al. [33] used a Trust Hidden Markov Model to predict whether an individual is willing to behave cooperatively (trust) with their novel partner based on gestural cues. Although Lee et al. [33] does use artificial intelligence to predict trust at zero acquaintance, this research investigates the effect of gesture and not voice on interpersonal trust.
Evidently, there has been no prior research using artificial intelligence to predict the degree of trustworthiness in a person’s voice. Therefore, this study aims to predict the degree of trustworthiness in a person’s voice by using an ANN model that will take both the acoustic characteristics of the speaker’s voice and the physical characteristics of the listener into consideration.
A typical artificial neural network model (ANN) was used in this research. The ANN is a feedforward neural network with an input layer of source neurons, one or more hidden layer(s) of computational neurons, and an output layer of computational neurons. The input layer receives input signals and redistributes these signals to all neurons in the hidden layer. The hidden layer detects the features and represent the features in the input patterns by manipulating the weights of the neurons. The output pattern of the entire network is established by the output layer. The ANN is also capable of supervised learning through the backpropagation learning algorithm. In other words, the ANN is able to learn from its mistakes and improve the accuracy of its predictions automatically [34].
The use of a feedforward backpropagation ANN model was due to several reasons: a) capable of supervised training, b) minimization of training errors, c) robustness to noisy data, d) high computational speed across large input datasets. The main disadvantage is the many variables and the training time which must be considered when constructing an ANN.
In this experiment, a large number of variables must be considered when predicting the degree of trustworthiness, where the exact relationship between each variable on trustworthiness still remains a mystery. As such, the use of an ANN model is the most suitable approach to represent such a complex relationship and adequately predict the degree of trustworthiness in a voice.
4. Materials and Methods
The methodology undertaken in this research is similar to the methodology undertaken by Hughes and Harrison [19], Imhof [35] and Smith et al. [36]. Participants were informed about the study procedure and given the option to opt out of the online survey at any point of time.
4.1. Participants
This study was conducted in Universiti Sains Malaysia. Malaysia has a multicultural population that consist of 3 main ethnic groups; Chinese, Malay and Indian. There also exist other minority ethnic groups from East Malaysia, such as Kadazans, Bajaus and Dayaks [37], [38]. Since these minority ethnic groups share the bumiputera (native/indigenous) status with the Malays, we will consider this minority ethnic groups as “Other Bumiputera”.
In total, the participants of this study consisted of 86 Malaysian individuals (44 men and 42 women) of which 40 were Chinese, 21 were Malay, 15 were Indian and only 10 were from Other Bumiputera. The participants had a mean age of 24.337 years (SD 5.517, 17-53). 64 of them (74.42%) were students while 22 (25.58%) were non students. The participants were also asked to rate their own English proficiency. 12 (13.95%) participants considered their English to be Highly Proficient, 35 (40.70%) satisfactory, 19 (22.09%) proficient, 15 (17.44%) modest, 2 (2.33%) expert and 3 (3.49%) limited command of English.
4.2. Stimuli
Six labelled audio clips were sourced from the One-Minute Gradual-Emotion Recognition (OMG-Emotion) dataset [39]. The dataset comprises of 567 YouTube videos, which were divided into clips of varying length and labelled based on utterances. At least five independent subjects annotated each utterance using an arousal/valence scale and emotion tags based on the six universal emotions from Ekman (fear, disgust, happiness, sadness, surprise and anger) [40].
The 6 audio clips to be used in this research were chosen based on the following conditions: a) each audio clip must be about 10s long, b) it must be from a white male speaker and c) there must be a balanced number of audio clips representing each different emotion.
The audio clips were digitally manipulated with Praat into a higher and lower pitch and speech rate version. The degree to which it was manipulated was based from previous research conducted by [41], [42]. This manipulation results in a total of 30 audio clips being formed (6 original and 6*4 modified clips), which will be used for this research.
The following acoustic characteristics of each audio clip was extracted with Praat and tabulated: (a) Mean f0 (b) Min f0 (c) Max f0 (d) Mean Intensity/Loudness (e) Min Intensity (f) Max Intensity (g) Articulation Rate (h) SD of f0 (i) Speech Rate.
4.3. Procedure
86 Malaysian respondents were asked via an online survey to listen to the audio clips and rate their degree of trust in the speakers of each audio clip on a scale of 0 to 10 (0 being absolutely untrustworthy and 10 being most trustworthy). Respondent details such as whether they were Malaysian or non-Malaysian, Student or nonstudent, Gender, Age, Ethnicity and English proficiency were also collected in the survey. The responses were recorded and tabulated.
Each individual response was mapped to the acoustic characteristics and the emotion annotations of the respective audio clips as obtained from the data set. After data cleaning, the total number of valid participants were reduced to 74 (N=2220).
Analysis of Variance (ANOVA) was used to evaluate the null hypothesis that there is no statistically significant difference between each vocal cue or rater characteristic on the trustworthiness ratings. Each vocal cue or rater characteristic was used as the dependent variable and the trust ratings were used as the independent variable. The Welch test was used when the vocal cues violated the assumption of homogeneity of variance.
Since arousal and valence are closely related, a Multivariate Analysis of Variance (MANOVA) test was conducted with arousal and valence as the dependent variables and trust ratings as the independent variable. However, the ANOVA and MANOVA test does not tell us exactly how the mean varies between different groups of the data. Therefore, a means plot of each vocal cue on trust rating was carried out.
The data was split into train, validation and test sets. The train set trained the neural network and the validation set verified the prediction accuracy. Finally, the model was run on the test set to determine the model performance on unfamiliar data.
4.4. Artificial Neural Networks
A feedforward backpropagation ANN was used in this research. The model aims to obtain a low mean-squared-error (MSE) as well as a high percentage of low-deviation predictions. The network was built with Keras API. The model was compiled with Adam optimizer with learning rate = 0.0005, β1 = 0.9, β2 = 0.999, =None, decay=0.0003 and amsgrad=False. The loss function used in this neural network is categorical cross-entropy, with mean squared error and accuracy as the metrics for checkpointing.
After many simulations, the architecture of the ANN that produced the lowest mean squared error is as follows:
- Input layer: Dense,28 input neurons, ReLu activation.
- Hidden layer: Dense, 40 neurons, ReLu activation.
- Dropout layer: Dropout rate=0.2
- Hidden layer: Dense, 30 neurons, ReLu activation
- Dropout layer: Dropout rate=0.4
- Hidden layer: Dense, 16 neurons, ReLu activation
Output layer: Dense, 11 output neurons, Softmax activation
The data underwent feature selection with the score function f_classif from SelectKBest prior to being used for ANN. Findings indicate that only the maximum f0, average f0 and minimum f0 had insignificant results (p > .05) and hence these features were removed from the data set. The input layer of the ANN has 28 nodes for each of the acoustic characteristics, emotion annotations as well as listener characteristics. The output layer has 11 nodes for predicting the degree of trust on a scale of 0 to 10. Softmax activation was used in the output layer for multiclass classification.
The model was fit with the training data set (n=1506) and run over 600 epochs, with batch size of 12 and the validation data set (n=377) was simultaneously used to check for overfitting. EarlyStopping callback was used to ensure minimal overfitting by monitoring accuracy. Finally, the ANN was tested with the testing dataset.
The predictions obtained were recorded and the results were evaluated by measuring the deviation of the predicted trust ratings from the original. In this study, the threshold for acceptable deviation in predictions is arbitrarily set to 2. This method of model evaluation has not previously been used in any prior research. The use of a novel evaluation approach is due to several reasons.
Firstly, prior research that uses Artificial Intelligence to predict trust considers trust as a binary variable. However, Yulin [43] indicates that trust is a spectrum. To simplify and bin the responses into either trustworthy or untrustworthy would significantly reduce the richness of the data and the subsequent results. Hence, for this study, the author maintains the view of trust as a spectrum instead of binary variables.
By setting the threshold to 2, predictions that are less than or equal to 2 marks away from the actual rating would then also be considered as accurate. As the original purpose of the ANN model is to measure the degree of trustworthiness of a chatbot’s synthetic voice, it is more realistic to provide an acceptable margin of error, rather than ensuring that the model predicts a specific number.
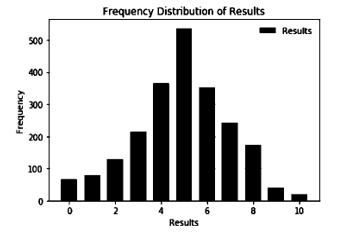 Figure 1 Frequency Distribution of Results.
5. Results
A graphical view of the frequency distribution of the results are shown in Figure 1, It is observed that the results are normally distributed around the mean (µ = 4.90, SD = 2.052) with skewness = -0.228 and kurtosis = -0.060. From Figure 1, it is observed that the majority of trust ratings (n = 537) were 5, and the two extreme trust ratings (0 and 10) were less commonly chosen (n = 68, n=19) respectively.
5.1. The Relationship between Vocal Cues and Trustworthiness
There was a statistically significant difference between arousal of emotion, valence
of emotion, type of emotion, duration of audio clip, speech rate, articulation rate, average loudness, ethnicity of rater and age of rater on trust ratings (p < .01). A more detailed view of the results is shown in Table 1.
Table 1: ANOVA / Welch test results between each individual vocal cue on trust ratings
| Vocal Cue | Type of Test | df1 | df2 | F | p | w |
| Duration | Welch | 10 | 311.15 | 10.73 | 0 | 0.75 |
| Speech rate | ANOVA | 1 | 10 | 4.46 | 0 | 0.14 |
| Articulation rate | ANOVA | 1 | 10 | 5.95 | 0 | 0.16 |
| Average Loudness | Welch | 10 | 306.56 | 4.77 | 0 | 0.58 |
| Arousal | ANOVA | 1 | 10 | 3.36 | 0 | 0.12 |
| Valence | Welch | 10 | 307.34 | 2.41 | 0.009 | 0.4 |
| Age of rater | Welch | 10 | 327.13 | 7.88 | 0 | 0.7 |
There was also a statistically significant difference across trust ratings when considered jointly on arousal and valence. Pillai’s Trace = .028, F (20, 4358) = 3.147, p = .000, partial η2 = .014. The average f0 was split into 4 groups using the first, second and third percentile as cutoff points. The groups were: Low f0 (M=107.03, SD=6.87, n=511), LowMedium f0 (M=125.23, SD=4.52, n=584), Medium-High f0 (M=139.03, SD=5.57, n=511), and High f0 (M=191.19, SD=29.58, n=584). The average f0 was used as the independent variable and the trust ratings were used as the dependent variable. Likewise, the emotion and ethnicity of rater were also used as the independent variable. The results are as shown in Table 2.
Table 2 ANOVA / Welch test results between trust ratings and the groups of each characteristics
| Characteristic | Type of Test | df1 | df2 | F | p | w |
| Emotion | Welch | 5 | 76.69 | 19.05 | 0 | 0.74 |
| Ethnicity of rater | Welch | 3 | 833.733 | 33.29 | 0 | 0.75 |
| Average f0 | ANOVA | 1 | 3 | 12 | 0 | 0.13 |
The means plot indicate that Malaysians trust more when the white male speaker a) speaks for a longer period (12s) than a shorter period (10.5s), b) speaks faster (170wpm and/or 3.6 syllables per second) than slower ( 153wpm and/or 3.1 syllables per second), c) has a louder voice (roughly about 56dB), d) has an average f0 which is between 132.03Hz and 149.52Hz, e) shows a neutral emotion or less emotion (arousal<.3250). Finally, findings among Malaysians indicate that Indians are the most trusting ethnic group with trust ratings of (5.5< µ <5.75), followed by “Other Bumiputera” (5.0< µ <5.25) and then Malay (µ <4.75). Chinese are the least trusting Malaysian ethnic group. Graphical representations of the means plots are as shown in Figure 2 to Figure 9.
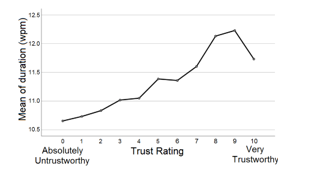 Figure 2 Means plot of duration across trust ratings.
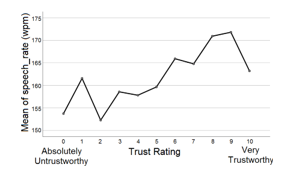 Figure 3 Means plot of speech rate across trust ratings.
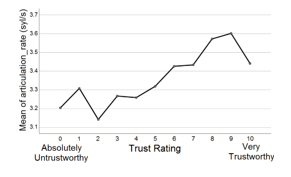 Figure 4 Means plot of articulation rate across trust ratings.
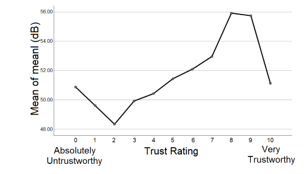 Figure 5 Means plot of loudness across trust ratings.
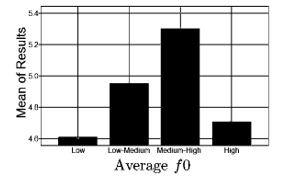 Figure 6 Means plot of f0 across trust ratings.
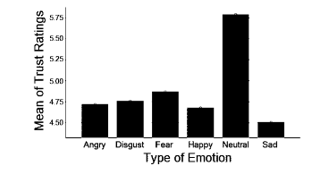 Figure 7 Means plot of emotion across trust ratings.
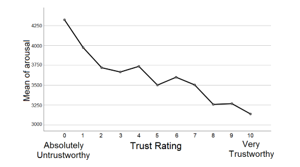 Figure 8 Means plot of arousal across trust ratings.
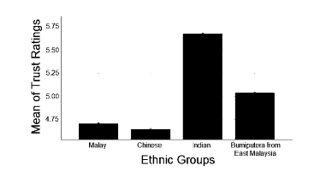 Figure 9 Means plot of ethnic groups across trust ratings.
5.2. Artificial Neural Network
The results of the ANN predictions are as shown in Figure 10, where “freq” represents frequency of occurrence and “difference” represents difference between the predicted and original value. It indicates how much deviation has happened between the predicted results and the original trust rating, and how often that deviation has occurred. Results indicate that the majority of predictions (76.86%) have an acceptable difference (the difference is less than or equal to 2), and only a few predictions (23.14%) are very far off the mark (having a difference of more than 2).
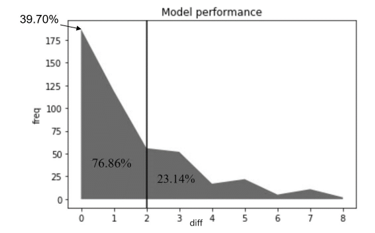 Figure 10 The cumulative percentage performance of ANN.
5.3. Discussion and Conclusion
The accurate predictions of the ANN clearly signify a relationship between vocal cues and trustworthiness. Contrary to previous related research, findings indicate that Malaysians tend to trust white male voices the most when the average f0 of the voices fall between 132.03Hz and 149.52Hz. This could potentially explain the reason behind the degree of dissension regarding the direction of association between different vocal features. It is not a direct association but rather, it is a parabolic curve with its peak when the average f0 is between 132.03Hz and 149.52Hz.
Findings prove that Malaysians tend to trust people who talk faster and for a longer time versus slower and shorter. This could be attributed to knowing more of the context of the audio clip and then judging the perceived trustworthiness according to the speaker’s knowledge of the topic. Results also suggest that Indian Malaysians trust more than the other ethnic groups in Malaysia, while Chinese Malaysians trust the least. The underlying reasons for this relationship are still unknown, and it could potentially be investigated in future work.
Findings show that Malaysians tend to trust people with louder voices. This relationship could be due to the clarity of the audio clip – it is easier to identify the words being said when the voice is louder. Hence, clarity of voice could potentially be used as another variable when carrying out future work.
With regards to the ANN, 39.70% of the testing data set has been perfectly predicted by the neural network. With the threshold set at 2, the percentage accuracy of the neural network has risen to 76.86%. With such high trust prediction accuracy, the neural network model is potentially capable of fulfilling its original purpose.
In conclusion, there was a statistically significant difference between the arousal of emotion, valence of emotion, type of emotion, duration of audio clip, average f0, speech rate, articulation rate, average loudness, ethnicity of rater and age of rater on trust ratings (p < .01).
The findings from this research also conclude that Malaysians tend to trust white males who a) talk faster and longer vs slower and shorter, b) speak louder, c)have an f0 between 132.03Hz and 149.52Hz, d) show a neutral emotion or rather stoic (arousal<.325). Furthermore, results prove that Indians are the most trusting Malaysian ethnic group, followed by Bumiputera [1] from East Malaysia and followed by Malays. Chinese are the least trusting Malaysian ethnic group.
Lastly, the degree of trustworthiness has been quantitatively measured and successfully predicted by using an ANN model. The ANN model perfectly predicts the trustworthiness of a voice to an accuracy of 39.70% and given a threshold of two-point deviation, had a prediction accuracy of 76.86%. This Neural Network model will hopefully prove invaluable when used to predict the degree of trustworthiness in a chatbot’s synthetic voice.
Although these conclusions have been derived and proven to the best of the authors’ abilities, there is still room for further validation. As this research is the first of its kind, especially pertaining to the use of a Neural Network model to predict the degree of trustworthiness in a voice, there is a need for more researchers to replicate or potentially improve the neural network model. Future researchers investigating this topic could possibly expand the variety of audio clips to encompass both male and female voices and people from various races. Future work could potentially include listener’s emotional state and clarity of the audio clip as a factor in perceived trustworthiness. Lastly, this research would bring more value if future researchers are able to obtain responses from an international audience.
Conflict of Interest
The authors declare no conflict of interest.
Acknowledgment
This work was supported by the Research Management Center, Xiamen University Malaysia under the XMUM Research Program Cycle 3 (Grant XMUMRF/2019-C3/IECE/0006). The authors also thank Universiti Sains Malaysia for the partial funding of this work from the grant no. 304/PKOMP/6315137 and 1001/PKOMP/8014001.
- N. Ambady, M. A. Krabbenhoft, and D. Hogan, “The 30-sec sale: Using thin-slice judgments to evaluate sales effectiveness,” J. Consum. Psychol., 16(1), 4–13, 2006. https://doi.org/10.1207/s15327663jcp1601_2.
- M. Stirrat and D. I. Perrett, “Valid Facial Cues to Cooperation and Trust: Male Facial Width and Trustworthiness,” Psychol. Sci., 21(3), 349–354, 2010. https://doi.org/10.1177/0956797610362647.
- D. A. Kenny and T. V West, “Zero acquaintance: Definitions, statistical model, findings, and process,” First impressions), 129–146, New York, Guilford Press, 2008.
- N. Ambady and R. Rosenthal, “Half a minute: Predicting teacher evaluations from thin slices of nonverbal behavior and physical attractiveness.,” J. Pers. Soc. Psychol., 64(3), 431, 1993. https://doi.org/10.1037/0022-3514.64.3.431.
- N. Eisenkraft, “Accurate by way of aggregation: Should you trust your intuition-based first impressions?,” J. Exp. Soc. Psychol., 49(2), 277–279, 2013. https://doi.org/10.1016/j.jesp.2012.11.005.
- M. A. Hecht and M. LaFrance, “How (Fast) Can I Help You? Tone of Voice and Telephone Operator Efficiency in Interactions 1,” J. Appl. Soc. Psychol., 25(23), 2086–2098, 1995. DOI: 10.1111/j.1559-1816.1995.tb02389.x.
- N. Ambady, F. J. Bernieri, and J. A. Richeson, “Toward a histology of social behavior: Judgmental accuracy from thin slices of the behavioral stream,” 32, Academic Press, 201–271, 2000. https://doi.org/10.1016/S0065-2601(00)80006-4.
- S. M. Mohammad and S. Kiritchenko, “Using nuances of emotion to identify personality,” Proc. ICWSM, 2013. https://arxiv.org/abs/1309.6352.
- H. H. Höhmann and E. Malieva, “The concept of trust: Some notes on definitions, forms and sources,” Trust Entrep.), 7–23, 2005.
- C. Edwards, A. Edwards, B. Stoll, X. Lin, and N. Massey, “Evaluations of an artificial intelligence instructor’s voice: Social Identity Theory in human-robot interactions,” Comput. Human Behav., 90, 357–362, 2019. https://doi.org/10.1016/j.chb.2018.08.027.
- A. Goel, B. Creeden, M. Kumble, S. Salunke, A. Shetty, and B. Wiltgen, “Using watson for enhancing human-computer co-creativity,” in 2015 AAAI Fall Symposium Series, 2015.
- A. Følstad, C. B. Nordheim, and C. A. Bjørkli, “What makes users trust a chatbot for customer service? An exploratory interview study,” in International Conference on Internet Science, 2018), 194–208. https://doi.org/10.1007/978-3-030-01437-7_16.
- L. Ciechanowski, A. Przegalinska, M. Magnuski, and P. Gloor, “In the shades of the uncanny valley: An experimental study of human–chatbot interaction,” Futur. Gener. Comput. Syst., 92, 539–548, 2019. https://doi.org/10.1016/j.future.2018.01.055.
- J. Fenwick, L. Barclay, and V. Schmied, “Chatting: an important clinical tool in facilitating mothering in neonatal nurseries,” J. Adv. Nurs., 33(5), 583–593, 2001. https://doi.org/10.1046/j.1365-2648.2001.01694.x.
- N. Bos, J. Olson, D. Gergle, G. Olson, and Z. Wright, “Effects of Four Computer-mediated Communications Channels on Trust Development,” in Proceedings of the SIGCHI Conference on Human Factors in Computing Systems, 2002), 135–140. https://doi.org/10.1145/503376.503401.
- L. Qiu and I. Benbasat, “Online Consumer Trust and Live Help Interfaces: The Effects of Text-to-Speech Voice and Three-Dimensional Avatars,” Int. J. Human–Computer Interact., 19(1), 75–94, 2005. https://doi.org/10.1207/s15327590ijhc1901_6.
- S. Greenspan, D. Goldberg, D. Weimer, and A. Basso, “Interpersonal Trust and Common Ground in Electronically Mediated Communication,” in Proceedings of the 2000 ACM Conference on Computer Supported Cooperative Work, 2000), 251–260. https://doi.org/10.1145/358916.358996.
- A. Schirmer, Y. Feng, A. Sen, and T. B. Penney, “Angry, old, male–and trustworthy? How expressive and person voice characteristics shape listener trust,” PLoS One, 14(1), e0210555, 2019. https://doi.org/10.1371/journal.pone.0210555.
- S. M. Hughes and M. A. Harrison, “Your Cheatin’ Voice Will Tell on You: Detection of Past Infidelity from Voice,” EPsychol., 15(2, p. 1474704917711513, 2017. https://doi.org/10.1177/1474704917711513.
- P. Belin, B. Boehme, and P. McAleer, “The sound of trustworthiness: Acoustic-based modulation of perceived voice personality,” PLoS One, 12(10), 1–9, 2017. https://doi.org/10.1371/journal.pone.0185651.
- P. M. Doney, J. P. Cannon, and M. R. Mullen, “Understanding the influence of national culture on the development of trust,” Acad. Manag. Rev., 23(3), 601–620, 1998. https://doi.org/10.2307/259297.
- D. Gefen and T. H. Heart, “On the need to include national culture as a central issue in e-commerce trust beliefs,” J. Glob. Inf. Manag., 14(4), 1–30, 2006. https://doi.org/10.4018/jgim.2006100101.
- S. Zaheer and A. Zaheer, “Trust across borders,” J. Int. Bus. Stud., 37(1), 21–29, 2006. https://doi.org/10.1057/palgrave.jibs.8400180.
- O. Niebuhr, J. Voße, and A. Brem, “What makes a charismatic speaker? A computer-based acoustic-prosodic analysis of Steve Jobs tone of voice,” Comput. Human Behav., 64, 366–382, 2016. https://doi.org/ 10.1016/j.chb.2016.06.059.
- L. Anolli and R. Ciceri, “The voice of deception: Vocal strategies of naive and able liars,” J. Nonverbal Behav., 21(4), 259–284, 1997.
- M. Zuckerman, R. S. DeFrank, J. A. Hall, D. T. Larrance, and R. Rosenthal, “Facial and vocal cues of deception and honesty,” J. Exp. Soc. Psychol., 15(4), 378–396, 1979. https://doi.org/10.1016/0022-1031(79)90045-3.
- C. Kirchhübel and D. M. Howard, “Detecting suspicious behaviour using speech: Acoustic correlates of deceptive speech–An exploratory investigation,” Appl. Ergon., 44(5), 694–702, 2013. https://doi.org/ 10.1016/j.apergo.2012.04.016.
- I. Torre, L. White, and J. Goslin, “Behavioural mediation of prosodic cues to implicit judgements of trustworthiness,” 2016. https://doi.org/ 10.21437/SpeechProsody.2016-167.
- N. Korovaiko and A. Thomo, “Trust prediction from user-item ratings,” Soc. Netw. Anal. Min., 3(3), 749–759, 2013. https://doi.org/ 10.1007/s13278-013-0122-z
- T. DuBois, J. Golbeck, and A. Srinivasan, “Predicting trust and distrust in social networks,” in 2011 IEEE third international conference on privacy, security, risk and trust and 2011 IEEE third international conference on social computing, 2011, 418–424.
https://doi.org/10.1109/PASSAT/SocialCom.2011.56. - B. Zong, F. Xu, J. Jiao, and J. Lv, “A broker-assisting trust and reputation system based on artificial neural network,” in 2009 IEEE International Conference on Systems, Man and Cybernetics, 2009, 4710–4715. https://doi.org/10.1109/ICSMC.2009.5346098.
- D. Bejou, B. Wray, and T. N. Ingram, “Determinants of relationship quality: an artificial neural network analysis,” J. Bus. Res., 36(2), 137–143, 1996. https://doi.org/10.1016/0148-2963(95)00100-X.
- J.J. Lee, B. Knox, and C. Breazeal, “Modeling the dynamics of nonverbal behavior on interpersonal trust for human-robot interactions,” in 2013 AAAI Spring Symposium Series, 2013. http://hdl.handle.net/1721.1/69244.
- L. Ekonomou, “Greek long-term energy consumption prediction using artificial neural networks,” Energy, 35(2), 512–517, 2010. https://doi.org/10.1016/j.energy.2009.10.018.
- M. Imhof, “Listening to Voices and Judging People,” Int. J. List., 24(1), 19–33, 2010. https://doi.org/10.1080/10904010903466295.
- B. L. Smith, B. L. Brown, W. J. Strong, and A. C. Rencher, “Effects of Speech Rate on Personality Perception,” Lang. Speech, 18(2), 145–152, 1975. https://doi.org/10.1177/002383097501800203.
- M.N. Ismail, S. S. Chee, H. Nawawi, K. Yusoff, T. O. Lim, and W. P. T. James, “Obesity in Malaysia,” Obes. Rev., 3(3), 203–208, 2002. https://doi.org/10.1046/j.1467-789X.2002.00074.x.
- V. Swami and A. Furnham, “Self-assessed intelligence: Inter-ethnic, rural–urban, and sex differences in Malaysia,” Learn. Individ. Differ., 20(1), 51–55, 2010. https://doi.org/10.1016/j.lindif.2009.11.002.
- P. Barros, N. Churamani, E. Lakomkin, H. Siqueira, A. Sutherland, and S. Wermter, “The OMG-Emotion Behavior Dataset,” in Proceedings of the International Joint Conference on Neural Networks, 2018, 2018-July. https://doi.org/10.1109/IJCNN.2018.8489099.
- P. Ekman and W. V. Friesen, “Constants across cultures in the face and emotion.,” J. Pers. Soc. Psychol., 17(2), 124–129, 1971. https://psycnet.apa.org/doi/10.1037/h0030377.
- J. Trouvain, S. Schmidt, M. Schröder, M. Schmitz, and W. J. Barry, “Modelling personality features by changing prosody in synthetic speech,” 2006. https://doi.org/10.22028/D291-25920.
- H. Quené, “On the just noticeable difference for tempo in speech,” J. Phon., 35(3), 353–362, 2007. https://doi.org/10.1016/j.wocn.2006.09.001.
- G. Yulin, “The Spectrum of Trust and Distrust,” Jiangsu Soc. Sci., 1, 2012.