
A CNN-based Differential Image Processing Approach for Rainfall Classification
Volume 5, Issue 4, Page No 438-444, 2020
Author’s Name: Roberta Avanzato, Francesco Beritellia)
View Affiliations
University of Catania, Department of Electrical, Electronic and Computer Engineering, Catania, 95125, Italy
a)Author to whom correspondence should be addressed. E-mail: francesco.beritelli@unict.it
Adv. Sci. Technol. Eng. Syst. J. 5(4), 438-444 (2020); ![]() DOI: 10.25046/aj050452
DOI: 10.25046/aj050452
Keywords: Smart sensors, Video/Image classification, Rainfall estimation, Image processing, Convolutional Neural Networks (CNN)

Export Citations
With the aim of preventing hydro-geological risks and overcoming the problems of current rain gauges, this paper proposes a low-complexity and cost-effective video rain gauge. In particular, in this paper the authors propose a new approach to rainfall classification based on image processing and video matching process employing convolutional neural networks (CNN). The system consists of a plastic shaker, a video camera and a low cost, low power signal processing unit. The use of differential images allows for greater robustness, guaranteeing full background subtraction. As regards precision, speed and ability to adapt to variations in precipitation intensity, the proposed method achieves good performance. In particular, the results obtained from seven classes, ranging from “No rain” to “Cloudburst”, applying the Discrete Cosine Transform (DCT) to the differential images on 16×16 sub-blocks show an average accuracy of 75% considering, also, the adjacent miss-classification. Furthermore, the analysis of precision and sensitivity parameters yields excellent results.
The proposed method is very innovative, in fact, the few studies found in the state of the art use only two classification classes (No rain and Rain), while our method contains seven classification classes and overall delivers very good accuracy performance.
Received: 15 May 2020, Accepted: 17 July 2020, Published Online: 09 August 2020
1. Introduction
In recent years, in many areas of the world, countless calamitous events of hydro-geological origin have occurred. Since these events are difficult to prevent, it is important to be able to accurately estimate the level of rainfall during the occurrence of a meteorological phenomenon.
In the past, the only method for measuring rainfall levels was through the use of traditional rain gauges (such as tilt rain gauges). People have realized, however, that these instruments do not perform well in terms of temporal precision, classification accuracy and territorial coverage. Over the years, different approaches have been studied to tackle this issue, such as the use of radars and satellites [1]-[3].
Weather radars have the advantage of being able to monitor a larger area, but they are very expensive, whereas the satellite has the advantage of better spatial resolution but the disadvantage of providing a less accurate estimate [4]. Recently, due to these limitations, some researchers have studied alternative methods for estimating precipitation levels [5]-[16]. Lately, with the spread of artificial intelligence techniques, new approaches based on advanced neural networks have been introduced in the literature.
In [6]-[7], the authors investigated the use of the radio frequency signal, used in the latest generation cellular systems, as a tool for classifying rainfall intensity levels using pattern recognition method. However, in [17] an acoustic rain gauge has been proposed which is able to classify the rainfall levels in 5 classes through rainfall timbre and deep learning techniques, in particular by applying convolutional neural networks [18], [19].
In order to ensure good performance even in conditions of high environmental noise, in this paper, the authors propose a new type of rain gauge based on the analysis of images obtained from a camera that captures the rain.
In this study, the images of the rain were recorded by inserting a camera pointed towards a transparent lid of an upward-facing plastic shaker. The video signal was also analysed by conducting statistical analysis (mean, variance and first autocorrelation coefficient) of some features, while the Discrete Cosine Transform (DCT) was used to characterize the frequency content of the various frames extracted from the video.
Thanks to the low complexity of the hardware and software, the proposed system allows to generate alerts in very short times with low errors in the estimate of the level of precipitation intensity. Unlike traditional tipping rain gauges, the proposed system does not use mechanical components subject to maintenance, but low cost and consumption electronics, with the possibility of being powered by a photovoltaic panel.
The paper is organized as follows: section 2 briefly summarizes the main studies on the classification of precipitation, section 3 illustrates the characteristics of the database; section 4 describes the acquisition system; section 5 shows the statistical and spectral analysis of the frame of images relating to the different levels of rain; section 6 describes the convolutional neural network used in this study and the dataset in the input; section 7 describes the test bed and the various tests and performance results; section 8 is devoted to conclusions.
2. Proposed Work
This section provides a general overview of new rainfall level estimation methods by analyzing videos recorded over the rain. The intensity of rain, in fact, can undergo tremendous variations even for short distances, less than one kilometer. It is therefore necessary to implement a prevention system especially in areas with high hydrological risk. To obtain measurements with large spatial resolution, it is necessary to distribute a substantial number of instruments such as rain gauges or weather stations, which may, nonetheless, have a major adverse impact in economic terms.
A number of studies on the classification of rainfall levels have been conducted by researchers employing various alternative methods and signals [5], [16].
These different approaches could represent a valid alternative to the typical solutions used in current meteorology. Furthermore, these innovative systems lead to improved performance in terms of time, flexibility and robustness.
In particular, there are numerous papers in which the possibility of classifying the level of rainfall through the attenuation of the electromagnetic signal [5], [6] and many others using the audio signal [6]-[11] is studied.
In this paper, the authors will focus on the use of the video signal as a tool for classifying rainfall levels and therefore this section deal with previously conducted studies in this regard.
In [12] the Electronics and Telecommunications Department of the University of Mumbai developed an algorithm that allows determining the intensity of rainfall based on a single photo only. Data processing takes place implementing a technique denominated ERAUIP, using a high-resolution slow-motion camera, which acquires the image placed on a black background with a minimum speed of 1200 FPS. The camera acquires a color image which, once filtered by noise employing a clustering technique, is converted to gray scale. Subsequently, the image is divided into rows and columns, and therefore further divided into even and odd content. After which the conversion from the gray scale image to the binary image takes place and, finally, the size of the raindrops are measured thanks to the use of a morphological filter.
This technique allows to reach high precision levels, even up to 90%. The performance will depend on the characteristics of the camera used; a full-bodied database of excellent quality images and videos is required in order to achieve better results.
A method for evaluating the raindrops present in images has been proposed in [13]. In this case image processing is performed using the 2D dual density Discrete Wavelet Transform, with the help of 2 cameras with advanced features, so that the 2 captured images have the same central point. This allows obtaining such information as the maximum and minimum size of the raindrop and the number of raindrops from the given image.
In the automotive sector, more and more sophisticated driver assistance systems are being developed to improve safety conditions behind the wheel, especially during adverse rain conditions. An approach used to detect raindrops present on a transparent screen has been developed in the context of research concerning the ITS intelligent transport algorithm, as reported in [14]. This technique detects the fuzzy raindrops that collect on the windshield, differentiating from the previously illustrated techniques as it is not necessary to adjust the focus on the windshield on which the raindrops fall.
Classification of rain levels through the acquisition of images can also be achieved by exploiting the learning abilities of a neural network [15]. In this case, a neural network was trained in order to obtain the detection of the glomerulus in the segments of the renal tissue present in digitized slides, and a classification considering such parameters as heterogeneity, staining, composition within the kidney composition etc. This is done by applying convolutional neural networks (CNN) in order to provide faster and more reliable diagnoses. Nevertheless, enormous amount of computational power is needed to train the network in an appropriate time frame.
The previously mentioned studies outline significant growth in interest concerning the replacement of the classic measurement methods with new instruments which can deliver better performance, guaranteeing a set of information that can cover a large area of the territory.
In [16], the authors propose a method for remote detection of rain via fixed cameras, using CNN. In particular, in the pre-processing phase the Sobel algorithm is used for detecting the edges and subsequently DCT is applied to the obtained images for further experiments in order to improve the classification scores. The classification results using the Sobel algorithm and the DCT are respectively 91.97% and 79.89%. There are only 2 classes considered: “Rain” and “No Rain”.
Unlike all the studies present in the state of the art, our method consists in detecting and classifying, as accurately as possible, seven different levels of rainfall intensity. The proposed technique, therefore, allows to set up a rainfall measurement system with the advantage of not having mechanical parts subject to breakdown, good accuracy and high temporal resolution.
3. Database Description
The proposed system consists of a camera connected to a processing unit. The labelling algorithm is located in the processing unit. It is responsible for assigning the video sequences to the corresponding intensity classes thanks to the labelling performed by a traditional tipping rain gauge. After labelling, the video sequences are inserted into the database. Figure 1 shows the block scheme of the video acquisition system.
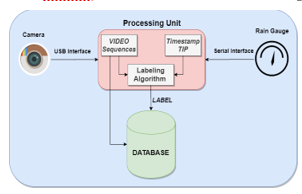 Figure 1: Block Scheme of Video Acquisition System
Table 1: Classification and Rainfall Intensity Range
| Classification | Acronym | Rainfall Intensity [mm/h] |
| No rain | nr | < 0.5 |
| Weak | w | [0.5 ÷ 2] |
| Moderate | m | [2 ÷ 6] |
| Heavy | h | [6 ÷ 10] |
| Very heavy | vh | [10 ÷ 18] |
| Shower | s | [18 ÷ 30] |
| Cloudburst | c | > 30 |
Video sequences are sampled with Frames Per Second (FPS) equal to 30 frames of pixels. Table 1 lists the intensity classes that make up the dataset.
The database was created by recording natural rain characterized by all seven rainfall levels indicated in Table 1. Furthermore, during the rain recording phase, continuous checks were carried out on the tipping rain gauge used for labeling, so as to preserve it from dirt.
An image processing phase, before inserting the input data to the neural network, was applied to the video recordings: extraction of the frames with frame-rate equal to 30 FPS and offset equal to 1 frame; subtraction of the resulting frames from each other. These frames will be referred to as “differential images”.
Differential images are subjected to DCT on sub-blocks. The data obtained from the application of the DCT are standardized and input data to the neural network, described in section 6.2.
The tests were conducted using a camera inserted in a rigid plastic shaker with a transparent lid. The differential frames, relating to the various categories of precipitation, are used as input variables of a deep learning system based on a CNN classifier.
4. Acquisition System Setup
The acquisition system is characterized by the following components, see Figure 2.
- Camera (a);
- Plastic shaker with a transparent cover (b);
- Tipping bucket rain gauge (c);
- Raspberry Pi (d);
- 4G dongle (e).
 Figure 2: Hardware Components of the Acquisition System
The webcam is connected via USB cable to the Raspberry Pi, where the processing phase of the collected data is performed.
The operation of the labeling algorithm implemented within the Raspberry Pi, the connections between the hardware devices in use and the categories of recording intensity are explained in detail in [17]. The 4G modem key allows real-time data transmission [20]. Figure 3 shows the conceptual scheme of the proposed system.
In general, the processing unit implements the labeling algorithm that allows the generation of 30-second video sequences, divided by each class of rainfall intensity.
The video sequences recorded and classified using the labeling algorithm are stored in the database and subsequently provided as input to the neural network for the training phase.
 Figure 3: Conceptual Scheme of the Proposed System
5. Analysis of Video Sequences
The present section deals with visual and statistical analysis of the obtained video sequences in order to further discriminate between different precipitation intensity levels.
The video signal analysis tool, DiffImg, and the calculation tool, Matlab, are used to externally analyse the differential images extracted from the videos.
In particular, DiffImg is a simple image comparison tool which takes two RGB images with the same size as the input. Some statistics are computed, and the positions at which pixels differ.
With this tool, we are able to make a comparison between different images, highlighting the differences. By analyzing the “differential images”, the authors can also view some interesting statistics, including:
- Average error: indicates the difference between the two images in terms of RGB scale value;
- Standard deviation: indicates how much the second image varies compared to the first;
- Total of error pixels: indicates the total amount of different pixels between the first image and the second image (from which the “differential image” is obtained).
After a series of evaluations, it was observed that the most interesting feature to achieve our goal is the standard deviation. To better evaluate the values assumed by this parameter, it was decided to take into consideration 7 frames extracted from the videos, for each level of precipitation, with an interval equal to 1 second.
Subsequently, the value assumed by the standard deviation of the differential image obtained from the differences between consecutive frames was evaluated, so as to obtain a total of six “differential images”. By evaluating the trend of the parameter just mentioned, in particular the average of the standard deviation values, it was observed that this value increases with the increase in the rain level, as we can see in Table 2.
As can be seen from Table 2, there is a slight correlation between the standard deviation and the intensity of precipitation. This is immediately clear if you think that as the rate of rain increases, the number of raindrops and their size increases, so the difference between two frames belonging to higher levels will be more marked than the one between the images belonging to lower intensity levels.
To illustrate the concept discussed so far, a differential frame (taken from 9 “differential image”) for each rainfall level is represented in Figure 4.
Table 2: Standard Deviation for Each Precipitation Intensity
| Rain Classification | Standard Deviation | AVG | |||||
| No rain | 2.0 | 2.0 | 2.0 | 2.1 | 2.1 | 2.0 | 2.0 |
| Weak | 3.6 | 3.3 | 2.8 | 2.4 | 2.7 | 2.5 | 3.0 |
| Moderate | 3.3 | 3.3 | 4.0 | 5.7 | 4.5 | 5.3 | 4.4 |
| Heavy | 3.4 | 8.6 | 5.2 | 5.3 | 7.8 | 5.7 | 5.8 |
| Very heavy | 6.2 | 5.1 | 4.1 | 8.4 | 6 | 5.4 | 6.3 |
| Shower | 4.0 | 8.3 | 9.6 | 10.0 | 8.2 | 9.3 | 8.1 |
| Cloudburst | 17.3 | 7.4 | 10.7 | 15.4 | 8.5 | 11.4 | 11.9 |
From Figure 4 it is possible to note that there is a visible difference between the adjacent precipitation levels from the point of view of the raindrops represented in the frame. For example, it is clear that if in “No rain” class the image is white, in “Weak” the presence of a few raindrops is observed. The same concept may be applied to subsequent levels.
 Figure 4: Examples of “Differential Image” for Each Level of Intensity
Despite some positive results obtained with the methodologies described above, some limits remain which do not allow the implementation of an autonomous system capable of achieving a reliable classification.
The different problems encountered during the experimental phase could be solved by creating a system based on machine learning by carrying out the training of a neural network through the use of more comprehensive and differentiated databases.
6. Convolutional Neural Network for Rainfall Classification
The paper proposes an alternative to traditional rain gauges which is based on the extraction of frames from video sequences. Rainfall levels are classified by applying a convolutional neural network.
6.1. CNN Architecture: SqueezeNet
In this study, the authors use a Convolutional Neural Network (CNN) called SqueezeNet [21]. It is a completely convolutional network with reduced complexity and with layers of dropouts. This network allows to obtain good accuracy and increase performance.
To create a CNN network with reduced complexity, three main strategies are necessary:
- Replace filters with 1×1 filters;
- Reduce the number of input channels on filters;
- Delay downsample on the network so that convolution levels have large activation maps.
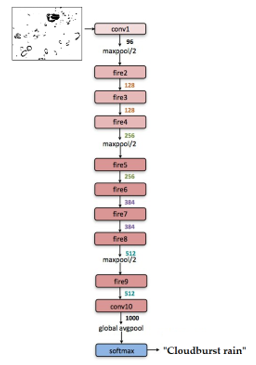 Figure 5: SqueezeNet Architecture
Figure 5 shows the SqueezeNet architecture used. The first layer and the last layer are convolutional layers, in the middle there are eight fire modules where the number of filters per fire module gradually increases. For more details see [21-22].
6.2. Video Learning Dataset
As described in section 3, the learning dataset was created recording the video of the rain. Figure 6 shows the general “Best practices” for inserting standardized matrices into the neural networks. The first block represents the original video, on which the extraction of the frames takes place at a frame-rate of 30 FPS.
Then, the extracted frames are brought in grayscale and subsequently, differentiated by moving between one frame and the next with an offset of 1 frame.
The difference between two images is very simple to obtain, as we know that the images are nothing more than matrices containing numerical values in the RGB (or BW) scale of size M × N. In this regard, it is possible to obtain what we define “differential images” by applying a subtraction between two matrices of the same size.
Therefore, since F1 = M × N is the first extracted frame and F2 = M × N the second extracted frame, the first differential image is given by (1).
![]() From the matrix point of view, let be the elements of the matrix F1, the elements of the matrix F2 and the elements of the matrix with i ∈ {1,…, M} and j∈ {1, …, N}. is obtained by (2).
From the matrix point of view, let be the elements of the matrix F1, the elements of the matrix F2 and the elements of the matrix with i ∈ {1,…, M} and j∈ {1, …, N}. is obtained by (2).
 where K is the number of differential frames obtainable for each level of intensity and is related to the length of the recorded videos, the amount of FPS extracted from the video and the offset used.
In our method, in particular, we have adopted a function in Python language, called “absdiff”, which makes up the difference between two images also reducing the noise that is obtained from a subtraction. In fact, a threshold is set at an arbitrary value between 0 and 255 (threshold 127 was used in this study); all BW pixels greater than 127 become 255; conversely, all BW pixels less than or equal to 127 become 0.
Once the differential images have been transformed into DCT matrices, a division is performed before inserting all the data within the neural network: 70% of these matrices are inserted in the training set and 30% in the test set. For each input, the probability percentage corresponding to each individual class will appear in the output.
6.3. Video Validation Dataset
The validation dataset was created as the dataset used in training and testing the neural network. In particular, the related videos are those that had not been included in the dataset for training the neural network.
The same procedures described in sections 3 and 6.2 of the datasets used for training and testing the network are applied to the component frames of this dataset. The following chapter will analyze the performance of this network, when this validation dataset is applied to the network input.
 Figure 6: Image Processing Flowchart
7. Performance Evaluation
This section will show the results of the training and validation of the convolutional neural network when the “differential images” are used as an input.
The application of the DCT to sub-blocks show an improvement in the classification performance.
In fact, Figure 7 and Figure 8 respectively show the progress of training and test losses and training and test accuracy.
 Figure 7: Training and Test Losses with Sub-block
 Figure 8: Training and Test Accuracy with Sub-block
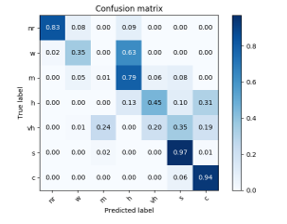 Figure 9: Confusion Matrix with Sub-block
Figure 9 shows the confusion matrix. In this case, the percentage of accuracy of the average classification obtained by applying the DCT to sub-blocks are approximately 49 %, which can reach 75% if the adjacent miss-classifications are not considered.
Once the performance has been defined, it is possible to compare our results with those present in the state of the art, in particular with the study proposed in [16]. The main differences from our study lie in the number of classes used, the methods of image pre-processing and the image capture mode. In fact, in [16] the Sobel algorithm is applied for the elimination of the edges; moreover, the images of the rain are captured in an orthogonal direction to the rain itself. From the performance point of view our study seems to deliver poorer performance, but it is important to note that our method is based on a classification using seven classes, that is, considering seven levels of intensity of precipitation which are fundamental in the context of monitoring the hydrogeological risks.
The use of seven classes to classify the intensity of precipitation and the high temporal resolution of the level of intensity of precipitation allow for a more effective management of alerting mechanisms and therefore prevention and risk management in case of natural disasters-related hydro-geological risk.
8. Conclusions
The paper proposes an alternative to traditional rain gauges which is based on the extraction of differential frames from video sequences. Rainfall levels are classified by applying a convolutional neural network. In particular, the system is very simple, based on a plastic shaker, a video camera and a low cost/low power signal processing unit. Performance is very good in terms of precision and ability to adapt to sudden changes in rainfall intensity. The percentage of accuracy of the average classification obtained by applying the DCT for to “16×16” sub-blocks is approximately 49 %, which can reach 75% if the adjacent miss-classifications are not considered. The new video rain gauge exceeds the limits of traditional ones, as it requires no mechanical parts, specific and periodic maintenance.
Conflict of Interest
The authors declare no conflict of interest.
- J.M. Trabal, D.J. McLaughlin, “Rainfall estimation and rain gauge comparison for x-band polarimetric CASA radars” in 2007 IEEE Int. Geosci. Remote Se, Barcelona, Spain, 2007. 10.1109/IGARSS.2007.4423406.
- D. Nagel, “Detection of Rain Areas with Airborne Radar” in 2017 Int. Radar Symp. Proc., Prague, Czech Republic, 2017. 10.23919/IRS.2017.8008094.
- A. K. Shukla, C.S.P. Ojha, R. D. Garg, “Comparative study of TRMM satellite predicted rainfall data with rain gauge data over Himalayan basin” in 2018 IEEE Int. Geosci. Remote Se, Valencia, Spain, 2018. 10.1109/IGARSS.2018.8651413.
- A. K. Varma, “Measurement of Precipitation from Satellite Radiometers (Visible, Infrared, and Microwave): Physical Basis, Methods, and Limitations”in 2018 Remote Sensing of Aerosols, Clouds, and Precipitation, 2018. https://doi.org/10.1016/B978-0-12-810437-8.00011-6.
- S.H. Fang, Y.H. S. Yang, “The impact of weather condition on radio-based distance estimation: A case study in GSM networks with mobile measurements” IEEE Trans. Veh. Technol., 65(8), 6444–6453, 2016. 10.1109/TVT.2015.2479591.
- F. Beritelli, G. Capizzi, G. Lo Sciuto, C. Napoli, F. Scaglione, “Rainfall Estimation Based on the Intensity of the Received Signal in a LTE/4G Mobile Terminal by Using a Probabilistic Neural Network” IEEE Access, 6, 30865-30873, 2018. 10.1109/ACCESS.2018.2839699.
- E.M. Trono, M.L. Guico, N.J.C Libatique, G.L. Tangonan, D.N.B. Baluyot, T.K.R. Cordero, F.A.P. Geronimo and A.P.F. Parrenas, “Rainfall Monitoring Using Acoustic Sensors” in 2012 TENCON IEEE Region 10 Conference, 2012. 10.1109/TENCON.2012.6412284.
- R. Nakazato, H. Funakoshi, T. Ishikawa, Y. Kameda, I. Matsuda, S. Itoh, “Rainfall Intensity Estimation from Sound for Generating CG of Rainfall Scenes” in Inter. Workshop on Advanced Image Technology (IWAIT), Japan, 2018. 10.1109/IWAIT.2018.8369692.
- N. J. C. Libatique, G. L. Tangonan, R. Gustilo, W. K. G. Seah1, C. Pineda, M. L. Guico, G. Abrajano, R. Ching, J. L. Zamora, A. Espinosa, A. C. Valera, R. Lamac, H. Dy, J. Pusta, E. M. Trono, A. Gimpaya, J. R. San Luis, S. J. Gonzales, A. T. Lotho, “Design of a Tropical Rain – Disaster Alarm System, A New Approach based on Wireless Sensor Networks and Acoustic Rain Rate Measurements” in 2009 IEEE Instr. and Meas. Tech. Conference, Singapore, 2009. 10.1109/IMTC.2009.5168663.
- M. Ferroundj, “Detection of Rain in Acoustic Recordings of the Environment Using Machine Learning Techniques,” Master by Research Thesis, Queensland University of Technology, 2015.
- T. Heittola, E. Cakir, T. Virtanen, “The Machine Learning Approach for Analysis of Sound Scenes and Events” Computational Analysis of Sound Scenes and Events, 2017. https://doi.org/10.1007/978-3-319-63450-0_2.
- S. Sawant, P. A. Ghonge, “Estimation of Rain Drop Analysis Using Image Processing” International Journal of Science and Research, 4(1), 1981 – 1986, 2015. https://www.ijsr.net/search_index_results_paperid.php?id=SUB15661.
- S. Tawade, P. Ghonge, K. Tuckley, “Drop-size analysis using 2D Double Density Dual Tree Discrete Wavelet Transform” in 2016 International Conference on Communication and Signal Processing, 2016. 10.2991/iccasp-16.2017.62
- F. Nashashibi, R. De Charette, A. Lia, “Detection of Unfocused Raindrops on a Windscreen using Low Level Image Processing” in 2010 11th International Conference on Control Automation Robotics and Vision, Singapore, 2010. 10.1109/ICARCV.2010.5707398.
- J. Gallego, A. Pedraza, S. Lopez, G. Steiner, L. Gonzalez, A. Laurinavicius, G. Bueno, “Glomerulus Classification and Detection Based on Convolutional Neural Networks” MDPI Imaging, 4(1), 20, 2018. https://doi.org/10.3390/jimaging4010020.
- J.A. Godoy-Rosario, A.G. Ravelo-García, P.J. Quintana-Morales, J.L. Navarro-Mesa, “An Approach to Rain Detection Using Sobel Image Pre-processing and Convolutional Neuronal Networks” in 2019 Advances in Computational Intelligence, IWANN, Lecture Notes in Computer Science, vol. 11506, pp. 27 – 38. https://doi.org/10.1007/978-3-030-20521-8_3
- R. Avanzato, F. Beritelli, “A Rainfall Classification Technique based on the Acoustic Timbre of Rain and Convolutional Neural Networks” MDPI Information, 11(4), 183, 2020. https://doi.org/10.3390/info11040183.
- F. Beritelli, A. Spadaccini, “The Role of Voice Activity Detection in Forensic Speaker Verification” in 2011 IEEE International Conference on Digital Signal Processing (DSP), Corfu, Greece, 2011. 10.1109/ICDSP.2011.6004980.
- F. Beritelli, A. Spadaccini, “A Statistical Approach to Biometric Identity Verification based on Heart Sounds” in 2010 Fourth International Conference on Emerging Security Information, Systems and Technologies, Venice, Italy, 2010. 10.1109/SECURWARE.2010.23.
- F. Beritelli, A. Gallotta, C. Rametta “A Dual Streaming Approach for Speech Quality Enhancement of VoIP Service Over 3G Networks” in 2013 IEEE International Conference on Digital Signal Processing (DSP), Fira, Greece, 2013. 10.1109/ICDSP.2013.6622816.
- F. N. Iandola, S. Han, M. W. Moskewicz, K. Ashraf, W. J. Dally, K. Keutzer, “Squeezenet: Alexnet-Level Accuracy With 50x Fewer Parameters And <0.5mb Model Size” in 2016 Computer Vision and Pattern Recognition (cs.CV); Artificial Intelligence (cs.AI), 2016. arXiv:1602.07360.
- A. Gholami, K. Kwon, B. Wu, Z. Tai, X. Yue, P. Jin, S. Zhao, K. Keutzer, “SqueezeNet: Hardware-Aware Neural Network Design” in Proc. IEEE CVPR, 2018. arXiv:1803.10615.