
Tidal Propagation Based On Co-Phase Chart and Co-Range Chart in Sunda Strait, Indonesia
Volume 5, Issue 4, Page No 412-418, 2020
Author’s Name: Denny Nugroho Sugianto1,a), Harjo Susmoro2, Khoirol Imam Fatoni2, Virginia Stephanie Claudia1, Haris Djoko Nugroho2
View Affiliations
1Department of Oceanography, Faculty of Fisheries and Marine Science, Center for Coastal Rehabilitation and Disaster Mitigation Studies (CoREM), Diponegoro University, Semarang, 50275, Indonesia
2Hydrography and Oceanography Center, Indonesian Navy, Indonesian Hydrography Council (IHC), Jl. Pantai Kuta V No.1, Ancol Timur, North Jakarta, DKI Jakarta, 14430, Indonesia
a)Author to whom correspondence should be addressed. E-mail: dennysugianto.oceanography@gmail.com
Adv. Sci. Technol. Eng. Syst. J. 5(4), 412-418 (2020); ![]() DOI: 10.25046/aj050448
DOI: 10.25046/aj050448
Keywords: Co-tidal charts, Sunda Strait, Tidal propagation, Indonesia

Export Citations
The characteristic of tide is different for each region. Co-tidal charts are one of the media to present an information about the character of tidal. There are two types of co-tidal chart, such as co-phase chart and co-range chart. Co-phase chart will show the distribution of tides, meanwhile the co-range chart will show the propagation direction of tides. Sunda Strait was chosen to analyze the tidal propagation pattern. The amount of the tidal station which were observed are 33 stations across Sunda Strait. This research used four harmonic constituents of tide, such as M2, S2, K1 O1 and the chart of Sunda Strait to establish co-tidal charts. The harmonic constituent of tide was analyzed by Admiralty Method. These data were obtained from Hydrography and Oceanography Center, Indonesian Navy (PUSHIDROSAL). The result of this research shows the tidal propagation direction of semidiurnal harmonic constituents of tide (M2, S2) that flows in south area of Sunda Strait (comes from Indian Ocean through the western part of Sumatra island). Meanwhile, in north area of Sunda Strait, the tidal propagation that comes from Indian Ocean flows through Karimata Strait. The direction of tidal propagation of diurnal harmonic constituents of tide (K1, SO1) that flows in Sunda Strait comes from Pacific Ocean through Karimata Strait. However, the tidal type in Sunda Strait is dominated by mixed tide prevalling semidiurnal and the highest amount of Z0 is 100 cm, meanwhile the lowest value of Z0 in Sunda Strait is 40 cm.
Received: 22 June 2020, Accepted: 07 July 2020, Published Online: 09 August 2020
1. Introduction
The Sunda Strait is a strait connecting the island of Java and the island of Sumatra in Indonesia. On the other hand, the waters of the Sunda Strait are the waters connecting the Java Sea with the Indian Ocean [1]-[3]. Based on the Constitution of Republic of Indonesia Number 17 of 1985, the Sunda Strait is classified into ALKI I (Indonesian archipelagic sea lane) [4], where the strait connects the waters of the Indian Ocean through the Karimata Strait to the South China Sea or vice versa. Oil and gas transportation routes for energy needs in East Asia other than through the Strait of Malacca are in the Sunda Strait. The Sunda Strait is an alternative route of shipping when the traffic flow in the Malacca Strait is inhibited [5], [6]. Therefore, the Sunda Strait is the route commonly used for international shipping lanes [7], [8] as well as the crossing path from Java Island to Sumatra Island [9]. The depth in the Sunda Strait waters ranges from 0.5 m to 1,885 m [10]-[12]. The number of ships passing through the Sunda Strait from 2007 to 2015 reached by 29,351 units. The number of vessels passing through the Sunda Strait will continue to increase each year, therefore, various regulations are developed to improve the security of traffic in the Sunda Strait [13]. Regulations aim to enhance the security of shipping in the Sunda Strait should be supported by data describing natural phenomena in these waters. One of the natural phenomena at sea that have to be understood is the change of sea level elevation or so-called tidal. Tidal in the hydrographic field is used as an object to reduce the results of bathymetry recording to obtain bathymetry value of an actual water [14]-[17].
Tidal has a dynamic character and its character is different in each region, especially the tides affect the rate of pollutants, sediment transport and erotion [18], [19]. Therefore, to facilitate the presentation of tidal conditions in an area is to use the chart [20]. The co-tidal chart is part of the nautical chart [21], [22]. The nautical chart serves to provide accurate data with a fast presentation system and approaches the actual situation to support maritime activities [23]. Co-tidal charts are divided into co-range chart and co-phase chart. The co-range chart provides information about the amplitude, while the co-phase chart provides information about the phase of the tide characteristics presented in contour lines [24]. More location of data measurement in the waters will facilitate the analysis of the tidal character of these waters. Study of tidal characteristic in Sunda Strait in a form of co-tidal charts can be used by the some parties to improve the management of shipping path. The location of the study is presented in Figure 1.
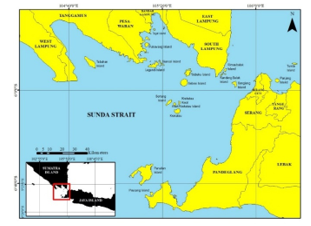 Figure 1 :Sunda Strait in the north is bounded by the connecting line from west to east that is from 5° 50′ south latitude to 105° 47′ east longitude and from 5° 53′ south latitude to 105° 02′ east longitude. While, in the south, the bounded line connects from west to east (from 6° 50 ‘south latitude to 105° 15′ east longitude and from 5° 56’ south latitude to 105° 33’ east longitude) [25].
2. Literature Study
- Research Method
The methodology used in this research is descriptive quantitative method. This method aims to describe the distribution of the wave height amplitude and tidal propagation horizontally accompanied by the distance and the extent of the water area influenced by the amplitude and phase of tide.
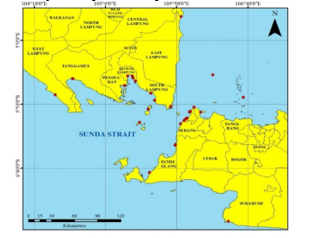 Figure 2 : Thirty two stations of sampling points to calculate the co-tidal chart in Sunda Strait
The location of the sampling point is presented in Figure 2. The equipment was installed is tidal gauges. This device are not submerged at the highest high water level (HHWL) and are still inundated during lowest low water level (LLWL). The tidal gauges were installed perpendicularly and placed away from human activities or the flow of boats and ships. The tidal gauge should not be installed on the watershed or breakwaters in order not to cause bias and others [26].
- Tidal Elevation Analysis using Admiralty Method
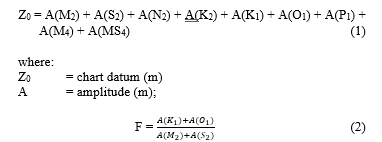
Tidal data were obtained using Admiralty Method by schematic and multiplier tables at data length of 15 or 29 piantans in one hour observation interval to obtain the value of tidal harmonic constituents (S0, M2, S2, N2, K1, O1, M4, MS4, P1, K2), where some of the harmonic constituents (M2, S2, K1, O1) will become the input parameters of the co-tidal chart. Equation 1 defines the numbers of Z0, meanwhile equation 2 is the equation of Formzahl which used to determine the types of tidal of a waters [27].
 where:
F = formzahl
= amplitude of tidal harmonic constituent of K1
= amplitude of tidal harmonic constituent of O1
= amplitude of tidal harmonic constituent of M2
= amplitude of tidal harmonic constituent of S2
- Construction of Co-Tidal Chart
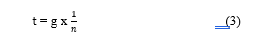
Co-tidal chart construction requires at least three different observation stations. The datum of time used for co-tidal chart is GMT [28], ie +07.00, meanwhile references datum of tidal is low water of neap tide. The result of tidal observation from each station is amplitude height (cm), phase (deg) of each tidal harmonic constituents and the formzahl number. In addition, the period of water height in every tidal harmonic constituents can be calculated by Equation 3.
 where :
t = time of water height (hour)
g = phase of tidal harmonic constituent (0)
n = angular velocity of tidal harmonic constituent (0/jam)
Co-tidal charts in offshore area can be determined based on the observation at the shore [24]. The observation results along the shore was interpolated to obtain the offshore area empirically. This research was using spline method. Spline method is a method that estimates value by using mathematical functions that minimize the total surface curvature [29], [30].
- Data Analysis
The tidal analysis in this research refer to the method by Pariwono [24], which are contained of the following 3 sections :
- The aim of analyzing co-phase charts is to obtain the tidal propagation information for each tidal harmonic constituents, i.e. diurnal tidal harmonic constituents (K1, O1) and semidiurnal tidal harmonic constituents (M2, S2). The data which were observed are the source and direction of tidal wave propagation which are shown based on the high of water time contours, where tidal propagation moves from low amplitude to higher amplitudes.
- The aim of analyzing co-range charts was to obtain the information about the distribution of wave height amplitude. The data consist of the highest and lowest of wave height amplitude that shown by line contour.
- Types of tidal chart and Z0 chart were analyzed to obtain the general information about the tidal characteristic based on formzahl number and height of Z0.
3. Result
- Tidal Observation
This research shows the tidal characteristic information at 2 stations of tidal observation , i.e. in Panjang Waters Lampung and Ciwandan Waters Banten. The result of tidal elevations (shown at Fig. 3 and Fig. 4) presented the height of HHWL, LLWL, HWL, LWL and MSL. The value of HHWL, HWL, MSL, LWL and LLWL in Panjang waters, respectively are 196 cm, 179 cm, 104 cm, 42 cm and 13 cm. Meanwhile, the HHWL, HWL, MSL, LWL and LLWL in Ciwandan waters are 163 cm, 150 cm, 120 cm, 89 cm and 77 cm, respectively.
Tidal elevation in the Panjang Waters Lampung and Ciwandan Waters Banten are shown in Figure 3 and 4. High water value which is obtained in Panjang Waters is 179 cm, while in Ciwandan Waters is 150 cm. While, low water values for Panjang and Ciwandan waters are 42 cm and 89 cm, respectively.
- Analysis of Tidal Harmonic Components
The results obtained are the amplitude (A) and phase (g) values of each tidal harmonic constituent, i.e. S0, M2, S2, N2, K1, O1, M4, MS4, K2 and P1 (Table 1 and Table 2). The formzahl value of Ciwandan waters, Banten is 0.436, whereas, the formzahl value of Panjang waters, Lampung is 0.482. The comparison of tidal elevation between Panjang waters, Lampung and Ciwandan waters, Banten (shown in Figure 5) is used to determine the direction of water mass movement. Figure 6 shows a plot stick value from both tidal observation stations to verify the direction of tidal wave propagation on co-tidal charts.
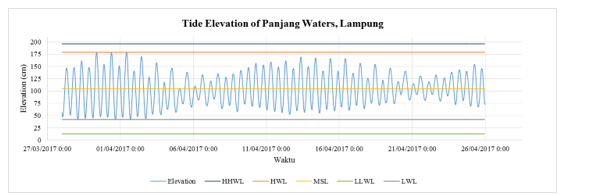 Figure 3: Tidal Elevation of Panjang Waters, Lampung
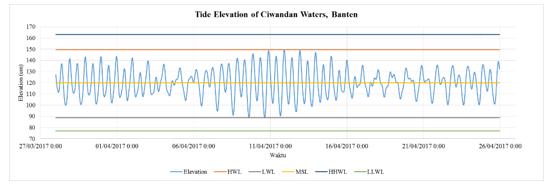 Figure 4 : Tidal Elevation of Ciwandan Waters, Banten
Table 1 :Tidal Harmonic Constituents at Panjang Waters, Lampung
| S0 | M2 | S2 | N2 | K1 | O1 | M4 | MS4 | K2 | P1 | |
| A (cm) | 104 | 36 | 14 | 8 | 16 | 8 | 0.2 | 0.1 | 4 | 5 |
| g (0) | 198 | 269 | 169 | 276 | 250 | 85 | 240 | 269 | 276 |
Table 2 : Tidal Harmonic Constituents at Ciwandan Waters, Banten
| S0 | M2 | S2 | N2 | K1 | O1 | M4 | MS4 | K2 | P1 | |
| A (cm) | 120 | 11 | 11 | 4 | 6 | 3 | 2 | 1 | 3 | 2 |
| g (0) | 214 | 333 | 216 | 192 | 76 | 217 | 56 | 333 | 192 |
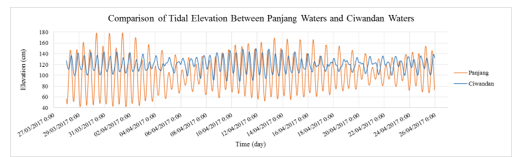 Figure 5 : Comparison of Tidal Elevation between Panjang Waters and Ciwandan Waters
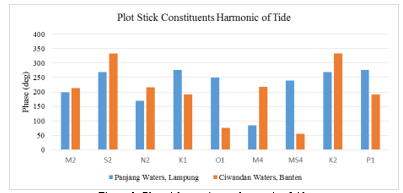 Figure 6 : Plot stick constituents harmonic of tide
Figure 5 shows the different tidal elevation of the two waters, where it can be seen that the fluctuations of sea water level length of Panjang Water are greater than the fluctuations of sea water surface of Ciwandan. Tidal steep in Panjang waters is reached up to 137 cm at neap tide, while tidal steep in Ciwandan Waters only reached 61 cm at neap tide. According to Pond and Pickard [31], the depth and width of the waters affect sea level fluctuations, therefore, the difference in tidal elevation values between Panjang and Ciwandan Waters is caused by its location, where the location of Panjang waters is in Lampung Bay and Ciwandan Waters is located in the northern part of the Sunda Strait which is directly facing to the Java Sea. Tidal types in Panjang and Ciwandan Waters are the same (mixed tide prevailing semidiurnal). Based on Figure 6, the semidiurnal harmonic constituents (including M2, S2, N2 and K2), the direction of its tidal wave propagation is from Panjang Waters to Ciwandan Waters, whereas, diurnal harmonic constituents (including O1, K1, P1), the direction of its tidal wave propagation is from Ciwandan Waters to Panjang Waters. M4 tidal constituent shows the direction of wave propagation from Panjang Waters to Ciwandan Waters, while the tidal constant MS4 shows the direction of wave propagation from Ciwandan Waters to Panjang Waters.
- Co-tidal Chart
Figure 7a show the co-range chart which are presented by the amplitude of wave height and the tidal propagation based on time of each tidal harmonic constituent. The contour lines define the amplitude of wave height or tidal propagation period.
Figure 7a shows co-range chart of harmonic constants M2. The distance of M2 amplitude contour has a 2 cm interval (around Bakauheni-Merak or north area of Sunda Strait) to Anyer-Kalianda waters, where the change of elevation of M2 amplitude height are from 12 cm to 30 cm. Contour density indicates the variability of the value of M2 amplitude height which is caused by tidal wave propagation influenced by depth in north area of Sunda Strait. The minimum value of M2 wave amplitude in Sunda Strait is 12 cm and the maximum height is 36 cm. The wave height of M2 amplitude in the southern area of the Sunda Strait is greater than the wave height of M2 amplitude in the north of the Sunda Strait. The M2 amplitude value in the Sunda Strait Waters is more dominant than the M2 amplitude value in the northwest part of the Java Sea, indicating that the amplitude of the M2 wave amplitude in the Sunda Strait is high. Based on the S2 co-range chart of the Sunda Strait waters which is shown in Figure 7 b, the S2 wave amplitude in the Sunda Strait Waters is quite high compared to the wave amplitudes in the western part of the Java Sea. This condition is based on contours whose value is enlarged toward the northern part of the Sunda Strait from the western part of the Java Sea, which is from 7 cm to 11 cm in Cilegon-Bakauheni area. Furthermore, the further inside of Sunda Strait area, the amplitude value of S2 become higher until it reaches the maximum height of
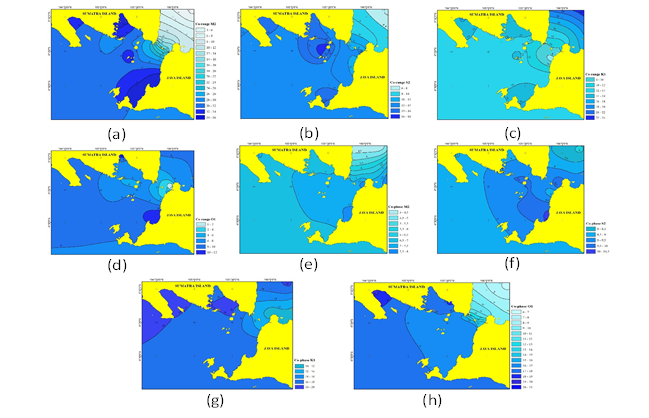 Figure 7 : (a)-(d) co-range chart (e)-(h) co-tidal chart
18 cm in Sebesi Island to Sertung Island. Several areas in the Sunda Strait have a varying degrees of amplitude of S2 based on contour density, at 14 cm contours that start from Labuhan Bangkai area, Krakatau Island to Kalianda and contour 15 cm on Legundi Island, west of Sertung island, south of Sebesi island and west Sebuku island, until the maximum S2 amplitude value on the eastern part of Sertung island and the northern part of Sebesi island. The minimum S2 wave amplitude height in the Sunda Strait waters is 10 cm and the maximum S2 wave amplitude height is 18 cm. Based on the change of wave amplitude height, the effect of the S2 wave amplitude in the Sunda Strait is higher than the effect of the S2 wave amplitude in the northwest of the Java Sea.
The co-range chart of K1 tidal harmonic constants shown in Figure 7 c that the minimum amplitude value of Sunda
Strait waters is 8 cm around Anyer Waters and maximum amplitudes, which is 18 cm in the area of Teluk Paraja and Kota Agung. According to Pariwono [24], the topography of the seabed and the shape of a waters affect the variability of the amplitude value, therefore the K1 tidal wave in the sea of the Sunda Strait tends to be the same, which is from 10 cm to 12 cm, while the amplitude value in some bay is from 14 cm to 18 cm, which is at Lampung Bay, Semangka Bay and Paraja Gulf. The northern part has a wave amplitude height which is from 8 cm to 14 cm that is influenced by the narrow gap of the two islands. Wave length amplitude are increasingly enlarged toward the western part of the Java Sea. This shows that the Sunda Strait is less influence by K1 tidal wave. Based on Figure 7 d, the distance of the O1 wave amplitude height contours in the Sunda Strait are far. In addition, the changes of wave amplitude height are not significant. The wave amplitude heights in the Ciwandan Area are from 1 cm to 2 cm and the wave amplitude height in the Merak area are from 4 cm to 6 cm. The amplitude with the height of 8 cm is found in Labuhan Waters which is connected to Krakatau Kecil Island, Sertung Island to Kiluan Waters. While in the bay area, such as the Lada Bay and Lampung Bay, the amplitude value is quite high, which is about 8 cm to 12 cm while in the south of the Sunda Strait, the amplitude values tend to be the same, which is from 8 cm to 10 cm. This condition shows the effect of O1 tide waves is small.
The tidal harmonic constant of M2 (Figure 7 e) propagates from the southeast waters of Sumatra. Then, the tidal wave propagation direction moves towards Bakauheni-Merak. The tidal wave propagation of M2 in the Sunda Strait is also influenced by the M2 tidal wave coming from the western waters of Sumatera, shown in the contour of 7 waters area of Kiluan (South Sumatera) to the West (West Java). The tidal wave propagation of M2 originating from the western waters of Sumatera and the Southeast Sumatra waters which coincides at 7.5 in Cangirin, Labuhan and Merak areas.
S2 tidal wave propagates through the waters of western Sumatra (Figure 7 f). S2 tidal wave which come from western part of Sumatra moves from 8 to Semangka Bay at 8.5 to 10 in Cilegon waters. The direction of the tidal wave propagation from the southeastern part of Sumatra and the north of the Sunda Strait that meets or coincides in the area of Sumur, Sebesi Island, Sebuku Island to Labuhan area at 9.5 hours, S2 wave continues to reach the Lada-Labuhan Bay at 10.5. According to Fatoni [23], the double tidal wave propagating in the western waters of Sumatra were the propagation of the Indian Ocean and the tidal wave in the southeastern part of Sumatra is the tidal wave propagation from the Indian Ocean which enters through the Malacca Strait to the waters of Batam to the Karimata Strait.
The tidal wave propagation of K1 comes from the Java Sea (Figure 7 g), where the propagation of the tidal wave will partially propagate to the Karimata Strait and partly propagate to the waters of the Sunda Strait. K1 tidal wave, in Sunda Strait waters area starts at 12 in Merak-Bakauheni then its propagation direction is to the western waters of Sumatra, Sebesi Island and Bay of Semangka, which was at 18. The tidal propagation around Lampung Bay is shown at
16 to Puhawang Island at 18. Meanwhile, O1 tidal waves from the Karimata Strait and Java Sea propagate to Merak waters as shown in Figure 7 h, where the O1 tidal wave travels at 7 and will continue to propagate up to Bakauheni-Merak waters at 10. The propagation tidal waves from Bakauheni-Merak waters continue to propagate to the bay of Semangka and Kalianda at the same time, at 18 hours. O1 tide wave will continue to propagate into the waters of West Sumatra that similarly to the K1 tidal wave. The direction of O1 tidal wave propagation comes from the Pacific Ocean that travels through the Makassar Strait to the Java Sea and travels from the Natuna Sea towards the Sunda Strait. According to Fatoni [23], the K1 tidal wave originates from the Java Sea is a propagation from Pasific Ocean passing to the Sulawesi Sea through the Makassar Strait.
- The Map of Z0 Distribution and Types of Tidal Chart
Z0 distribution and types of tidal chart are shown in Figure 8 a. The charts are shown by the consideration of formzahl and Z0 heights in The Sunda Strait. Figure 8 a is a chart of the distribution of Z0 in Sunda Strait, where the height of Z0 has a uniform amount based on the countor line. The northern part of the Sunda Strait of Z0 height has a lower tendency height, for example in Merak area Z0 height is 50 cm, while in Bakauheni area to Cilegon the contour value is 60 cm. The height of Z0 around Sunda Strait waters ranged from 50 cm to 100 cm. Tidal type in Sunda Strait waters is based on formzahl number (Figure 8 b), which showed the type of tidal in the Sunda Strait waters is affected by the amplitude height of O1, K1, M2 and S2. If the amplitude height of O1 and K1 are greater than the height of M2 and S2, then the tidal type in these waters tends to be diurnal or diurnal mixed type. Tidal types in the Sunda Strait waters are dominated by mixed tide prevailing semidiurnal, where the contours are displayed on the chart, ranging from 0.26 to 1. This indicates that the Sunda Strait waters are affected by the amplitude of M2 and S2 or semidiurnal tidal constituents.
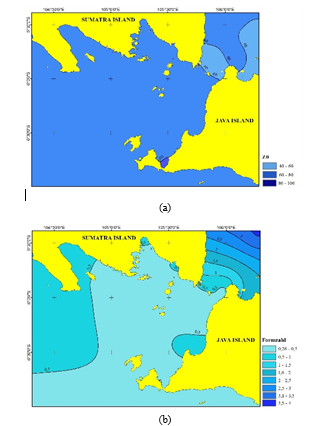 Figure 8: (a) Z0 chart (b) Type of tidal chart
4. Results
Co-range chart which is shown the amplitude wave in Sunda strait is affected by semidiurnal harmonic constituent (M2, S2), dominantly. The maximum height of wave amplitude in Sunda Strait is represented by M2 amplitude wave in the value of 36 cm height and the minimum height of amplitude wave is represented by O1 amplitude wave of 2 cm height. Co-phase chart shows the tidal propagation of K1 and O1 that spread from 10 to the end of 20, meanwhile the tidal propagation of semidiurnal harmonic constituent of M2 and S2 spread from 4 to 10. The tidal type in Sunda Strait is dominated by mixed tide prevalling semidiurnal and the height of Z0 is from 40 cm to 100 cm height. The tidal propagation of semidiurnal harmonic constituent (M2, S2) in Sunda Strait were sourced from Indian Ocean. The tidal wave flows through western of Sumatra Waters and Malacca Strait (flows through Batam Waters to Karimata Strait, continously). The tidal propagation of diurnal harmonic constituent (O1, K1) in Sunda Strait are sourced from Pacific Ocean. The tidal wave flows through Java Sea and South China Sea (flows through Karimata Strait).
Conflict of Interest
The authors declare that there is no conflict of interest regarding the publication of this paper.
Acknowledgment
The authors would like to thank to PUSHIDROSAL (Hydrography and Oceanography Center, Indonesian Navy), and Departement of Oceanography and Coastal Rehabilitation and Disaster Mitigation Studies (CoREM) Diponegoro University for support our research.
- A.S. Rahmawitri, Herwi, Atmadipoera, S.S. Sukoraharjo, “Pola sirkulasi dan variabilitas arus di Perairan Selat Sunda,” Jurnal Kelautan Nasional, 11 (3), 141-157, 2017. https://doi.org/10.15578/jkn.v11i3.6115
- Y. Xu, L. Wang, X. Yin, X. Ye, D. Li, S. Liu, X. Shi, R.A. Troa, R. Zuraida, and E. Triarso, “The influence of the Sunda Strait opening on paleoenviromental changes in the Eastern Indian Ocean,” Journal of Asian Earth Science, 146, 402-411, 2017. https://doi.org/10.1016/j.jseaes.2017.06.014
- J.E. Simanjorang, W.S. Pranowo, L. P. Sari, N. P. Purba and M. L. Syamsuddin, “Building up the database of the Level-2 Java Sea Ecoregion based on physical oceanographic parameters,” IOP Conf. Series: Earth and Environmental Science, 176 (2018) 012009, 2018. https://doi.org/10.1088/1755-1315/176/1/012009
- P.D. Anggara, T.M. Alam, D. Adrianto, and W.S. Pranowo, “The wave characteristics in Natuna Sea and its adjacent for naval operation base purposes,” IOP Conference Series: Earth and Environmental Science 176 (1), 1 – 12, 2018. https://doi.org/10.1088/1755-1315/176/1/012009
- X. Qu and Q. Meng, “Development and applications of a simulation model for vessels in the Singapore Strait,” Expert System with Application Journal, 39, 8430-8438, 2012. https://doi.org/10.1016/j.eswa.2012.01.176
- S. Febrica, Maritime Security and Indonesia: Cooperation, Interests and Strategies. Maritime Security and Indonesia: Cooperation, Interests and Strategies. 2017. https://doi.org/10.4324/9781315541815
- F. Azmi, C.L. Hewitt, and M.L. Campbell, “A hub and spoke network model to analyse the secondary dispersal of introduced marine species in Indonesia,” ICES Journal of Marine Science, 72 (3), 1069-1077, 2015. https://doi.org/10.1093/icesjms/fsu150
- M. Wahab, D.P. Kurniadi, T.T. Estu, D. Mahmudin, Y.Y. Maulana, and Sulistyaningsih, “Development of coastal radar network at Sunda Strait,” Telkomnika (Telecommunication Computing Electronics and Control), 14 (2), 507-514, 2016. https://doi.org/10.12928/telkomnika.v14i2.2497
- F.J. Sluiman, “Transit vessel scheduling,” Naval Research Logistics, 64 (3), 225-248, 2017.https://doi.org/10.1002/nav.21742
- H. Lelgemann, M.A. Gutscher, J. Bialas, E. Flueh, W. Weinrebe, and C. Reichert, “Transtensional basins in the western Sunda Strait,” Geophys. Res. Lett. 27, 3545 – 3548, 2000.https://doi.org/10.1029/2000GL011635
- C. Susilohadi, Gaedicke and Y. Djajadihardja, “Structures and sedimentary deposition in the Sunda Strait, Indonesia,” Tectonophysics Journal, 467, 56-71, 2009. https://doi.org/10.1016/j.tecto.2008.12.015
- Dishidros, Kepanduan Bahari Indonesia Wilayah I Edisi Tahun 2014. Jakarta : Hydrography and Oceanography Center, Indonesian Navy, 2008.
- D.P. Sobaruddin, A. Armawi, and E. Martono, “Model traffic separation scheme (TSS) di alur laut kepulauan Indonesia (ALKI) I di Selat Sunda dalam mewujudkan ketahanan wilayah,” Jurnal Ketahanan Nasional, 23 (1), 104-122, 2017. https://doi.org/10.22146/jkn.22070
- A.K. Jolly, “Co-tidal reductions in digital hydrographic survey,” International Hydrographic Review, 4 (1), 82-86, 2003.
- W. Zhang, Y. Cao, Y. Zhu, J. Zheng, X. Ji, Y. Xu, Y. Wu, and A.J.F. Hoitink, “Unravelling the causes of tidal asymmetry in deltas,” Journal of Hydrology, 564, 588-604, 2018.https://doi.org/10.1016/j.jhydrol.2018.07.023
- van Maanen, B., G. Coco, and K. R. Bryan, “Modelling the effects of tidal range and initial bathymetry on the morphological evolution of tidal embayments,” Geomorphology, 191, 23-34, 2013.https://doi.org/10.1016/j.geomorph.2013.02.023
- F. Ye, Y. J. Zhang, H. V. Wang, M. A.M. Friedrichs, I. D. Irby, E. Alteljevich, A. Valle-Levinson, Z. Wang, H. Huang, J. Shen, and J. Du, “A 3D unstructured-grid model for Chesapeake Bay: Importance of bathymetry,” Ocean Modelling, 127, 16-39, 2018. https://doi.org/10.1016/j.ocemod.2018.05.002
- J.U. Kitheka, B.O. Ohowa, B.M. Mwashote, W.S. Shimbira, J. M. Mwaluma and J.M. Kazungu, “Water circulation dynamics, water column nutrients and plankton productivity in a well-flushed tropical bay in Kenya,” Journal of Sea Research, 35 (4), 257-268, 1996.
https://doi.org/10.1016/S1385-1101(96)90753-4 - S. Canhanga and J. M. Dias, “Tidal characteristics of Maputo Bay, Mozambique,” Journal of Marine System, 58, 83-97, 2005. https://doi.org/10.1016/j.jmarsys.2005.08.001
- N. Carpman, and K. Thomas, “Tidal resource characterization in the Folda Fjord, Norway,” International Journal of Marine Energy, 13, 27 – 44, 2016. https://doi.org/10.1016/j.ijome.2016.01.001
- L. Rose, and P. K. Bhaskaran, “Tidal propagation and its non-linear characteristics in the Head Bay of Bengal,” Estuarine, Coastal and Shelf Science, 188, 181-198, 2017. https://doi.org/10.1016/j.ecss.2017.02.024
- W.J. Pringle, D. Wirasaet, A. Suhardjo, J. Meixner, J. J. Westerink, A. B. Kennedy, and S. Nong, “Finite-Element barotropic model for the Indian and Western Pacific Oceans: Tidal model-data comparisons and sensitivities,” Ocean Modelling, 129, 13-38, 2018.
https://doi.org/10.1016/j.ocemod.2018.07.003 - K.I. Fatoni, Pemetaan Pasang Surut dan Pola Perambatannya di Perairan Indonesia (Tidal chart and Tidal Propagation Pattern in Indonesian Seas). Thesis. Bogor : Bogor Agricultural University, 2011.
- J.I. Pariwono, Kondisi Pasang Surut di Indonesia Dalam Pasang Surut. Editor : O.S.R. Ongkosongo and Suyarso. Jakarta : Indonesian Institute of Science, 1989.
- IHO, Limits of Oceanos and Seas 4th Edition. Monaco. IHO Publication S-23. 2002.
- I. Mahmudin, Suyatna, Adnan, “Prediksi pasang surut menggunakan proses neural nets (backpropagation) di Pantai Indah Muara Badak Kabupaten Kutai Kartanegara Kalimantan Timur,” Jurnal Ilmu Perikanan Tropis, 22 (1), 010-019, 2016.
- Fadilah, Suripin dan D. P. Sasongko, “Menentukan Tipe Pasang Surut dan Muka Air Rencana Perairan Laut Kabupaten Bengkulu Tengah Menggunakan Metode Admiralty,” Maspari Journal, 6 (1), 1-12, 2013.
- X. Wang, Y. Chao, C. Dong, J. Farrara, L. Zhijin L, J. C. Mc Williams, J. D. Paduan, and L. K. Rosenfield, “Modeling tides in Monterey Bay, California,” Deep-Sea Research II, 56, 219-231, 2009. https://doi.org/10.1016/j.dsr2.2008.08.012
- J.M. Pasaribu and S.H. Nanik, “Comparison of DEM SRTM interpolation techniques using inverse distance weighted (IDW), natural neighbor and spline method,” Jurnal Penginderaan Jauh, 9 (2), 126-139, 2012.
- K. Segeth, “Some splines produced by smooth interpolation,” Applied Mathematics and Computation, 319, 387-394, 2017. https://doi.org/10.1016/j.amc.2017.04.022
- S. Pond and G.L. Pickard, Introductory Dynamical Oceanography. 2nd Eds. Pergamon press, 329 pp, 1983. https://doi.org/10.1016/B978-0-08-057054-9.50007-9