
Potential of Solar Energy in Residential Rooftop Surface Area in Semarang City, Indonesia
Volume 5, Issue 4, Page No 397-404, 2020
Author’s Name: Djoko Adi Widodo1,a), Purwanto Purwanto1,2, Hermawan Hermawan1,3
View Affiliations
1Doctorate Program of Environmental Science, School of Postgraduate Studies, Universitas Diponegoro, Semarang, 50241, Indonesia
2Department of Chemical Engineering, Faculty of Engineering, Universitas Diponegoro, Semarang, 50275, Indonesia
3Department of Electrical Engineering, Faculty of Engineering, Universitas Diponegoro, Semarang, 50275, Indonesia
a)Author to whom correspondence should be addressed. E-mail: djoko.adiw@gmail.com
Adv. Sci. Technol. Eng. Syst. J. 5(4), 397-404 (2020); ![]() DOI: 10.25046/aj050446
DOI: 10.25046/aj050446
Keywords: Geographic Information System, Residential Rooftop, Solar Energy Potential

Export Citations
This study examines the potential of solar energy in the urban environment with a case study in Semarang, Indonesia by analyzing the intensity of solar radiation and the residential rooftop area. The study aims to obtain a quantitative description of the potential for electricity production from rooftop solar photovoltaic systems in residential areas and estimate the mitigation potential of CO2 . The estimation method has adopted the hierarchies assessment: estimation of physical, geographic, and technical potential. This study shows the residential roof area spread over 16 districts in the city of Semarang is 412,987.50 m2 to 2,083,387 m2 has the average potential to of solar energy every year of 44,051 – 222,222 MWh/year. Total the low-carbon electricity is equivalent to 40.87% of the total electricity consumption in 2018 at Semarang City and reduce 1,394 tonCO2 in a year. Potential electricity production is proposed to set rules for the future empowerment of solar energy and analyze the potential at different time levels, such as monthly, weekly and daily
Received: 02 June 2020, Accepted: 16 July 2020, Published Online: 28 July 2020
1. Introduction
Increasing concerns on the use of carbon-based or fossil fuel-based energy are apparent around the world. Approximately 70% of the global electricity supply is currently generated from fossil fuels [1]. It is estimated that if global energy demand grows from 2010 to 2030 at 1.5% per year, it could lead to an increase 22% in oil consumption, 42% in natural gas and 53% in coal during a 20-year time frame [2]. The use of fossil fuels for electricity generation releases greenhouse gases into the atmosphere, which causes climate change. The problems are considered not good from an environmental perspective, especially the utilization of electrical energy from unsustainable resources such as increases carbon dioxide concentration in atmospheric from greenhouse gas emission, environmental safety from energy production techniques, unstable prices of energy, and depletion of fuel reserves from carbon sources [3, 4]. Due to extensive exploitation, fossil fuels have gradually become depleted and the problem of global warming increases. Therefore, all the countries should develop alternative energy sources in order to reduce the potential risk of depletion of available fossil fuel energy supplies and to overcome degradation of environmental [5]. Nowadays, many nations are facing increasing challenges in order to diversify energy sources. Most countries that tend to the development of low carbon sustainability pathways have made climate change mitigation a major concern and increased the research about analyzing various mitigation policies of climate change in the national context [6]. Renewable energy sources are very imperative in their potential to play a dual role in mitigating of global warming and assure long-term energy security. Renewable energy is a vital element for every sustainable solution [7, 8].
A power generation technology of renewable energy is a solution to the concerns of the use of fossil fuels [9]. Solar energy is a potential renewable energy resource for the world to recovery the environmental problems with clean energy [10]. The solar energy is widely regarded as a source of major renewable energy expected to contribute to the security of energy supply and environmental protection. Solar energy is readily available, the most abundant,and clean of all renewable energy resources to date, universal, noiseless and non-polluting [11, 12]. Solar energy resources have a significant role in future energy resources [13, 14]. Solar power technology is one of the main solutions to fulfill the increasing global energy demand [14]. There are two technologies used to harness solar energy: solar thermal and solar photovoltaic [15,16].
Photovoltaic technology has become a promising renewable energy supply from clean energy sources in all of scale production [17]. Its use can produce resources with zero emissions, zero noise, and reliability [17]. In the last decades, photovoltaic technology has been growing more rapidly than other renewable energy sources. Solar photovoltaic systems in rooftop are increasingly becoming fundamental system in the energy sector globally. It is reported that they contribute around 50% of the total installed solar energy capacity [21, 22]. Photovoltaic is seen as the main climate change mitigation technology. Achieving this potential requires large-scale photovoltaic installations, either on the roof of a house or as an array mounted on the ground [20].
Local renewable energy generation through photovoltaic systems mounted on a rooftop buildings in urban areas with great potential for mitigating emissions of greenhouse gas [21]. The potential of photovoltaic electricity generation on the rooftop depends from several global, local, temporal, and spatial variables [22]. The geographical potential of a rooftop solar photovoltaic system of an area can be determined by estimating the availability of the roof area in a certain percentage [23]. The intensity of the solar radiation in Indonesia is around 4.8 kWh/m2 per day in all its regions. It means that every 1 m2 with the solar module can produce 4.8 kWh of electricity every day [24]. The solar photovoltaic potential of a rooftop can be determined hierarchically through of different stages: (i) potential of physical: the total amount of solar energy that reaches the surface target, it can be called total solar radiation on the roof; (ii) potential of geographical: spatial availability of roofs in buildings, where solar energy can be obtained, it can be called to as the roof area available for solar photovoltaic installations; (iii) technical potential: the total amount of electricity that takes into technical characteristics of solar photovoltaic systems: module efficiency, it can be called electricity generation [25,26].
Based on the literature review, the primary energy combination for Indonesia’s electricity generation is still largely dominated by fossil energy sources such as coal and petroleum, especially in big cities [27]. Clean energy from the energy source of solar radiation should be utilized. Therefore, the investigation of the potential of solar energy in urban areas is also required to determine the contribution of solar energy as a clean energy supply for domestic use and the reduction of CO2. Government policies regarding the use of PV systems in roof buildings should be set to support the National Energy Policy in 2025, which increases the role of new and renewable energy, by 36% in 2050. This study aims to obtain an estimation of the solar energy potential and mitigation of CO2 potential based on photovoltaic roof systems in Semarang City as one of big city in Indonesia. The rooftop solar photovoltaic system in Semarang City is currently not widely installed, even though geography and meteorology have great solar energy potential. Until 2019, a rooftop solar photovoltaic system has only installed 95 kWp capacity in 3 government buildings and is connected to the national grid. Specifically, studies have not yet been carried out on the potential of local area solar energy for electricity production in the roof space of buildings in a comprehensive manner. In this study, the evaluation of solar energy potential focuses on the roofs of residential areas considering that buildings are a potential area for solar panel installation in urban areas. This paper is a preliminary study, undertaking the work of estimating the potential roofs of buildings and residential houses. From this study will have the knowledge and description of the potential of roofs of buildings and houses for the production of electrical energy from the sun.
2. Methodology
2.1. The Study Area
The case study in this paper is Semarang City, Indonesia, located between the 6°50’ – 7°10’ South and 109°35’ – 110°50’ East (Figure 1). The area of Semarang City is 373.70 km2, it has a tropical climate condition and the type of climate according to the Koppen classification is Tropical Monsoonal. The annual average temperature is 26.7°C. The population is made by 1,815,729 people and the population density is 4,253 per km2 with a population growth of 1.6% per year [28]. Administratively, the City of Semarang is divided into 16 sub-districts [29]. Data from the Central Statistics Agency of Semarang City (2018) shows that electricity consumption in 2017 is 4,704,416 MWh/year or around 23% of the total electricity consumption in Central Java Province with an area of 32,801 km2. On a national scale, the number of customers has increased by 5.6% from the previous year, while electricity consumption has increased by 1.6% [30].
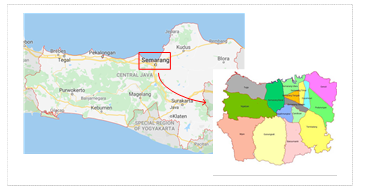 Figure 1: The Map of Semarang City, Indonesia
Topographically, the city of Semarang consists of hilly areas [31] lowland and coastal areas [32,33]. Therefore, it has an area referred to as a downtown area or lowlands and a high hills area [34]. The downtown area of the city is the center of government, trade, industry, and education activities. In contrast, the hilly areas or upper areas of the city are mostly used for residential areas [35]. In general, land use in the Semarang City area is used for roads, residential areas or housing, buildings, courtyards, industrial estates, the brackish water pond and field [36]. Geographically, the coastal area of the city of Semarang is strongly influenced by the sea wind from the north and the valley wind of Mount Ungaran from the south.
2.2. Evaluation of Solar Radiation
Solar radiation is a solar energy that reaches the earth’s surface. The radiation consists from three components: direct beam, diffuse, and ground-reflected radiation [37]. Direct radiation is the direct emission of solar energy and intercepted by a surface without interaction with many particle in the atmosphere [38]. Diffuse radiation is scattered and intercepted in the atmosphere by aerosols and gases [39]. The radiation reflected is the one reflected from the field and surrounding surfaces [40]. The three radiations, which are direct, diffuse and reflected make up for the global radiation or total radiation reaching the earth’s surface. The amount of solar radiation that reaches the earth’s surface depends on its location, its atmospheric influence, and its topography. Solar radiation is affected by the rotation of the earth’s geometry and revolutions of the sun [41]. At ground level, topographic influences such as slope, elevation, and orientation affect the radiation to reach surface [42].
The Meteorology, Climatology, and Geophysics Agency (BMKG) in Semarang Climatology Station conducts periodic observations of solar radiation intensity. In order to estimate the physical potential, this study uses solar radiation measured by BMKG Climatology Station in Semarang City, Indonesia. The potential of solar radiation is estimated for electricity generation by photovoltaic on the roofs of residential areas in 16 sub-districts of Semarang City by using the data from 2014 to 2018.
2.3. Evaluation of Building Roof Surface
Currently, along with the development of the population of the city of Semarang also develops residential buildings in various regions and correlates to increase the amount of electricity consumed. Some studios show that the roof of residential buildings has the potential to generate electricity from solar energy. Potential use of roofs to generate electricity using photovoltaic media conversion panels. Electric production from the roof of the building can be intended to supply electrical energy needs so it needs attention.
The availability of the building roof area for the installation of a photovoltaic system can be determined by evaluating the geographic potential of the Semarang city. In the study, the area of the roof that has the potential to capture the energy the solar radiation is estimated through the remote sensing and Geographic Information System (GIS).
The GIS software used in this study is ArcGIS 10.5. The remote sensing data used in the form of aerial photos from the high-resolution satellite imagery with a resolution of 5m x 5m. The high-resolution satellite imagery of Semarang taken in the year 2017 was obtained from the results of the partnership with geospatial information agency. The estimation of the roof area of the settlements was conducted by the interpretation of the visual object of building manually using the Geospatial Information System (Figure 2). By using the geographic information system, the area of the roof in the whole city of Semarang spread in 16 sub-districts can be determined.
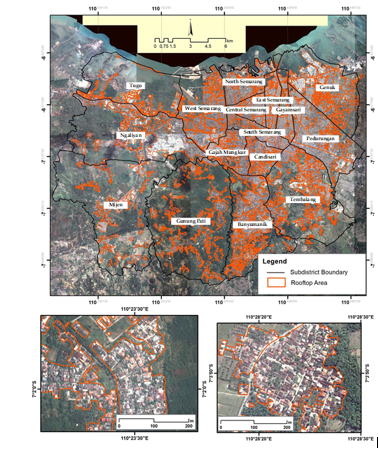 Figure 2: Visualization of Remote Sensing Approaches and Geospatial Information Systems
In this study for the purposes of calculating the potential of a building roof carried out several stages as follows. The roof area for all high-rise buildings and houses is identified as a flat roof through satellite imagery analysis. Roof identification is done by each district so that the estimated roof area is more representative of the character of the building in each district. Roof characteristics for buildings with flat and sloped roofs are given with the roof coefficient in equation (1) to determine the total roof in each district:
![]() where AR is a total rooftop area available per district in m2, n is the number of polygons per district, Ai = area of each roof polygon in m2 and RC is the available roof coefficient. The coefficient value considers utilities placed on the roof such as water tanks, air conditioners system, communication towers, etc. Besides, it also considers the general construction conditions and strength of building roofs. As a general rule of thumb, type of crystalline photovoltaic module weighted 15-20 kilograms per square meter (kgs/m2) of dead load on the roof [43]. RC coefficient is determined around 12.5% – 15%. Roof coefficient (RC) considers the regulation of roofing used for PV systems has not been regulated by the Ministry of Energy and Mineral Resources of the Republic of Indonesia.
where AR is a total rooftop area available per district in m2, n is the number of polygons per district, Ai = area of each roof polygon in m2 and RC is the available roof coefficient. The coefficient value considers utilities placed on the roof such as water tanks, air conditioners system, communication towers, etc. Besides, it also considers the general construction conditions and strength of building roofs. As a general rule of thumb, type of crystalline photovoltaic module weighted 15-20 kilograms per square meter (kgs/m2) of dead load on the roof [43]. RC coefficient is determined around 12.5% – 15%. Roof coefficient (RC) considers the regulation of roofing used for PV systems has not been regulated by the Ministry of Energy and Mineral Resources of the Republic of Indonesia.
Residential area in Semarang City consist of house and high-rise buildings. The roof area according to the percentage of concrete roofs 3.95%, roof tiles 72.66%, zinc 21.12% and asbestos 2.18% [29]. Concrete-roofed buildings around 111 buildings with a minimum height of 7 floors. Residential house building refers to the number of families around 424,628 houses with roof tiles, zinc and asbestos.
2.4. Evaluation of Technical Potential
Solar energy received from sunray hits the earth and is commonly called as solar radiation. Solar radiation can be utilized and converted as electricity energy with photovoltaic technology. Photovoltaic cells produce the electricity energy with absorbing photons and release electrons which can be captured in the form of electric current [44]. The cells can be grouped into modules and arrays to produce a greater amount of power or used individually to turn on small electronics. The potential for photovoltaic electricity generation on residential roofs depends on several conditions such as temporal, global, local, or spatial variables [22]. The factors that influence electricity generation are the total of solar radiation penetrating the earth’s surface. The available solar radiation and the roof area are components in estimating the rooftop solar photovoltaic system potential. The technical potential of a rooftop solar photovoltaic system in Semarang City was be estimated by calculating potential capacity of the solar PV rooftop system, CR in kilowatt-peak (kWp) using the following equation (2) [43]:
![]() With AR is the amount roof area available for installation the solar modules in m2, CM is the individual module rated with capacity in Wp (rated at 200 peak Watts), AM is the area of one module in m2 (sized 1,487 meters by 0,992 meter), RCR is the roof cover ratio, which is the part of roof area that the modules will cover and value of RCR is 0.85. Energy yield (E) in kilowatt-hour (kWh) calculated using this equation (3):
With AR is the amount roof area available for installation the solar modules in m2, CM is the individual module rated with capacity in Wp (rated at 200 peak Watts), AM is the area of one module in m2 (sized 1,487 meters by 0,992 meter), RCR is the roof cover ratio, which is the part of roof area that the modules will cover and value of RCR is 0.85. Energy yield (E) in kilowatt-hour (kWh) calculated using this equation (3):
![]() GSR is the average global solar radiation over 5 years period in kWh/m2/month. D is the derate factor value, that is converting direct current (DC) to alternating current (AC). The derate factor value ranges between 0.6 and 0.8 [43]. And typical derate factor of 0.75 used in this paper.
GSR is the average global solar radiation over 5 years period in kWh/m2/month. D is the derate factor value, that is converting direct current (DC) to alternating current (AC). The derate factor value ranges between 0.6 and 0.8 [43]. And typical derate factor of 0.75 used in this paper.
3. Result and Discussion
3.1. Physical Potential
The estimation energy potential requires of solar photovoltaic an evaluation of physical potential (using solar radiation), geographic potential (roof surface availability), and technical potential (system efficiency of photovoltaic). Table 1 shows variations of average monthly global solar radiation in the Semarang City area in 12 months each year. In this study, the intensity of solar radiation was measured and recorded by BMKG, Semarang Climatology Station for 5 years. The intensity of daily global solar radiation is measured for several hours and tabulated in daily average with units of Cal/m2/day. For analysis in this study, the unit data of global solar radiation was converted to kWh/m2/month.
Solar radiation that reaches the surface of the earth per unit area and time is known as insolation (derived from insolation = incoming solar radiation), or sometimes referred to as global radiation. Insulation plays an important role in maintaining the continuity of life on this earth and is very dependent on place and time. Places represent the differences in latitude and the atmosphere, especially clouds. Insolation is usually expressed in units of Watt/m2 -sec which has the meaning of intensity or strength. In another form, insolation is also measured in units of hours/day, for example, the length of the sun shining on the earth in one day. One day is also referred to as the length of the day, the length of the sun on the horizon. The change in day length is not too significant in tropical regions such as in Semarang City, Indonesia, which is close to the equator. The farther away the equator is, the greater the fluctuations in the irradiation. Based on the definition issued by the World Meteorological Organization, solar radiation is defined as the insolation power that exceeds 120 W/m2 [45].
3.2. Geographical Potential
The process of land use classification is a method of roof cover detection. This method detects the roof of a building surface. The utilization of satellite image data is very useful in this case. The density of the settlement area in Semarang is very beneficial in the estimation of the area by using GIS. It enables the large – scale estimation with high accuracy. Figure 5 is the result of the analysis of the distribution rooftops area in the city of Semarang. Most researchers use GIS to estimate the cross-sectional area with a
Table 1: Global Solar Radiation in Semarang City, Indonesia
| Month | 2014 | 2015 | 2016 | 2017 | 2018 |
| kWh/m2 per month | |||||
| Jan | 92.37 | 61.94 | 109.47 | 83.91 | 83.91 |
| Feb | 86.41 | 91.97 | 113.53 | 74.79 | 93.75 |
| Mar | 110.37 | 107.67 | 121.36 | 110.70 | 103.39 |
| Apr | 87.37 | 100.64 | 93.05 | 90.64 | 81.58 |
| May | 90.28 | 102.63 | 119.92 | 101.91 | 86.86 |
| Jun | 80.40 | 87.82 | 109.43 | 75.97 | 79.11 |
| Jul | 93.45 | 93.27 | 121.72 | 96.69 | 78.29 |
| Aug | 120.85 | 101.77 | 134.68 | 108.03 | 116.32 |
| Sep | 120.61 | 111.17 | 139.75 | 108.03 | 119.88 |
| Oct | 129.96 | 143.68 | 144.40 | 97.59 | 106.66 |
| Nov | 109.53 | 131.03 | 142.88 | 85.03 | 117.09 |
| Dec | 88.51 | 94.35 | 83.19 | 88.59 | 88.69 |
Table 2: Analysis setlements rooftop area per district in Semarang City, Indonesia
| District |
Total Area / Ai (m2 ) |
Roof available / AR (m2 ) |
Zone |
| Gunung Pati | 8,719,100 | 1,264,269.5 | High hills area |
| Mijen | 6,580,800 | 954,216.0 | High hills area |
| Tembalang | 11,377,900 | 1,649,795.5 | High hills area |
| Banyumanik | 13,695,300 | 1,985,818.5 | High hills area |
| East Semarang | 3,958,200 | 494,775.0 | Lowlands area |
| Candisari | 5,140,700 | 642,587.5 | Lowlands area |
| Genuk | 13599.200 | 1,699,900.0 | Lowlands area |
| Tugu | 3,303,900 | 412,987.5 | Lowlands area |
| Ngaliyan | 16,667,100 | 2,083,387.5 | Lowlands area |
| Central Semarang | 4,422,500 | 552,812.5 | Lowlands area |
| North Semarang | 5,648,600 | 706,075.0 | Lowlands area |
| West Semarang | 11,071,300 | 1,383,912.5 | Lowlands area |
| Gayamsari | 3,694,700 | 461,837.5 | Lowlands area |
| Pedurungan | 16,660,300 | 2,082,537.5 | Lowlands area |
| South Semarang | 6,204,600 | 775,575.0 | Lowlands area |
| Gajah Mungkur | 7,017,500 | 877,187.5 | Lowlands area |
| Total | 137,761,700 | 18,027,675 |
Table 3: Technical potential of rooftop solar photovoltaic system in Semarang City, Indonesia
| Distric |
CR (kWp) |
Energy Potential (MWh/month) | |||||||||||
| Jan | Feb | Mar | Apr | May | Jun | Jul | Aug | Sep | Oct | Nov | Dec | ||
| Gunung Pati | 9,465 | 10,098 | 12,139 | 9,941 | 11,001 | 9,490 | 10,602 | 12,756 | 13,147 | 13,648 | 12,842 | 9,723 | 9,465 |
| Mijen | 7,144 | 7,622 | 9,162 | 7,503 | 8,303 | 7,163 | 8,002 | 9,628 | 9,922 | 10,301 | 9,693 | 7,338 | 7,144 |
| Tembalang | 12,352 | 13,177 | 15,840 | 12,973 | 14,355 | 12,384 | 13,835 | 16,646 | 17,155 | 17,810 | 16,758 | 12,688 | 12,352 |
| Banyumanik | 14,867 | 15,861 | 19,066 | 15,615 | 17,279 | 14,906 | 16,652 | 20,037 | 20,650 | 21,437 | 20,172 | 15,272 | 14,867 |
| East Semarang | 3,704 | 3,952 | 4,750 | 3,890 | 4,305 | 3,714 | 4,149 | 4,992 | 5,145 | 5,341 | 5,026 | 3,805 | 3,704 |
| Candisari | 4,811 | 5,133 | 6,170 | 5,053 | 5,591 | 4,824 | 5,389 | 6,484 | 6,682 | 6,937 | 6,527 | 4,942 | 4,811 |
| Genuk | 12,727 | 13,578 | 16,321 | 13,366 | 14,791 | 12,760 | 14,255 | 17,152 | 17,676 | 18,351 | 17,267 | 13,073 | 12,727 |
| Tugu | 3,092 | 3,299 | 3,965 | 3,247 | 3,593 | 3,100 | 3,463 | 4,167 | 4,294 | 4,458 | 4,195 | 3,176 | 3,092 |
| Ngaliyan | 15,598 | 16,641 | 20,003 | 16,382 | 18,128 | 15,639 | 17,471 | 21,021 | 21,664 | 22,490 | 21,163 | 16,022 | 15,598 |
| Central Semarang | 4,139 | 4,415 | 5,308 | 4,347 | 4,810 | 4,150 | 4,636 | 5,578 | 5,748 | 5,968 | 5,615 | 4,251 | 4,139 |
| North Semarang | 5,286 | 5,640 | 6,779 | 5,552 | 6,144 | 5,300 | 5,921 | 7,124 | 7,342 | 7,622 | 7,172 | 5,430 | 5,286 |
| West Semarang | 10,361 | 11,054 | 13,287 | 10,882 | 12,042 | 10,388 | 11,605 | 13,963 | 14,391 | 14,939 | 14,058 | 10,643 | 10,361 |
| Gayamsari | 3,458 | 3,689 | 4,434 | 3,631 | 4,019 | 3,467 | 3,873 | 4,660 | 4,802 | 4,986 | 4,691 | 3,552 | 3,458 |
| Pedurungan | 15,592 | 16,634 | 19,995 | 16,375 | 18,121 | 15,632 | 17,464 | 21,012 | 21,655 | 22,481 | 21,154 | 16,016 | 15,592 |
| South Semarang | 5,807 | 6,195 | 7,447 | 6,098 | 6,748 | 5,822 | 6,504 | 7,825 | 8,065 | 8,372 | 7,878 | 5,965 | 5,807 |
| Gajah Mungkur | 6,567 | 7,006 | 8,422 | 6,897 | 7,633 | 6,585 | 7,356 | 8,851 | 9,121 | 9,469 | 8,910 | 6,746 | 6,567 |
| Jumlah | 2,084,833 | 134,969 | 143,992 | 173,090 | 141,754 | 156,862 | 135,324 | 151,175 | 181,896 | 187,461 | 194,610 | 183,123 | 138,641 |
combination of Digital Elevation Model (DEM) data. In the development of engineering, the surface area of a extensive application of cities using other techniques such as LIDAR and aerial photography is highly unlikely, because of the high cost. Data are in the form of a vector. This study found the results of the calculation of the available roof area calculated using Equation 1 are shown in Table 2. The coefficient of the roof (RC) for the high hills area is 0,145 and the lowlands area is 0,125. The coefficient difference considers the general utility of a building roof in Semarang City.
The most potential areas of rooftops in settlements Semarang (more than 12%) are in the region of Ngaliyan and Pedurungan sub-districtsts. Other regions that have a big proportion of the rooftop area consist of Tembalang, Banyumanik, Genuk dan West Semarang. Those sub-districts are dense regions that have the potential of the roof distribution more than 8% of the area of the roof of the whole. Because those regions are narrow and most areas are developed with high rooftop potential. However, large areas, such as Tembalang and Banyumanik, although located in hilly areas have the potential roof area to reach 8-9% of the total area. The developed area is influenced by the level of development of the region itself. In contrast to other regions, Gunung Pati and Mijen with their wider area are less developed because these regions are the rein green belt of the city.
3.3. Technical Potential
Potential techniques of the photovoltaic system in rooftop can be referred to as the energy electrical generation analyzed for settlements that are distributed on the 16 sub-districts in Semarang city, Indonesia. According to the variation of GSR per month in Semarang City and using a typical for derate factor, energy potential is found and shown in Table 3.
The technical potential is indicated by the value of potential energy proportional to the area of an available rooftop. The more area of rooftop used for photovoltaic exposure leads to more intensity of solar radiation the roof of the photovoltaic. It leads to more potential energy. Table 3 shows the variation of the potential energy per month which is produced from the roof of settlements in each sub-district. Figure 6 presents Tugu sub-district, which has the least roof area gained potential energy to 44,051 MWh/year. In contrast to Ngaliyan sub-district which has the potential of generating energy electricity 222,222 MWh/year, because the area surface of the roof provided for exposure of the photovoltaic is also most extensive than the area of the roof surface on the other sub-district.
3.4. Potential of CO2 Mitigation
The production of electrical energy from the rooftop solar photovoltaic system model has the potential to reduce CO2 emissions. The reduction in CO2 emissions is proportional to the potential energy produced from the roof PV system. The CO2 mitigation coefficient is used to predict CO2 migration in the city of Semarang [46]. Figure 3 shows potential energy of solar photovoltaic, and prediction of CO2 mitigation in Semarang City, Indonesia. Installation of solar photovoltaic rooftop in Semarang City can reduce 1,394 tonCO2 in a year.
4. Conclusion
An overview of the potential for solar energy based on the photovoltaic roof system the potential of CO2 mitigation in Semarang City has been obtained. The estimation of solar energy potential has been focused on residential areas and refers to the analysis of the use of residential roof surfaces for solar panel installation. The technique of estimating solar energy potential using GIS area analysis is very beneficial in a wide area. This technique is very useful in estimating the area precisely, with a low error rate. The land use analysis technique with GIS that uses high-resolution satellite imagery (CSRT) is more beneficial in terms of cost and time. The estimation of the rooftop area is very dependent on the type of image used. The higher accuracy of a satellite image leads to the higher precision of the area to. In addition to the use of the data with high accuracy, all the geographic data calculations are based on geographic reference data.
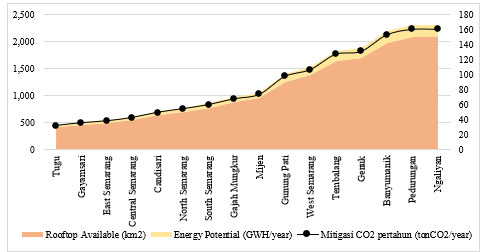 Figure 3: Potential of solar photovoltaic rooftop and prediction of mitigation CO2 on the settlements in Semarang City, Indonesia
This paper shows the potential of a rooftop photovoltaic system of solar energy in the 16 districts of Semarang City is 44,051 – 222,222 MWh/year. The average monthly solar radiation intensity in the 16 district of Semarang City ranges from 61.94 – 144.40 kWh/m2 per month, while the roof potential of each district varies from 412,987.50 m2 to 2,083,387 m2. Based on the results of the potential for solar energy, available roof area, and daily solar radiation intensity has been described in each district, total of solar energy potential from 16 district is expected to contribute approximately 40.87% as clean or low-carbon energy to electrical energy consumption needs of Semarang City with reference electricity consumption in 2018. The value can reduce 1,394 tonCO2 per year in Semarang City, Indonesia.
Conflict of Interest
The authors declare no conflict of interest.
- BPSR, 67 th edition BP Statistical Review of World Wide Energy, BP P.L.C, 2018.
- M. Mitscher and R. Ricardo, “Economic performance and policies for grid-connected residential solar photovoltaic systems in Brazil” Energy Policy, 49, 688–694, 2012. https://doi.org/10.1016/j.enpol.2012.07.009
- H. T. Nguyen and J. M. Pearce, “Estimating potential photovoltaic yield with r . sun and the open source Geographical Resources Analysis Support System” Solar Energy, 84(5), 831–843, 2010. https://doi.org/10.1016/j.solener.2010.02.009
- Y. Choi, J. Rayl, C. Tammineedi, and J. R. S. Brownson, “PV Analyst: Coupling ArcGIS with TRNSYS to assess distributed photovoltaic potential in urban areas” Solar Energy, 85(11), 2924–2939, 2011. https://doi.org/10.1016/j.solener.2011.08.034
- L. Ko, J. Wang, C. Chen, and H. Tsai, “Evaluation of the development potential of rooftop solar photovoltaic in Taiwan” Renewable Energy, 76, 582–595, 2015. https://doi.org/10.1016/j.renene.2014.11.077
- A. Dedinec et al., “Towards post-2020 climate change regime: Analyses of various mitigation scenarios and contributions for Macedonia” Energy, 94(2016), 124–137, 2016. https://doi.org/10.1016/j.energy.2015.10.085
- S. Kulkarni and R. Banerjee, “Renewable energy mapping in Maharashtra , India using GIS” Sustainable Cities and Regions, 3177–3184, 2011. DOI: 10.3384/ecp110573177 ·
- N. Martín-chivelet, “Photovoltaic potential and land-use estimation methodology” Energy, 94, 233–242, 2016. https://doi.org/10.1016/j.energy.2015.10.108
- E. Biyik et al., “A key review of building integrated photovoltaic (BIPV) systems” Engineering Science and Technology, an International Journal, 20(3), 833–858, 2017. https://doi.org/10.1016/j.jestch.2017.01.009
- G. E. Hassan, M. E. Youssef, Z. E. Mohamed, M. A. Ali, and A. A. Hanafy, “New Temperature-based Models for Predicting Global Solar Radiation” Applied Energy, 179(December 2017, 437–450, 2016. https://doi.org/10.1016/j.apenergy.2016.07.006
- B. Parida, S. Iniyan, and R. Goic, “A review of solar photovoltaic technologies” Renewable and Sustainable Energy Reviews, 15(3), 1625–1636, 2011. DOI:10.1016/j.rser.2010.11.032
- M. C. Rodríguez-amigo, M. Díez-mediavilla, D. González-peña, A. Pérez-burgos, and C. Alonso-tristán, “Mathematical interpolation methods for spatial estimation of global horizontal irradiation in Castilla-León , Spain: A case study” Solar Energy, 151, 14–21, 2017. DOI: 10.1016/j.solener.2017.05.024
- N. Kannan and D. Vakeesan, “Solar energy for future world: – A review,” Renewable and Sustainable Energy Reviews, 62(62), 1092–1105, 2016. DOI: 10.1016/j.rser.2016.05.022
- E. Kabir, P. Kumar, S. Kumar, A. A. Adelodun, and K. Kim, “Solar energy: Potential and future prospects” Renewable and Sustainable Energy Reviews, 82, September 2017, 894–900, 2018. https://doi.org/10.1016/j.rser.2017.09.094
- S. Chowdhury, “Design & Estimation of Rooftop Grid-tied Solar Photovoltaic System”, Thesis, Technische Universitat Hamburg, 2016.
- A. K. Shukla, K. Sudhakar, and P. Baredar, “Simulation and performance analysis of 110 kW p grid-connected photovoltaic system for residential building in India: A comparative analysis of various PV technology” Energy Reports, 2, 82–88, 2016. https://doi.org/10.1016/j.egyr.2016.04.001
- M. Bojic, J. Radulovic, V. Rankovic, D. Nikolic, L. Bojic, and J. Skerlic, “Flexible Thim-Film Solar Photovoltaics: Research and Application” ANNALS of Faculty Engineering Hunedoara – International Journal of Engineering), 37–40, 2016. ISSN: 1584-2665
- I. Amin, N. Harun, and A. Suyuti, “The Study of Renewable Energy Potential in Eastern of Indonesia Based on RETScreen International Analysis” 2016.
- S. Castellanos, D. A. Sunter, and D. M. Kammen, “Rooftop solar photovoltaic potential in cities: how scalable are assessment approaches ” Environmental Research Letters, 2017. https://doi.org/10.1088/1748-9326/aa7857
- N. Mukisa, R. Zamora, and T. T. Lie, “Feasibility assessment of grid-tied rooftop solar photovoltaic systems for industrial sector application in Uganda” Sustainable Energy Technologies and Assessments, 32(February), 83–91, 2019. https://doi.org/10.1016/j.seta.2019.02.001
- D. A. Jacques, J. Gooding, J. J. Giesekam, A. S. Tomlin, and R. Crook, “Methodology for the assessment of PV capacity over a city region using low-resolution LiDAR data and application to the City of Leeds ( UK )” Applied Energy, 124), 28–34, 2014. DOI: 10.1016/j.apenergy.2014.02.076
- K. Mainzer, S. Killinger, R. Mckenna, and W. Fichtner, “Assessment of rooftop photovoltaic potentials at the urban level using publicly available geodata and image recognition techniques” Solar Energy, 155, 561–573, 2017. https://doi.org/10.1016/j.solener.2017.06.065
- P. Redweik, C. Catita, and M. C. Brito, “3D Local Scale Solar Radiation Model Based on Urban Lidar Data” International Archives of the Photogrammetry, Remote Sensing and Spatial Information Sciences, 2011. https://doi.org/10.5194/isprsarchives-XXXVIII-4-W19-265-2011
- J. Peng and L. Lu, “Investigation on the development potential of rooftop PV system in Hong Kong and its environmental benefits” Renewable and Sustainable Energy Reviews, 27, 149–162, 2013. DOI: 10.1016/j.rser.2013.06.030
- M. Rumbayan, A. Abudureyimu, and K. Nagasaka, “Mapping of solar energy potential in Indonesia using artificial neural network and geographical information system” Renewable and Sustainable Energy Reviews, 16(3), 1437–1449, 2012. DOI: 10.1016/j.rser.2011.11.024
- S. Izquierdo, M. Rodrigues, and N. Fueyo, “A method for estimating the geographical distribution of the available roof surface area for large-scale photovoltaic energy-potential evaluations” Solar Energy, 82, 929–939, 2008. https://doi.org/10.1016/j.solener.2008.03.007
- S. Freitas, C. Catita, P. Redweik, and M. C. Brito, “Modelling solar potential in the urban environment: State-of-the-art review” Renewable and Sustainable Energy Reviews, 41, 915–931, 2015. DOI: 10.1016/j.rser.2014.08.060
- Indonesia Energy Council, “Buku Ketahanan Energi Indonesia Tahun 2017”, Semarang Central Statistics Agency, 2017.
- Semarang Central Statistics Agency, “Semarang Municipality in Figures 2018”, Semarang Central Statistics Agency, 2018.
- Semarang Central Statistics Agency, “Semarang Building Figures”, Semarang Central Statistics Agency, 2018.
- Ministry of Energy and Mineral Resources of the Republic of Indonesia, “Performance Report of the Ministry of Energy and Mineral Resources of the Republic of Indonesia”, Ministry of Energy and Mineral Resources of the Republic of Indonesia, 2017.
- A. L. Nugraha, Hani’ah, and R. D. Pratiwi, “Assessment of multi hazards in Semarang city” in AIP Conference Proceedings, 2017(July), 1–10. https://doi.org/10.1063/1.4987112
- M. A. Marfai et al., “Natural hazards in Central Java Province , Indonesia: An overview” Envoron Geol, 56, 335–351, 2008. https://doi.org/10.1007/s00254-007-1169-9
- Husnayaen, A. B. Rimba, T. Osawa, I. N. S. Parwata, F. K. Abd. Rahman As-syakur, and I. A. Astarini, “Physical assessment of coastal vulnerability under enhanced land subsidence in Semarang, Indonesia, using multi-sensor satellite data” Advances in Space Research, 2018. https://doi.org/10.1016/j.asr.2018.01.026
- H. Tjahjono, Suripin, and Kismartini, “Spatial analysis of field vulnerability concerning landslide in Southern Semarang Environment” in IOP Conf. Series: Earth and Environmental Science, 2019. doi:10.1088/1755-1315/243/1/012012
- I. Buchori, A. Pramitasari, A. Sugiri, M. Maryono, and Y. Basuki, “Adaptation to coastal flooding and inundation: Mitigations and migration pattern in Semarang City, Indonesia” Ocean and Coastal Management, 163(July), 445–455, 2018. DOI: 10.1016/j.ocecoaman.2018.07.017
- I. Buchori, A. Sugiri, M. Mussadun, D. Wadley, and Y. Liu, “A predictive model to assess spatial planning in addressing hydro- meteorological hazards: A case study of Semarang City , Indonesia” International Journal of Disaster Risk Reduction(April), 0–1, 2017. https://doi.org/10.1016/j.ijdrr.2017.11.003
- R. Perez, R. Seals, P. Ineichen, R. Stewartt, and D. Menicucci, “A New Simpifed Version of the Perez Diffuse Irradiance Model for Tilted Sufraces” Solar Energy, 39(3), 221–231, 1987. https://doi.org/10.1016/S0038-092X(87)80031-2
- W. A. Hetrick, P. M. Rich, and S. B. Weiss, “Modeling Insolation on Complex Surfaces,” in Thirteenth Annual ESRI User Conference, 1993, 2. Available: http://www.professorpaul.com/publications/hetrick_et_al_1993_esri.pdf
- L. Kumar, A. K. Skidmore, and E. Knowles, “Modelling topographic variation in solar radiation in a GIS environment” International Journal of Geographical Information Science, 11(5), 475–497, 1997. https://doi.org/10.1080/136588197242266
- Esri, “ArcGIS Help 10.1. Area Solar Radiation (Spatial Analyst)”, ESRI, 2013.
- P. Fu and P. Rich, “Design and implementation of the Solar Analyst: an ArcView extension for modeling solar radiation at landscape scales” in Proceedings of the Nineteenth Annual ESRI User Conference, 1999.
- M. Suri and J. Hofierka, “A New GIS-based Solar Radiation Model and Its Application to Photovoltaic Assessments” Transactions in GIS, 8(2), 175–190, 2004. DOI: 10.1111/j.1467-9671.2004.00174.x
- Asian Development Bank, Handbook for Rooftop Solar Development in Asia. 2014. Available: https://www.adb.org/publications/handbook-rooftop-solar-development-asia
- G. Knier, How do photovoltaics work, 2011. [Online]. Available: https://doc.uments.com/h-how-do-photovoltaics-work.pdf.
- World Meteorological Organization, WMO Statement on the State of the Global Climate, 1233. 2008. Available: https://public.wmo.int/en/our-mandate/climate/wmo-statement-state-of-global-climate
- International Energy Agency, Global Energy and CO2 Status Report. 2018. Available: https://webstore.iea.org/global-energy-co2-status-report-2018