Computational Intelligence and Statistical Learning Performances on Predicting Dengue Incidence using Remote Sensing Data

Adv. Sci. Technol. Eng. Syst. J. 5(4), 344–350 (2020);
 DOI: 10.25046/aj050440
Dengue is a viral infection disease transmitted to people through the bite of specific mosquito species living in a tropical zone. According to the World Health Organization, dengue has been listed among the top-ten diseases for 2019 as it makes 3.9 billion people in 128 countries be at risk of infection. One major cause of substantial dengue widespread is the globally warm climate that accelerates rapid growth of mosquito vectors. In this research, we aim to build data-driven models to predict dengue cases using satellite index data to represent temperature, humidity, and greenness over the surface area of Bangkok, which is our target area of dengue prediction because of its high infection cases. Oceanic Niño Index is also used as a predictor variable to represent climate variability. The modeling methods employ seven algorithms from two broad schemes of the machine learning field. Artificial neural network (ANN) and adaptive neuro-fuzzy inference system (ANFIS) are algorithms from the subfield of computational intelligence, whereas multiple linear regression (MLR), generalized linear model (GLM), support vector regression (SVR), classification and regression tree (CART), and chi-squared automatic interaction detection (CHAID) are from the statistical learning subfield. Performances of these algorithms are evaluated on the same set of out-of-sample data. The results are that ANFIS is the best model for predicting dengue outbreak in the capital city of Thailand.
1. Introduction
Dengue is a communicable disease that can indirectly transmit from an infected person to another through the bite by a female mosquito in the two major Aedes species, Ae. aegypti and Ae. albopictus. These small mosquitoes have white stripes on their back and legs. They bite during day-time and live in and around human habitats. These mosquitoes can transmit not only dengue virus, but also chikungunya, Zika, and yellow fever [1]. Illness from dengue infection is caused by one of the four types of viruses [2]: DENV1, DENV2, DENV3, and DENV4. Patients recovered from infection by a specific type of dengue virus are immune to that virus type for life. Unfortunately, they are still vulnerable to the other three types of dengue viruses. The many types of viruses is just one reason for a widespread of dengue fever. The other causes for a rapid spread of dengue are global warming phenomenon and poorly or unplanned urbanization. The rise in temperature globally makes mosquitoes spreading from a tropical region into subtropical zone such as China, Japan, U.S.A., and many countries in Europe [3]. A fast expansion of big cities is also another factor accelerating dengue spread as the Ae. aegypti mosquitoes can breed and lay eggs in small water holders such as vessels and abandoned containers.
In 1950, there were only 908 dengue cases reported [4] to the World Health Organization (WHO). The endemic areas are mostly countries in the Southeast Asia including Cambodia, Philippines, Thailand, and Vietnam. In 2016, the number of dengue infection cases reported to WHO has been substantially jumped to over 3.34 million cases. The latest reports [5] during September to November 2019 of the European Centre for Disease Prevention and Control (ECDC) list countries with most dengue cases in descending order as Brazil, Philippines, Mexico, Nicaragua, Thailand, Malaysia, and Colombia. The current number of dengue infections in Brazil is over two million cases which is almost ten times higher than the same period in the previous year. In Thailand as of November 2019, more than 120,000 cases have been reported and 126 cases are fatal [5]. The highest number of dengue infections in Thailand is in the Bangkok metropolitan area, which is the capital city with massive urbanization and warm atmosphere.
Based on the dengue case classification criteria released by WHO in 1997 [6], clinical infections can be broadly categorized into two distinct classes: dengue fever (DF) and dengue haemorrhagic fever (DHF)/dengue shock syndrome (DSS). DF is a classic dengue fever that infected person may either show no signs of illness, or having mild illness with symptoms such as abdominal pain and mucosal bleeding [7]. DHF is a type of severe dengue with manifestation of vascular permeability resulting in plasma leakage, a decrease in platelets in the blood, and an increase of red blood cells in relative to the plasma that may cause the fatal shock syndrome, DSS [7]. The classification of dengue infection as DF/DHF/DSS is based on historical cases in Thailand that infections normally occur in children younger than 15 years old [7]. At the present decade that dengue infections have extended to older age groups and spatially invade to different zones, clinical symptoms of infected patients show some variations from the WHO’s descriptions [8]. Therefore, in 2009 WHO developed new criteria and guideline for dengue case diagnosis and treatment. The new criteria [8] classify dengue infection into three main groups based on the ascending levels of severity as dengue without warning signs, dengue with warning signs such as abdominal pain and mucosal bleeding, and severe dengue that includes severe plasma leakage leading to shock, severe bleeding, and severe organ failure.
Fatal cases of severe dengue in Thailand are increasing from 36 deaths in 2014 to 127 deceases in 2019 [9]. The rise in dengue mortality in Thailand is more or less coincident with the occurrence of medium to strong level of El Niño events. This relation can be noticed from the high number of dengue fatality in El Niño years of 2015 and 2019. The coincidence of El Niño and dengue endemic, especially around the area of capital city, is of particular interest to our research team. We thus plan our modeling method to employ climate variability through the Oceanic Niño Index (ONI) as one independent factor to predict the number of dengue cases in Bangkok. Other independent variables are amount of rainfall and remote sensing indices to represent temperature, humidity, brightness, and greenness of vegetation. The modeling algorithms are those from the computational intelligence (artificial neural network — ANN, adaptive neuro-fuzzy inference system — ANFIS) and statistical learning schemes (multiple linear regression — MLR, support vector regression — SVR, generalized linear model — GLM, classification and regression tree — CART, chi-squared automatic interaction detection — CHAID).
A review of these and other learning techniques applied to predict dengue incidence is presented in Section 2. Details of dataset and our modeling method are explained in Section 3. Experimental results of model performance comparison are illustrated in Section 4. The conclusion is in Section 5.
2. Related Work
Historically, dengue has been identified as an endemic locally found in the Southeast Asian countries. After World War II, severe type of dengue (DHF) firstly appeared in Philippines in 1954 and later emerged in Thailand in 1958 and became an outbreak in Malaysia, Cambodia, Singapore, and Vietnam in the 1960s [9]. Currently, dengue expands its boundary from a local communicable disease to become a global epidemic. Disease prevention and efficient mechanisms to monitor and control infection are urgent actions needed to be implemented instantly by governments and health organizations worldwide. Scientists and researchers attempt to estimate in advance the outbreak of dengue infection with the purpose of precise warning leading to proper preparation and management.
Research teams from Singapore estimate dengue incidence with nonlinear regression model [10], time-series Poisson regression model [11], and neural network model [12]. Scientists in Malaysia apply satellite imagery to study the pattern of dengue incidence distribution with correlation analysis against land-use patterns in the geographic information system (GIS) [13]. To predict dengue cases in Malaysia, variations of network modeling methods such as ANFIS [14], self-organizing map [15], and a hybrid of genetic algorithm and ANN [16] are applied. Various research groups in Philippines study dengue incidence patterns through regression analysis [17], ANN [18], fuzzy association rule mining [19], and many descriptive studies [20]. The sophisticated methods such as a combination of flower pollination algorithm and least squares support vector machines (FPA-LSSVM) [21] and ANFIS with various parameter tuning methods [22] are applied to forecast dengue incidence in Indonesia. Modeling dengue incidence in Thailand includes a wide range of techniques such as exploratory analysis through the remote sensing GIS [23], Poisson autoregressive [24], cellular automata with the inclusion of genetic algorithm for chromosome weighting and ANN for determining probability in state change [25], SVR [26], Bayesian network [27], and generalized additive model (GAM) [28].
Besides the Southeast Asia, dengue has become a public health threat in more than hundred countries worldwide. Such global pandemic urgently requires collaboration among researchers and practitioners at both regional and global scales. The awareness regarding an attempt to monitor and control dengue in Taiwan can be noticed through many proposals adopting various state-of-the-art machine intelligence techniques including fuzzy inference system [29], multivariate logistic regression analysis [30], and decision tree induction [31]. To forecast dengue outbreak in southern China, researchers apply GAM [32], SVR as well as variations of regression modeling [33], and the factor-detector modeling module of the ArgGIS software [34]. Researchers in Sri Lanka adopt fuzzy system with trapezoidal membership function to predict the developing from classic dengue fever to the severe level using clinical evidences as input data [35].
In Latin America that dengue has spread massively during this decade, researchers apply numerous machine learning techniques to build an efficient predictive model. The applied techniques include SVR and k-nearest neighbor regression to predict cases in the northwest city of Argentina [36]. SVR and ANN are adopted to predict dengue infection in Paraguay and ANN shows the best result [37]. In Brazil which confronts the most serious dengue outbreak in 2019, GAM [38] and Pearson correlation analysis [39] are the main methods applied to predict dengue cases in Sao Paulo, whereas nearest-neighbor regression analysis [40] is the technique that researchers use for predicting cases in Rio de Janeiro. To project the spread of dengue virus globally towards the year 2020, 2050 and 2080, an international team of researchers [41] has applied the ensemble of boosted regression tree to show the trend in dengue transmission that around 60% of the global population living in Asia, Africa and Americas, in descending order, are at risk of infection.
It can be concluded from the literature review that dengue modeling techniques based on the mature machine learning methodology include regression analysis, ANN, ANFIS, SVR, GAM, and regression tree. We thus apply these main methods to derive prediction models to estimate number of dengue infection in the capital and also the most populous city of Thailand. The main focus is to observe performances of these popular modeling methods, and then select the most accurate model for predicting dengue outbreak in Bangkok.
3. Data and Modeling Method
3.1. Data Sources
In our modeling process, the target for prediction is number of patients in Bangkok metropolitan area that had been diagnosed as infected with dengue virus. These historical data are monthly dengue cases in Bangkok during the years 2003-2017. Data between 2003-2015 are used for training the models, whilst data of 2016-2017 are held out for testing performance of the models.
Independent variables to be used as predictors are time of the year represented by number of month (1 to 12) and satellite-based data obtained from the National Oceanic and Atmospheric Administration (NOAA), U.S.A. Rainfall data are from the Centers for Environmental Information [42]. Satellite indices to reflect vegetation health are obtained from the NOAA’s global vegetation health products [43]. The indices to be used as predictors in this research include smoothed and normalized difference vegetation index (SMN, or greenness), smoothed brightness temperature index (SMT, a thermal condition), vegetation condition index (VCI, a proxy for greenness anomaly), temperature condition index (TCI), and vegetation health index (VHI, a combined moisture and thermal conditions).
Another satellite-based index to reflect climate variability is also used in our modeling process. This climate index is Oceanic Niño Index (ONI) that can be accessed from the NOAA’s Weather Service [44]. The ONI is computed from the anomaly of sea surface temperature (SST) at the Niño3.4 region in the Pacific Ocean at the equator line near Indonesia and north Australia. The SST is monthly collected to compute ONI by averaging from the 3-month periods: the current one, the previous, and the following month. This 3-month average value is then compared to a thirty-year average to check temperature deviation. If the ONI values in five consecutive months are +0.5 °C or higher than the normal value, then the El Niño (warm event) phenomenon is announced. On the contrary, if the ONI values in five consecutive periods are –0.5 °C or lower than the normal value, the opposite phenomenon called La Niña (the cold event) is announced.
3.2. A Framework of Modeling Method
Main steps in our data modeling process are shown in Figure 1. In data preparation and integration step, remote sensing indices have to be transformed from weekly to be monthly by averaging weekly values of each month. We then select only the attributes contributing the most to accurate prediction in step 2. This is done by evaluating predictor importance value. Step 3 is the train-test separation. Training data are used in the model building step. Test data are used in the model evaluation step.
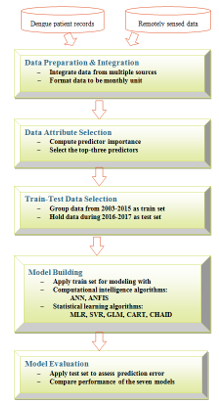 Figure 1: Steps in Data Modeling for Dengue Incidence Prediction
4. Performance Comparison Results
We perform experiments following the steps shown in Figure 1. Software tool used for running ANFIS algorithm is MATLAB, whereas other learning algorithms are run with IBM SPSS Modeler. All algorithms are tested with the same set of testing data that are unseen by the algorithms during the training phase to build model.
Data attributes used as model predictors to estimate number of dengue cases in Bangkok include the satellite-based indices (ONI, SMN, SMT, VCI, TCI, VHI), amount of rainfall, and number of month (1 to 12, in which 1 is January and 12 is December) in each year. Representation of each satellite-based index is as follows: ONI — climate variability, SMN — surface greenness, SMT — thermal condition, VCI — greenness anomaly, TCI — temperature condition, VHI — moisture and thermal conditions. Number of month can represent season in that months 5 to 8 are rainy season in Thailand. Correlations among the eight predictors are presented in Table 1. Strong correlations are highlighted with bold font.
Prior to building the model with training data set, we analyze importance of each predictor to select only the top-three ones contributing most toward the final predictive model. To compute the importance value [45], each independent variable is assessed through sensitivity analysis to observe the reduction in variance of the target field, which is the dengue incidence in this specific domain. The computed sensitivity values are then ranked to evaluate importance of each predictor; the higher the value, the more important the variable. The ranking result of all seven predictors is shown in Figure 2. The attribute SMT is missing from the figure because the coefficient of variation in this attribute is below the threshold. The top-three variables, which are ONI, month of the year, and SMN as a proxy of greenness, are then selected as important features to be used further in the modeling phase.
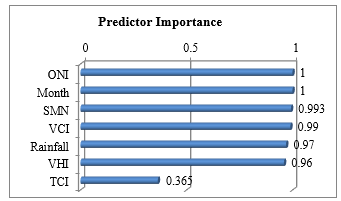 Figure 2: Importance Value of Independent Predictors
Table 1: Pearson Correlation among Predictor Attributes
| ONI | SMN | SMT | VCI | TCI | VHI | Month | |
| SMN | 0.078 | ||||||
| SMT | 0.118 | 0.735 | |||||
| VCI | 0.135 | 0.656 | 0.152 | ||||
| TCI | -0.362 | -0.107 | -0.143 | -0.331 | |||
| VHI | -0.282 | 0.304 | -0.046 | 0.289 | 0.807 | ||
| Month | -0.046 | -0.251 | -0.460 | 0.020 | -0.287 | -0.281 | |
| Rainfall | -0.115 | 0.120 | 0.398 | -0.131 | 0.236 | 0.161 | -0.439 |
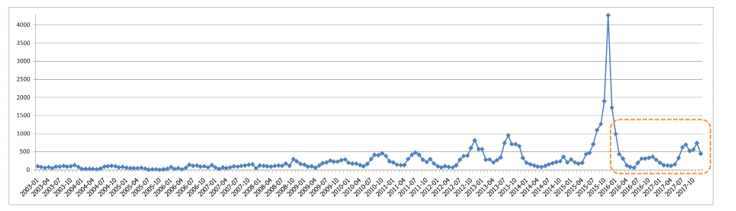 Figure 3: Distribution of Dengue Infection in Bangkok During 2003 to 2017 in which 2016-2017 are Test Data
Table 2: Performance of Learning Algorithms
| Algorithm | Mean Absolute Error (MAE) | Root Mean Square Error (RMSE) | Model Correlation | Model Building Time
(seconds) |
||
| Computation Intelligence | ||||||
| ANFIS | 151.511 | 216.536 | 0.835 | 4 | ||
| ANN | 211.296 | 308.277 | 0.827 | 8 | ||
| Statistical Learning | ||||||
| MLR | 200.681 | 236.613 | 0.501 | 4 | ||
| GLM (log function) | 217.706 | 280.076 | 0.501 | 4 | ||
| CHAID | 217.018 | 292.826 | 0.515 | 3 | ||
| SVR | 236.732 | 325.958 | 0.501 | 4 | ||
| CART | 278.939 | 381.517 | 0.815 | 3 | ||
After data attribute selection step, we prepare two subsets of data: training data and test data. Training data are the records during the years 2003-2015, containing 156 records. Test data are cases from 2016-2017, comprising of 24 records. Dengue case distribution in Bangkok between 2003-2017 is displayed in Figure 3. Vertical axis is the number of dengue infected patients. There exists an extreme outbreak in November 2015, which is the month that ONI value is as high as 2.5. ONI normally ranges between +2.5 to -2.5. The ONI value of -2.5 represent the strong El Nino event that makes the weather in Bangkok hotter and drier than normal years. The dashed area in the figure marks distribution of dengue cases in the test data.
The training data are used as input for each of the learning algorithms to build predictive model. The models are then tested for their performance using the out-of-sample test data of the years 2016-2017. Performance evaluation results are illustrated in Table 2. The measurements for performance evaluation of each model include the mean absolute error (MAE), root mean square error (RMSE), correlation between predictors and the target of the model, and time to build model. Consider from predictive errors, ANFIS shows the best performance with the minimum values in both error metrics. MLR shows the second best performance with errors a little bit higher that ANFIS. On the metric of model correlation, ANFIS is also the best one, while ANN comes as the second best model and CART is in the third place. CART and CHAID, which are the tree-based modeling methods, take less time to build model than the other methods. Based on the time aspect, ANN is the worst one.
Figure 4 shows comparative performance of the seven models based on four measurements in which the scales are normalized to be between 0 to 1. The three measurements (MAE, RMSE, time) seek for the lowest one to be the best, while correlation requires the highest one to outperform the others. Therefore, we transform the normalized correlation metric to be the reverse one by applying the formula (1- normalized_correlation) to make this metric in accordance with the others. Thus, model with all measurements closest to zero is the best one. From this criteria, we can rank the models from the best to the worst ones as follows: (1) ANFIS, (2) MLR, (3) CHAID, (4) ANN, (5) CART, (6) GLM, (7) SVR.
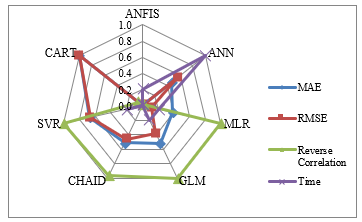 Figure 4: Comparison of Model Performance using Normalized Measurements
The objective of our modeling process is to predict the number of dengue cases in a specific region. It is thus a macro analysis aiming at dengue outbreak monitoring rather than a micro scope of classifying patients as infected with dengue virus or not. Moreover, our target variable is continuous data. Therefore, traditional measurements such as sensitivity, specificity, F-measure, recall, precision, and so on, cannot be applied. The most suitable metric is the error made by the model to predict number of dengue incidence. The plot in Figure 5 shows the difference between actual number of dengue cases (circle) against the predicted number of cases forecasted by ANFIS (star). It can be noticed that at extreme level of dengue infected cases higher than 700, ANFIS forecasts quite inaccurate. For the average level of infection around 100 to 300 cases, ANFIS can make a good prediction.
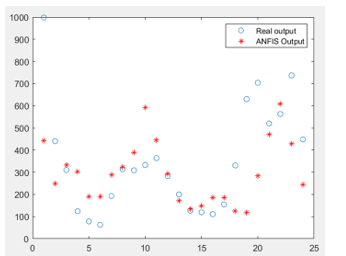 Figure 5: Predicting Performance of ANFIS on Test Data
5. Conclusion
Dengue is a fatal communicable viral disease threatening life of population in Thailand as well as many countries in the tropical zone with warm and humid weather providing a good condition for the spread of Ae. aegypti and Ae. albopictus mosquitoes that are the main carriers of dengue virus. The outbreak of dengue is seasonal in that infection is abnormally high in every two or three years. Many researchers observed that this spasmodic infection is coincident to the rise of sea surface temperature in the equatorial Pacific region. We thus include Oceanic Niño Index (ONI) as one main factor to derive a model to predict dengue cases in Bangkok. Other predictors used in our modeling phase are smoothed and normalized difference vegetation index (SMN), which is a proxy for vegetation greenness, and month of the year (1 to 12) that is used to capture season as dengue fever in Thailand normally widespread during months 6 to 11. The satellite features (SMN and ONI) and month attribute are selected from the original seven variables through the computation of predictor importance to select only the top-three features showing the best variance reduction against the target attribute, which is the number of dengue infected patients.
The selected features (ONI, SMN, month) in addition to the target field (dengue cases) are then used for the next step of data-driven model building. Modeling algorithms applied in this work are of two categories: computational intelligence and statistical learning. Computational intelligence algorithms are ANN and ANFIS. The other five algorithms (multiple linear regression, generalized linear model, support vector regression, regression trees — CART and CHAID) are in a group of statistical learning. We evaluate performance of all algorithms using the same set of out-of-sample data for a fair comparison. The experimental results reveal that ANFIS is the best predictor model. Multiple linear regression is the second best one. In the future, we plan to further our empirical study to cover every province of Thailand.
Conflict of Interest
The authors declare no conflict of interest.
Acknowledgment
This work has been supported by grant from Suranaree University of Technology through the funding of Data and Knowledge Engineering Research Unit in which the first and second authors are principal researchers.
- WHO, World Health Organization, “Dengue and severe dengue” Fact Sheet, updated 4 November 2019. https://www.who.int/news-room/fact-sheets/detail/dengue-and-severe-dengue
- CDC, Centers for Disease Control and Prevention, “Dengue” Access 10 May 2020. https://cdc.gov/dengue/about/index.html
- N.E.A. Murray, M.B. Quam, A. Wilder-Smith, “Epidemiology of dengue: past, present and future prospects” Clinical Epidemiology, 5, 299-309, 2013.
- N. Gyawali, R.S. Bradbury, A.W. Taylor-Robinson, “The epidemiology of dengue infection: harnessing past experience and current knowledge to support implementation of future control strategies” Journal of Vector Borne Diseases, 53, 293-304, 2016.
- ECDC, European Centre for Disease Prevention and Control, “Dengue worldwide overview” Access 21 April 2020. https://ecde.europa/en/dengue-monthly
- S. Bandyopadhyay, L. Lum, A. Kroeger, “Classifying dengue: a review of the difficulties in using the WHO case classification for dengue haemorrhagic fever” Tropical Medicine & International Health, 11(8), 1238-1255, 2006.
- S.R.S. Hadinegoro, “The revised WHO dengue classification: does the system need to be modified” Paediatrics and International Child Health, 32(S1), 33-38, 2012.
- B.A. Ajlan, M.M. Alafif, M.M. Alawi, N.A. Akbar, E.K. Aldigs, T.A. Madani, “Assessment of the new World Health Organization’s dengue classification for predicting severity of illness and level of healthcare required” PLoS Neglected Tropical Diseases, 13(8), e0007144, 2019. https://doi.org/10.1371/journal.pntd.0007144
- Vector Borne Disease Division, Ministry of Public Health, “Dengue infection (in Thai)” Access 10 May 2020. https://ddc.moph.go.th/index.php
- B. Loh, R.J. Song, “Modeling dengue cluster size as a function of Aedes aegypti population and climate in Singapore” Dengue Bulletin, 25, 74-78, 2001.
- Y. Hii, J. Rocklov, N. Ng, C. Tang, F. Pang, R. Sauerborn, “Climate variability and increase in intensity and magnitude of dengue incidence in Singapore” Global Health Action, 2, 124-132, 2009.
- H.M. Aburas, B.G. Cetiner, M. Sari, “Dengue confirmed-cases prediction: a neural network model” Expert Systems with Applications, 37, 4256-4260, 2010.
- N.C. Dom, A.H. Ahmad, Z.A. Latif, R. Ismail, B. Pradhan, “Coupling of remote sensing data and environmental-related parameters for dengue transmission risk assessment in Subang Jaya, Malaysia” Geocarto International, 28(3), 258-272, 2013.
- T. Faisal, M.N. Taib, F. Ibrahim, “Adaptive neuro-fuzzy inference system for diagnosis risk in dengue patients” Expert Systems with Applications, 39, 4483-4495, 2012.
- F. Ibrahim, T.H.G. Thio, To Faisal, M. Neuman, “The application of biomedical engineering techniques to the diagnosis and management of tropical diseases: a review” Sensors, 15, 6947-6995, 2015.
- N.A. Husin, N. Mustapha, M.N. Sulaiman, R. Yaacob, H. Hamdan, M. Hussin, “Performance of hybrid GANN in comparison with other standalone models on dengue outbreak prediction” Journal of Computer Sciences, 12(6), 300-306, 2016.
- G.L. Su, “Correlation of climatic factors and dengue incidence in metro Manila, Philippines” AMBIO: A Journal of the Human Environment, 37(4), 292-294, 2008.
- H.I. Datoc, R. Caparas, J. Caro, “Forecasting and data visualization of dengue spread in the Philippines Visayas island group” in 7th Int. Conf. on Information, Intelligence, System & Applications (IISA), Chalkidiki, Greece, 2016. https://doi.org/10.1109/ IISA.2016.7785420
- A.L. Buczak, B. Baugher, S.M. Babin, L.C. Ramac-Thomas, E. Guven, Y. Elbert, P.T. Koshute, J.M.S. Velasco, V.G. Roque Jr, E.A. Tayag et al., “Prediction of high incidence of dengue in the Philippines” PLoS Neglected Tropical Diseases, 8(4), e2771, 2014. https://doi.org/10.1371/journal.pntd. 0002771
- K.A. Agrupis, M. Ylade, J. Aldaba, A.L. Lopez, J. Deen, “Trends in dengue research in the Philippines: a systematic review” PLoS Neglected Tropical Diseases, 13(4), e0007280, 2019. https://doi.org/10.1371/journal.pntd. 0007280
- Z. Mustaffa, M.H. Sulaiman, F. Ernawan, Y. Yusof, M.F.M. Mohsin, “Dengue outbreak prediction: hybrid meta-heuristic model” in 19th IEEE/ACIS Int. Conf. on Software Engineering, Artificial Intelligence, Networking and Parallel/Distributed Computing (SNPD), Busan, South Korea, pp. 271-274, 2018.
- B. Rachmat, O.D. Nurhayati, Suryono, “Prediction the number of patients at dengue hemorrhagic fever cases using adaptive neural fuzzy inference system (ANFIS)” International Journal of Innovative Research in Advanced Engineering, 3(4), 23-28, 2017.
- A. Chaikoolvatana, P. Singhasivanon, P. Haddawy, “Utilization of a geographical information system for surveillance of Aedes aegypti and dengue haemorrhagic fever in north-eastern Thailand” Dengue Bulletin, 31, 75-82, 2007.
- M. Tipayamongkholgul, C. Fang, S. Klinchan, C. Liu, C. King, “Effects of the El Nino-Southern Oscillation on dengue epidemics in Thailand, 1996-2005” BMC Public Health, 9, article 422, 2009. https://doi.org/10.1186/ 1471-2458-9-422
- T. Soemsap, S. Wongthanavasu, W. Satimai, “Forecasting number of dengue patients using cellular automata model” in 2014 Int. Electrical Engineering Congress (iEECON), Chonburi, Thailand, 2014. https://doi.org/10.1109/ iEECON.2014.6925876
- N. Sumanasinghe, A.R. Mikler, J. Muthukudage, C. Tiwari, R. Quiroz, “Data driven prediction of dengue incidence in Thailand” in Int. Conf. on Computing and Information Technology (IC2IT 2017), Bangkok, Thailand, pp. 95-107, 2017.
- C. Ruangudomsakul, A. Duangsin, K. Kerdprasop, N. Kerdprasop, “Application of remote sensing data for dengue outbreak estimation using Bayesian network” International Journal of Machine Learning and Computing, 8(4), 394-398, 2018.
- R. Jain, S. Sontisirikit, S. Iamsirithaworn, H. Prendinger, “Prediction of dengue outbreaks based on disease surveillance, meteorological and socio-economic data” BMC Infectious Diseases, 19, article 272, 2019. https://doi.org/10.1186/s12879-019-3874-x
- D. Saikia, J.D. Dutta, “Early diagnosis of dengue disease using fuzzy inference system” in 2016 Int. Conf. on Microelectronics, Computing and Communications (MicroCom), Durgapur, India, 2016. https://doi.org/10. 1109/MicroCom.2016.7522513
- C. Huang, C. Hsu, H. Guo, S. Su, H. Lin, “Dengue fever mortality score: a novel decision rule to predict death from dengue fever” Journal of Infection, 75, 532-540, 2017.
- C. Wu, S. Kao, C. Shih, M. Kan, “Open data mining for Taiwan’s dengue epidemic” Acta Tropica, 183, 1-7, 2018.
- X. Qi, Y. Wang, Y. Li, Y. Meng, Q. Chen, J. Ma, G.F. Gao, “The effects of socioeconomic and environmental factors on the incidence of dengue fever in the Pearl River Delta, China, 2013” PLoS Neglected Tropical Diseases, 9(10), e0004159, 2015. https://doi.org/ 10.1371/journal.pntd.0004159
- P. Guo, T. Liu, Q. Zhang, L. Wang, J. Xiao, Q. Zhang, G. Luo, Z. Li, J. He, Y. Zhang, W. Ma, “Developing a dengue forecast model using machine learning: a case study in China” PLoS Neglected Tropical Diseases, 11(10), e0005973, 2017. https://doi.org/10.1371/journal.pntd. 0005973
- Y. Chen, Z. Zhao, Z. Li, W. Li, Z. Li, R. Guo, Z. Yuan, “Spatiotemporal transmission patterns and determinants of dengue fever: a case study of Guangzhou, China” International Journal of Environmental Research and Public Health, 16(14), article 2486, 2019. https://doi.org/10.3390/ ijerph16142486
- S.D.P. Jayasundara, S.S.N. Perera, G.N. Malavige, S. Jayasinghe, “Mathematical modelling and a systems science approach to describe the role of cytokines in the evolution of severe dengue” BMC Systems Biology, 11, article 34, 2017. https://doi.org/ 10.1186/s12918-017-0415-3
- J.M. Scavuzzo, F. Trucco, M. Espinosa, C.B. Tauro, M. Abril, C.M. Scavuzzo, A.C. Frery, “Modeling dengue vector population using remotely sensed data and machine learning” Acta Tropica, 185, 167-175, 2018.
- J.D. Mello-Roman, J.C. Mello-Roman, S. Gomez-Guerrero, M. Garcia-Torres, “Predictive models for the medical diagnosis of dengue: a case study in Paraguay” Computational and Mathematical Methods in Medicine, 2019, article 7307803, 2019. https://doi.org/10.1155/ 2019/7307803
- E.C. Farinelli, O.S. Baquero, C. Stephan, F. Chiaravalloti-Neto, “Low socioeconomic condition and the risk of dengue fever: a direct relationship” Acta Tropica, 180, 47-57, 2018.
- I. Ogashawara, L. Li, M.J. Moreno-Madrinan, “Spatial-temporal assessment of environmental factors related to dengue outbreaks in Sao Paulo, Brazil” GeoHealth, 3(8), 202-217, 2019.
- A.P.R. Dalvi, J.U. Braga, “Spatial diffusion of the 2015-2016 Zika, dengue and chikungunya epidemics in Rio de Janeiro Municipality, Brazil” Epidemiology & Infection, 147, article e237, 2019. https://doi.org/10.1017/ s0950268819001250
- J.P. Messina, O.J. Brady, N. Golding, M.U.G. Kraemer, G.R. William Wint, S.E. Ray, D.M. Pigott, F.M. Shearer, K. Johnson, L. Earl et al., “The current and future global distribution and population at risk of dengue” Nature Microbiology, 4(9), 1508-1515, 2019.
- NOAA, National Centers for Environmental Information, “Climate Data Online” Access 11 January 2020. https://www.ncdc.noaa.gov/cdo-web/
- NOAA STAR, Center for Satellite Applications and Research, “Global Vegetation Health Products” Access 11 January 2020. https://www.star. nesdis.noaa.gov/smcd/emb/vci/VH/vh_browseByCountry_province.php
- NOAA National Weather Service, Climate Prediction Center, “Cold & Warm Episodes by Season” Access 11 January 2020. http://origin.cpc.ncep. noaa.gov/products/analysis_monitoring/ensostuff/ONI_v5.php
- IBM, IBM SPSS Modeler 17 Algorithms Guide, IBM Corp, 2015.