
Nonlinear  -norm based PCA for Anomaly Network Detection
Volume 5, Issue 4, Page No 234-243, 2020
Author’s Name: Amal Hadri1,a), Khalid Chougdali2, Raja Touahni1
View Affiliations
1LASTID Laboratory, Faculty of Science, Ibn tofail University, 14000, Morocco
2GREST Research Group, National School of Applied Sciences (ENSA), 14000, Morocco
a)Author to whom correspondence should be addressed. E-mail: amal.hadri@uit.ac.ma
Adv. Sci. Technol. Eng. Syst. J. 5(4), 234-243 (2020); ![]() DOI: 10.25046/aj050429
DOI: 10.25046/aj050429
Keywords: PCA, l2,p-norm PCA, Nonlinear l2,p-norm PCA, Network Anomaly Detection, Feature extraction methods, KDDcup99, NSL-KDD

Export Citations
Intrusion detection systems are well known for their ability to detect internal and external intrusions, it usually recognizes intrusions through learning the normal behaviour of users or the normal traffic of activities in the network. So, if any suspicious activity or behaviour is detected, it informs the users of the network. Nonetheless, intrusion detection system is usually prone to a high false positive rate & a low detection rate as a consequence of the tremendous amount of meaningless information used in the network traffic utilized to create the intrusion detection system. To overcome that, many techniques like Principal Component Analysis (PCA), L1-PCA and l2,p-norm based PCA were suggested. However, these methods are linear and not robust to outliers. This paper introduces the nonlinear variant of the l2,p-norm principal component analysis. Namely, the nonlinear l2,p-norm principal component analysis intends to project the data sets into a more feasible form so that the meaning of the data is damaged as less as possible. The proposed technique is not uniquely robust to outliers but keeps PCAs positive properties as well. Experimental results on the datasets KDDCup99 and NSL-KDD show that the proposed technique is extra e_ective, robust and outperform PCA, L1-PCA and l2,p-norm based PCA algorithms.
Received: 18 May 2020, Accepted: 17 July 2020, Published Online: 28 July 2020
1. Introduction
Substantial shift in the proliferation of network security tools as well as the highly sophisticated attacks and intrusions are occurring in world during this information age. The conventional techniques in network security landscape such as data encryption, firewalls & user authentication are not sufficient to protect against existing threats. In order to detect any damages caused by attackers in a particular network. Denning [1] has introduced the Intrusion Detection System (IDS). IDSs are used to analyse network packets and determine if the intrusion is threat or not. Two types for IDSs have been developed network-based and host-based IDSs.
Generally, IDS are either, anomaly based or misuse based techniques (equally called knowledge or signature-based) [2]. These techniques have their advantages and limits. In misuse-based method, a database of known attacks signatures (also known as patterns) compares attacks signatures to the data (packets) existing in the network. When a signature is detected, this method produces an alarm signalling a known intrusion. However, the weakness of this method is in its inability to detect new intrusions (or attacks). In the anomaly-based IDS, behavioural reference of system or network is built based on the use of the data that represent the normal behaviour. Consequently, the zero day attacks are well managed and attacks or intrusions in this case are simply any action that deviates from the pre-defined reference. Nonetheless, due to the noisy and redundant traffic data that contain many irrelevant features, anomaly-based technique may produce a significant amount of false alarms leading to unsatisfactory detection rate. To address the issue of high dimensionality, some feature reduction and feature selection techniques have been used such as the principal component analysis (PCA) [3, 4] & the linear discriminant analysis (LDA) [5]. Additionally in the context of feature extraction, regularized discriminant analysis RDA [6], the quadratic discriminant analysis (QDA), with maximum margin criterion(MMC) [7] have been used.
Other techniques exist which are extended variants of PCA like for instance: (i) Kernel PCA [8] that maps nonlinearly the original data into a higher-dimensional space & after that it applies the PCA algorithm to extract the features (ii) the weighted PCA (WPCA) [9] it employs a weighted distance to address the impact of outliers onto the directions, (iii) the popular Fuzzy PCA [10–13] that fuzzify the original data to get the fuzzy membership for every data & transform PCA into Fuzzy PCA, (iv) Sparse PCA [14] that extends the classical PCA by introducing sparsity structures to the input variables.
The precedent algorithms are generally based on a global Euclidean structure. Unlike the manifold learning algorithms, which are well designed to maintain the local geometric structure of data and captivate the attention of many researchers in machine learning and the recognition of patterns fields. The most-known manifold learning techniques are: marginal fisher analysis (MFA) [15], locality preserving projection (LPP) [16] & Neighbourhood Preserving Embedding (NPE) [17]. MFA is a supervised manifold learning technique that endures the local manifold information, LPP is mainly a linear approximation of Laplacian embedding (LE) [18] & NPE is principally a linear approximation of locally linear embedding (LLE) [19]. Many interesting methods for dimensionality reduction have been made based on these techniques (MFA, LPP and NPE).
Lately, and to enhance the effectiveness to outliers for feature extraction many approaches use several criterion functions like L1-norm maximization or minimization and nuclear norm [20–25]. Nuclear norm obtains clean data with low-rank structure, however it remains out of sample issue. L1-norm based subspace learning method is among them & it turn into a very attractive subject in dimensionality reduction & machine learning fields. For instance, [22] developed a technique called L1-PCA, where the projection matrix is obtained through minimizing L1-norm-based reconstruction error in the objective function of PCA. Solving L1-PCA is computationally costly, to tackle this problem, Kwak [21] proposed a method called PCA-L1 that solves the principal components through maximizing the variance, that is computed via L1-norm. To better demonstrate the efficiency of subspace learning techniques, Kwak et al. extended L1-norm into Lp-norm and introduced Lp-norm-based LDA and PCA [26, 27].
However, almost all the L1-norm based PCA techniques can not optimally minimize the reconstruction error, that is the main point of PCA. Additionally, these techniques are not invariant to rotation, which is significant property in learning algorithms [26, 27]. To address these issues, R1-PCA [27] was introduced to minimize the reconstruction error by way of putting l2-norm on the spatial dimension and the L1-norm on the data. Optimal mean R1-PCA [28] was proposed as well, this algorithm uses the optimal mean in R1-norm instead of the fixed mean utilized in R1-PCA. Inspired by this, [29] proposed the `2,p-norm based PCA and extends R1-PCA into a generalized robust distance metric learning formulation for PCA. The idea behind this algorithm is to utilize `2,p-norm as a distance metric for the reconstruction error, and uses a non-greedy algorithm as an optimal solution, that has a closed-form solution in every iteration. `2,p-norm PCA keeps all PCA’s advantages such as rotational invariance. The optimal solution involves the covariance matrix, and it is robust against outliers.
`2,p-norm PCA [29] has its own weaknesses. In fact, it cannot be efficient against noise and outliers if the data that we are dealing with have nonlinear structures, which give rise to false results. To address one of the weaknesses in the area of intrusion detection system, we suggest a nonlinear version of `2,p-norm based PCA less prone to outliers. Our nonlinear `2,p-norm based PCA technique is extra robust than the conventional `2,p-norm based PCA as demonstrated by the experiments we performed using two well-known data sets namely KDDcup99 [30–32] and NSL-KDD [33, 34].
The rest of this paper is organized as follows. Section II reviews `2,p-norm based PCA. Nonlinear `2,p-norm based PCA is suggested in Section III. In Section IV, we present the simulated datasets. Section V reports the experiments and disscussion of the results. The conclusions are presented in Section VI.
2. 2,p-norm PCA Algorithm
The `2,p-norm based PCA utilized here and from where the nonlinear case is originated was proposed in [29]. The `2,p-norm based principal component algorithm which Wang & al. suggested in [29] is mainly based on the principal component algorithm (PCA)[3, 4] where the large reconstruction errors, dominate the objective function. In Wang & al. proposed algorithm, the objective function was extended to reduce the impact of large distance and to include the rotational invariance. Following, the algorithm is briefly presented.
A more detailed description can be found in [29].
Wang & al. proposed a generalized robust PCA where:

where 0 < p ≤ 2.
Notice here that the optimization process of the objective function
(1) is very hard, so they simplified the objective function by using simple algebra as follows:
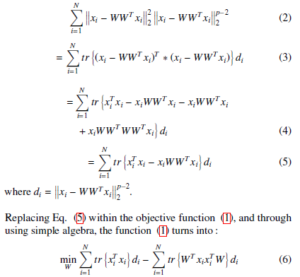
The main goal now, is how to solve the optimal projection matrix W of the objective function (6). The aim is to obtain a projection matrix W that will minimize the value of the objective function (6). The objective function (6) has unknown variables W & di that is connected with W. Therefore, it is very hard to straightforwardly solve the objective function (6) since it does not have a closed-form solution. Therefore, an algorithm will be elaborated now for alternately updating W (while keeping di fixed) and di (while keeping W fixed). To get extra precise, in the (t + 1)(th) iteration, when di(t) is known, accordingly we will minimize the objective function (6) in order to update W. In this particular case, the first term in the objective function (6) turns into a constant. Consequently, Eq. (6) becomes:
![]()
subject to WTW = Ik.
where D is a diagonal matrix & di are its elements on diagonal, and where the column vectors in W of the objective function (7) which contains the eigenvectors of XDXT matching to the k largest eigenvalues. Then, the diagonal element di of the matrix D is updated. Until the algorithm is converged, the prior iterative procedure will be repeated. The pseudocode of solving the objective function
(1) is summarized in Algorithm 1.
Algorithm 1 `2,p-norm based PCA
Input: X = [x1, x2, x3,…., xN] ∈ Rm×N, k, p, where X is centralized.
Initialize: W1 ∈ Rm×k which satisfies the equation WTW = Ik, t = 1. While not converge do
- Calculate diagonal matrix D whose diagonal elements are T xi 2p−2. di = xi − WW
- Compute the weight covariance matrix XDXT.
- Solve W∗ = argmax tr(WT XDXW)
The columns vectors of optimal projection matrix Wt which contains the first k eigenvectors of XDXT matching to the k largest eigenvalues.
- t ← t + 1;
end while Output: Wt ∈ Rm×k
3. The proposed method
`2,p-norm based PCA [29], like all the linear variants of PCA fails sometimes in producing the optimal projection vectors since it permits uniquely a linear dimensionality reduction [35]. Therefore, if we are dealing with complex nonlinear structures of data, that can be presented differently in a linear space, linear variants of PCA will skew the results. To address this problem, this section introduces a new nonlinear version of `2,p-norm based PCA namely nonlinear `2,p-norm based PCA.
3.1 Nonlinear `2,p-norm PCA Algorithm
We suggest a generalized nonlinear robust PCA where:
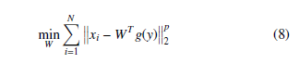
subject to WTW = Ik.
Where y = xi ∗ w, 0 < p ≤ 2 and g can be chosen as nonlinear function. In this article, the function g was chosen to be sigmoid function like:
- Gudermannian function
R y 1 y
g(y) = 0 cosh tdt = 2arctan(tanh(2 ))
- Generalised logistic function g(y) = (1 + e−x)−α,α > 0
- Arctangent function g(y) = artan y
- Hyperbolic tangent
g(y) = tanh y = eeyy−+ee−−yy
By utilizing simple algebra, equation (8) will be:
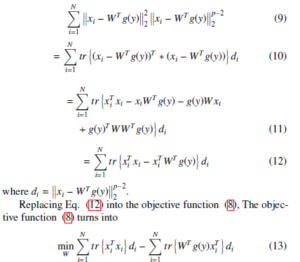
Now our ultimate aim is to have a projection matrix W that can minimize the value of the objective function (13). 2 unknown variables W and di existing in the objective function (13). Hence, it will not accept a closed-form solution & it is hard to straightforwardly solve the solution of the objective function (13). Therefore, an algorithm could be elaborated for alternately updating W (while keeping di fixed) and di (while keeping W fixed). In more details, in the (t + 1)(th) iteration, when di(t) is known, accordingly W updated through the minimization the objective function (13). In cases like these, the first term in the function (13) turns into a constant. Therefore, Eq. (13) becomes
![]()
subject to WTW = Ik.
where Y = XW and D is a diagonal matrix & di are its elements
on diagonal. The column vectors in W of the objective function (14) which contains the eigenvectors of XDXT matching the k largest eigenvalues. Afterwards, the element di is updated. Until the algorithm is converged, the prior iterative procedure will be repeated. Finally, we recapitulate the proposed method in Algorithm 2.
Algorithm 2 Nonlinear `2,p-norm PCA
Input: X = [x1, x2, x3,….., xN] ∈ Rm×N, k, p, where X is centralized.
Initialize: W1 ∈ Rm×k which satisfies the condition WTW = Ik, t =
1.
While not converge do
- Calculate diagonal matrix D whose diagonal elements are
di = xi − WTg(y) 2p−2.
- Solve W∗ = argmax tr(WTg(Y)XT D).
The columns vectors of optimal projection matrix Wt that contain the first k eigenvectors of XDXT matching to the k largest eigenvalues.
- t ← t + 1;
end while Output: Wt ∈ Rm×k
4. The Simulated Datasets
In this section, we present briefly the two datasets utilized during our experiments as well as the pre-processing step used to standardize these datasets.
4.1 KDDCup99 dataset
The KDDCup99 [30, 31] dataset was utilized in the KDD (Knowledge Discovery & Data Mining Tools Conference) Cup 99 Competition [32]. It is created & managed by DARPA Intrusion Detection Evaluation Program, since it was derived from the original DARPA dataset. It does contain several TCPdump raws, collected over 9 weeks.
The creation of the dataset was achieved in two phases: the first phase took over seven weeks and it was dedicated to create the training data. The full training data has almost 5 million connection records. The second phase took 2 weeks and it was dedicated to create the test data which represents two million connection records.
Almost 20% of the 2 datasets are normal connections (not attacks). Concerning attack connections, the 39 types of attacks are categorized into 4 categories: DOS, R2L, U2R, PROBE.
- Denial of Service (DoS) attacks, the attacker seeks to make some resources unavailable to handle simple and legitimate requests, consequently denying legitimate users access to a resource.
- Probe attacks, the attacker seeks to search out as much as possible network vulnerabilities and collect information via scanning a network.
- Remote-to-Local (R2L) attacks, the attacker seeks to gain access to the targeted system in an illegal way via transmitting packets to a machine over a network, then exploits machines vulnerability through compromising the security by the way of password guessing/breaking.
- User-to-Root (U2R) attacks, by utilizing Buffer overflow attack, the attacker seeks to gain root access to the system through just having a normal user account.
We can classify KDDCup99 features into three categories:
- Basic features: This group contains all the attributes that could be excerpted from a TCP/IP connection. The vast majority of these features usually engender an indirect delay in detection.
- Traffic features: The features belonging to this group are calculated in regard to a window interval.
- Content features: More than half of Probing and DoS attacks possess countless intrusion frequent sequential patterns, it is caused because these attacks carry out numerous connections to the host(s) in a lapse of time. On the other side, The U2R and R2L attacks are encapsulated in the payload of the packets, & usually contain uniquely a single connection, consequently, they do not have any intrusion frequent sequential patterns. To identify these types of attacks, some extra features are required to identify doubtful behavior in the packet payload. We call these features “content features”.
4.2 NSL-KDD dataset
NSL-KDD [33, 34] was proposed to solve some of KDDcup99 dataset drawbacks. The main ameliorations are:
- An acceptable number of train sets (125973 samples) & test sets (22544 samples), that is rational and make it easier to make experiments with the entire data set.
- The non-existence redundancy sample in the dataset & therefore it enables the classifiers to generate an un-skewed result.
- The training set has different probability distribution compared to the test set.
- Unknown attack types are existing in the test set, & they do not exist in the training set that makes it more reasonable.
It should be mentioned that the attack classes existing in the
NSL-KDD database are also classified into 4 categories: DOS, R2L, U2R, PROBE and for every record there are 41 attributes developping different features of the flow & a label assigned to each either as an attack type or as normal.
4.3 The pre-processing step
Some classifiers generate a improved accuracy rate on normalized data sets, this is why the pre-processing step is more than crucial. This step was successfully carried out by replacing the discrete attributes values of the databases toward continuous values through exploring the same idea utilized in [36], the concept will be explained briefly as follow: for any discrete attribute i that accept k dissimilar values. The attribute i can be asserted via k coordinates include ones & zeros. For example, the attribute called protocol type, that takes 3 values, i.e. tcp, udp or icmp. According to the concept, the prior values turn into their equivalent coordinates (1,0,0), (0,1,0) or (0,0,1).
5. Experiments and Discussion
The current section is dedicated to present the experiments carried out to show the efficiency of our proposed algorithm. To examine our approach we used the popular datasets KDDcup99 & NSL-KDD, additionally we compare our method with PCA [3, 4], L1-PCA [22], `2,p-norm based PCA [29] to prove the effectiveness of our algorithm. The following measures are calculated: detection rate (DR), false positive rate (FPR) & F-measure presented underneath:
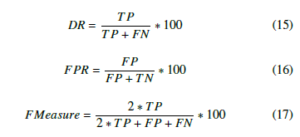
where True positives (TP) are attacks successfully predicted. False negatives (FN) correspond intrusions classified as normal instances, false positive (FP) are normal instances badly classified, & true negatives (TN) are normal instances successfully predicted. We considerate that the most trustworthy and effective feature extraction algorithm is the one with the highest DR / F-measure & with the lowest FPR.
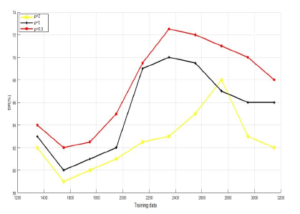
Figure 1: Evaluation of deferent values of the parameter p on KDDcup99 database.
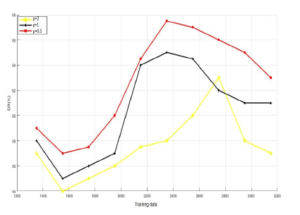
Figure 2: Evaluation of different values of the parameter p on NSL-KDD database.
The first two experiments were made to define the adequate initial parameter p as well as the nonlinear function that increases the efficiency of the nonlinear `2,p-norm based PCA. Figure 1 and Figure 2 plot the values of the detection rate versus the training data with different values of p for both datasets (KDDCup99 & NSL-KDD). As it is shown in Figure 1 and Figure 2, the detection rate is at its lowest values when p is 2. However, when p =1 and p=0.5, it increases the detection rate for both datasets. The explanation for this is if we increase the value of p the impact of outliers will increase, thus the value of the reconstruction error will be huge and dominate the objective function 8. Consequently, we set p to 0.5 for the next experiments.
The second experiment, as explained before, aims to find the best nonlinear function that enhances the effectiveness of our proposed technique. The Figure 3 and Figure 4 depict the values of the detection rate using four different sigmoidal functions for both datasets (KDDCup99 & NSL-KDD). As it is seen in Figure 3 and Figure 4 the hyperbolic tangent is the function that produce the highest detection rate on KDDCupp99 database as well as for the NSL-KDD database. Therefore, we will be using this function in the rest of our experiments.
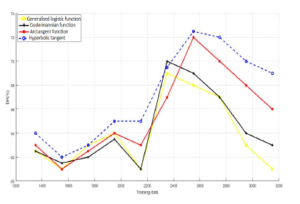
Figure 3: Evaluation of different nonlinear functions on KDDcup99 database.
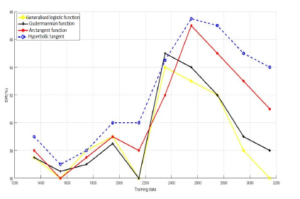
Figure 4: Evaluation of deferent nonlinear functions on NSL-KDD database.
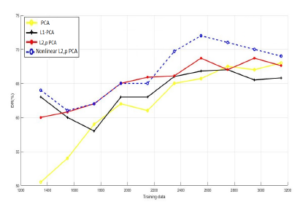
Figure 5: Training data vs. DR for KDDcup99 database.
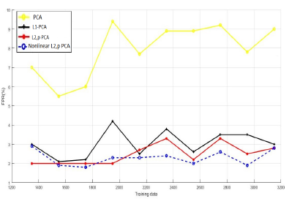
Figure 6: Training data vs. FPR for KDDcup99 database.
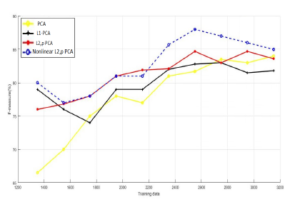
Figure 7: Training data vs. F-measure for KDDcup99 database.
Figures 5, 6 and 7 show the results we obtained when comAnother explanation to that is the distribution nature of data, i.e if the structure of data is nonlinear or extra-complex, that can be badly resented in a linear space, the linear models of PCA will be less efficient.
Regarding FPR, Figure 6 exhibits that maximum value of the false positive rate of the suggested algorithm is around 3%. This proves that the approach has the ability to differentiate normal connections from attacks.
Concerning NSL-KDD dataset, Figures 8, 9 and 10 assert that the nonlinear `2,p-norm based PCA overcomes the linear variants of PCA, and it enhances the detection rate by at least 6% over PCA and L1-PCA, 3% over `2,p-norm based PCA. Also, as we observe from the Figure 9 the proposed approach still produce the lower values for the false positive rate compared to linear PCA models.
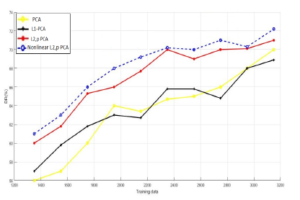
Figure 8: Training data vs. DR for NSL-KDD database.
In the second experiment, we examinated the suggested approach when changing the number of principal component, we choose just 10 of the 41 principal components and increased their number during the simulation.
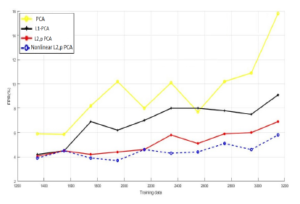
Figure 9: Training data vs. FPR for NSL-KDD database.
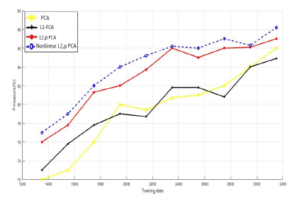
Figure 10: Training data vs. F-measure for NSL-KDD database.
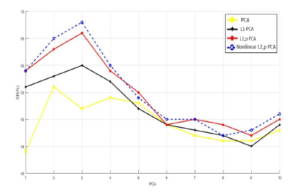
Figure 11: Principal Components vs. DR for KDDcup99 database.
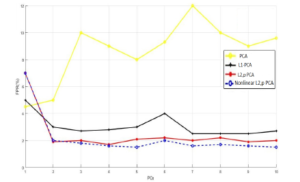
Figure 12: Principal Components vs. FPR for KDDcup99 database.
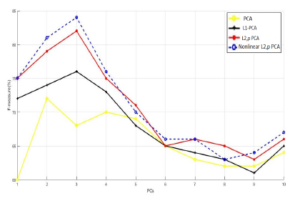
Figure 13: Principal Components vs. F-measure for KDDcup99 database.
Note that the simulation settings were different from the first Figure 14: Principal Components vs. detection rate for NSL-KDD. experiment. This time we utilized the following composition: for the training samples (1000 normal, 100 DOS, 50 U2R, 100 R2L and From Figure 11 and 13, we can see that nonlinear `2,p-norm 100 PROBE) and for the test samples (100 normal data, 100 DOS based PCA takes the lead over the linear PCA models and preserves its superiority in producing high DR and F-measure values, it gives at least a 60 % for the first principal component and achieves around 67% as a maximum detection rate, and at least 75 % for the first principal component and gets around 84% as a maximum F-measure value. Additionally, we observe that the new approach outperform all the other linear PCA variants. Concerning the FPR, we can see from Figure 12 that nonlinear `2,p-norm based PCA gives the lowest FPR unlike the aforementioned linear once.
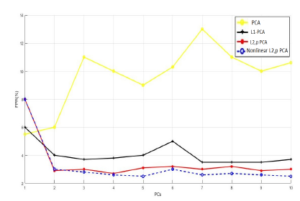
Figure 15: Principal Components vs. False positive rate for NSL-KDD.
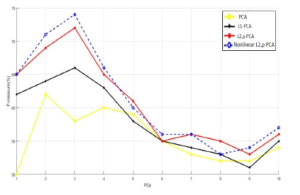
Figure 16: Principal Components vs. F-measure for NSL-KDD.
When we have performed identical experiment on NSL-KDD dataset, as it is clear from the Figures 14 and 16 that the new approach ensure improved rates of DR and F-measure over the linear PCA algorithm. For the false positive rate, as illustrated in the Figure 15, the proposed method has fewest false positive rate starting from the third principal component.
In the fourth simulation, we computed the amount of time consumed by each algorithm for both datasets. From figures 17 and 18, we observe that for both dataset the amount of time (CPU time) required is increasing proportionally as the principal components PCs number is increasing for all techniques. The only difference is that the suggested technique is a little more computationally speedy than the other algorithms which is expected.
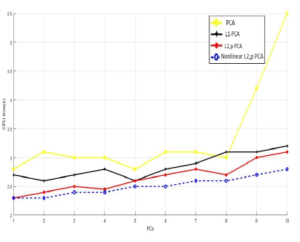
Figure 17: Principal Components vs. CPU time (s) for KDDCup99 database.
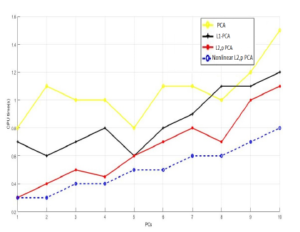
Figure 18: Principal Components vs. CPU time (s) for NSL-KDD database.
To get further insights about the effectiveness of the proposed approach, we carried an experiment where we calculated the detection rates for every single attack category for the aforementioned PCA variants as well as the proposed approach. We can observe clearly in Table 1 and Table 2 that the proposed technique outperform the others variants in identifying attacks for the KDDCup99 and NSL-KDD datasets.
Table 1: Attacks Detection Rate for PCA, L1-PCA, `2,p-norm PCA and Nonlinear `2,p-norm PCA for KDDCup99 dataset.
| Method | DOS | U2R | R2L | Probing | |
| DR(%) | PCA | 68,7656 | 8,7329 | 4,7734 | 92,1342 |
| L1-PCA | 72,3478 | 15,4635 | 4,1315 | 91,4325 | |
| `2,p-norm PCA | 74,9319 | 16,8951 | 4,1111 | 92,8325 | |
| Nonlinear `2,p-norm PCA | 76,5314 | 17,0132 | 4,6783 | 94,1311 |
Table 2: Attacks Detection Rate for PCA, L1-PCA, `2,p-norm PCA and Nonlinear `2,p-norm PCA for NSL-KDD dataset.
| Method | DOS | U2R | R2L | Probing | |
| DR(%) | PCA | 67,6656 | 7,6319 | 4,6623 | 91,1142 |
| L1-PCA | 71,3468 | 14,3525 | 4,1214 | 90,3215 | |
| `2,p-norm PCA | 73,8219 | 15,9715 | 4,0123 | 91,7523 | |
| Nonlinear `2,p-norm PCA | 74,3441 | 16,1023 | 4,7738 | 93,1125 |
6. Conclusion
In the current paper, we suggest a nonlinear variant of the `2,p-norm based PCA, the suggested algorithm showed significant improvements compared to the original one. In addition, integrating nonlinear `2,p-norm based PCA into our intrusion detection system (IDS) makes the prior more efficient and powerful against outliers. As we showed earlier, experiments on the popular datasets KDDcup99 & NSL-KDD demonstrate that the nonlinear `2,p-norm PCA outperforms and show its superiority over PCA, L1-PCA and the original variant `2,p-norm PCA. In the future works, we will attempt to test our IDS on recent datasets and and develop other variants of `2,p-norm PCA.
Conflict of Interest
The authors declare no conflict of interest.
Acknowledgment
This work is supported by CNRSTMOROCCO under the excellence program, grant no. 15UIT2016.
- D. E. Denning, “An intrusion-detection model”, IEEE Transactions on soft- ware engineering, (2), 1987, 222–232, doi:10.1109/TSE.1987.232894, URL http://dx.doi.org/10.1109/TSE.1987.232894.
- L. Portnoy, L. Esking, S. Stolfo, “Intrusion detection with unlabeled data us- ing clustering [CJ//Proc of ACM CSS Workshop on Data mining Applied to Security (DMSA-2001)”, 2001.
- M. Ringne´r, “What is principal component analysis?”, Nature biotechnology, 26(3), 2008, 303, doi:10.1038/nbt0308-303, URL http://dx.doi.org/10. 1038/nbt0308-303.
- I. T. Jolliffe, J. Cadima, “Principal component analysis: a review and recent de- velopments”, Philosophical Transactions of the Royal Society A: Mathematical, Physical and Engineering Sciences, 374(2065), 2016, 20150202, doi:10.1098/ rsta.2015.0202, URL http://dx.doi.org/10.1098/rsta.2015.0202.
- R. O. Duda, P. E. Hart, D. G. Stork, Pattern classification, John Wiley & Sons, 2012.
- D.-Q. Dai, P. C. Yuen, “Face recognition by regularized discriminant analy- sis”, IEEE Transactions on Systems, Man, and Cybernetics, Part B (Cyber- netics), 37(4), 2007, 1080–1085, doi:10.1109/TSMCB.2007.895363, URL http://dx.doi.org/10.1109/TSMCB.2007.895363.
- H. Li, T. Jiang, K. Zhang, “Efficient and robust feature extraction by maximum margin criterion”, in Advances in neural information processing systems, 2004, 97–104.
- B. Scho¨ lkopf, A. Smola, K.-R. Mu¨ ller, “Nonlinear component analysis as a kernel eigenvalue problem”, Neural computation, 10(5), 1998, 1299–1319, doi:10.1162/089976698300017467, URL http://dx.doi.org/10.1162/ 089976698300017467.
- Y. Koren, L. Carmel, “Robust linear dimensionality reduction”, IEEE trans- actions on visualization and computer graphics, 10(4), 2004, 459–470, doi: 10.1109/TVCG.2004.17, URL http://dx.doi.org/10.1109/TVCG.2004. 17.
- X. Wu, J. Zhou, “Fuzzy principal component analysis and its Kernel- based model”, Journal of Electronics (China), 24(6), 2007, 772–775, doi:10.1007/s11767-006-0039-z, URL http://dx.doi.org/10.1007/ s11767-006-0039-z.
- S.-l. Xu, Q.-j. Zhang, “Gait recognition using fuzzy principal component anal- ysis”, in 2010 2nd International Conference on E-business and Information System Security, IEEE, 2010, 1–4, doi:10.1109/EBISS.2010.5473671, URL http://dx.doi.org/10.1109/EBISS.2010.5473671.
- C. Sarbu, H. Pop, “Principal component analysis versus fuzzy principal com- ponent analysis: a case study: the quality of Danube water (1985–1996)”, Talanta, 65(5), 2005, 1215–1220, doi:10.1016/j.talanta.2004.08.047, URL http://dx.doi.org/10.1016/j.talanta.2004.08.047.
- A. Hadri, K. Chougdali, R. Touahni, “Intrusion detection system using PCA and Fuzzy PCA techniques”, in 2016 International Conference on Advanced Communication Systems and Information Security (ACOSIS), IEEE, 2016, 1–7, doi:10.1109/ACOSIS.2016.7843930, URL http://dx.doi.org/10.1109/ ACOSIS.2016.7843930.
- I. T. Jolliffe, N. T. Trendafilov, M. Uddin, “A modified principal compo- nent technique based on the LASSO”, Journal of computational and Graph- ical Statistics, 12(3), 2003, 531–547, doi:10.1198/1061860032148, URL http://dx.doi.org/10.1198/1061860032148.
- S. Yan, D. Xu, B. Zhang, H.-J. Zhang, Q. Yang, S. Lin, “Graph embedding and extensions: A general framework for dimensionality reduction”, IEEE transactions on pattern analysis and machine intelligence, 29(1), 2006, 40– 51, doi:10.1109/TPAMI.2007.250598, URL http://dx.doi.org/10.1109/ TPAMI.2007.250598.
- X. He, P. Niyogi, “Locality preserving projections”, in Advances in neural information processing systems, 2004, 153–160.
- X. He, D. Cai, S. Yan, H.-J. Zhang, “Neighborhood preserving embedding”, in Tenth IEEE International Conference on Computer Vision (ICCV’05) Vol- ume 1, volume 2, IEEE, 2005, 1208–1213, doi:10.1109/ICCV.2005.167, URL http://dx.doi.org/10.1109/ICCV.2005.167.
- M. Belkin, P. Niyogi, “Laplacian eigenmaps for dimensionality reduction and data representation”, Neural computation, 15(6), 2003, 1373–1396, doi:10.1162/089976603321780317, URL http://dx.doi.org/10.1162/ 089976603321780317.
- S. T. Roweis, L. K. Saul, “Nonlinear dimensionality reduction by locally lin- ear embedding”, science, 290(5500), 2000, 2323–2326, doi:10.1126/science. 290.5500.2323, URL http://dx.doi.org/10.1126/science.290.5500. 2323.
- G. Liu, Z. Lin, Y. Yu, “Robust subspace segmentation by low-rank representa- tion.”, in ICML, volume 1, 2010, 8.
- N. Kwak, “Principal component analysis based on L1-norm maximization”, IEEE transactions on pattern analysis and machine intelligence, 30(9), 2008, 1672–1680, doi:10.1109/TPAMI.2008.114, URL http://dx.doi.org/10. 1109/TPAMI.2008.114.
- Q. Ke, T. Kanade, “Robust L/sub 1/norm factorization in the presence of out- liers and missing data by alternative convex programming”, in 2005 IEEE Computer Society Conference on Computer Vision and Pattern Recognition (CVPR’05), volume 1, IEEE, 2005, 739–746, doi:10.1109/CVPR.2005.309, URL http://dx.doi.org/10.1109/CVPR.2005.309.
- R. He, B.-G. Hu, W.-S. Zheng, X.-W. Kong, “Robust principal component analysis based on maximum correntropy criterion”, IEEE Transactions on Image Processing, 20(6), 2011, 1485–1494, doi:10.1109/TIP.2010.2103949, URL http://dx.doi.org/10.1109/TIP.2010.2103949.
- Y. Wang, V. I. Morariu, L. S. Davis, “Unsupervised feature extraction inspired by latent low-rank representation”, in 2015 IEEE Winter Conference on Applica- tions of Computer Vision, IEEE, 2015, 542–549, doi:10.1109/WACV.2015.78, URL http://dx.doi.org/10.1109/WACV.2015.78.
- F. De La Torre, M. J. Black, “A framework for robust subspace learning”, Inter- national Journal of Computer Vision, 54(1-3), 2003, 117–142, doi:10.1023/A: 1023709501986, URL http://dx.doi.org/10.1023/A:1023709501986.
- A. Y. Ng, “Feature selection, L 1 vs. L 2 regularization, and rotational in- variance”, in Proceedings of the twenty-first international conference on Machine learning, ACM, 2004, 78, doi:10.1145/1015330.1015435, URL http://dx.doi.org/10.1145/1015330.1015435.
- C. Ding, D. Zhou, X. He, H. Zha, “R 1-PCA: rotational invariant L 1-norm prin- cipal component analysis for robust subspace factorization”, in Proceedings of the 23rd international conference on Machine learning, ACM, 2006, 281– 288, doi:10.1145/1143844.1143880, URL http://dx.doi.org/10.1145/ 1143844.1143880.
- F. Nie, J. Yuan, H. Huang, “Optimal mean robust principal component analy- sis”, in International conference on machine learning, 2014, 1062–1070.
- Q. Wang, Q. Gao, X. Gao, F. Nie, “l2,p-Norm Based PCA for Image Recog- nition”, IEEE Transactions on Image Processing, 27(3), 2017, 1336–1346, doi:10.1109/TIP.2017.2777184, URL http://dx.doi.org/10.1109/TIP. 2017.2777184.
- K. Cup, “Data/The UCI KDD Archive, Information and Computer Science”, University of California, Irvine, 1999.
- M. Tavallaee, E. Bagheri, W. Lu, A. A. Ghorbani, “A detailed analysis of the KDD CUP 99 data set”, in 2009 IEEE Symposium on Computa- tional Intelligence for Security and Defense Applications, IEEE, 2009, 1–6, doi:10.1109/CISDA.2009.5356528, URL http://dx.doi.org/10.1109/ CISDA.2009.5356528.
- K. Cup, “Available on: http://kdd. ics. uci. edu/databases/kddcup99/kddcup99. html”, 2007.
- L. Dhanabal, S. Shantharajah, “A study on NSL-KDD dataset for intrusion detection system based on classification algorithms”, International Journal of Advanced Research in Computer and Communication Engineering, 4(6), 2015, 446–452, doi:10.17148/IJARCCE.2015.4696, URL http://dx.doi.org/10. 17148/IJARCCE.2015.4696.
- X. Zong, Y. Sun, K. He, “Intrusion detection based on traffic research and application in Industrial Control System”, 2018.
- M. Kirby, L. Sirovich, “Application of the Karhunen-Loeve procedure for the characterization of human faces”, IEEE Transactions on Pattern analysis and Machine intelligence, 12(1), 1990, 103–108, doi:10.1109/34.41390, URL http://dx.doi.org/10.1109/34.41390.
- Y. Bouzida, F. Cuppens, N. Cuppens-Boulahia, S. Gombault, “Efficient intru- sion detection using principal component analysis”, in 3e´me Confe´rence sur laaux (SAR), La Londe, France, 2004, 381–395.