Warehouse Relocation of a Company in the Automotive Industry Using P-median
 , Garzón-Garnica, Eduardo Arturo, Cante-Mota, Román, Olmos-Álvarez, Fernando, Martinez-Flores, José Luis, Sánchez-Partida, Diana
Adv. Sci. Technol. Eng. Syst. J. 5(3), 576–582 (2020);
 DOI: 10.25046/aj050372
To have enough information on time can be helpful when companies try to reduce costs and operate more efficiently. An international company that supplies parts for the automotive industry is currently testing its new facilities in Mexico. The relocation of the raw materials and finished goods warehouses were tested using a P-Median model. The operating costs and risk factors were included in the model to provide a better solution and improve the operation of the warehouses and production lines. The research results compared different scenarios and indicated that the proposed better location isolates the forklift routes, mainly for finished products, and minimizes the cost of moving both raw materials and finished products to and from warehouses.
1. Introduction
The logistics activities have always been important for companies, because they represent various concepts, principles, and methods of different areas, like marketing, production, accounting, warehouse management, among others. With logistics, the chain value for the customers is increased, as well as for suppliers and stakeholders. An efficient logistics management could represent a decrease in costs, and continuous improvement in production [1].
In a warehouse, typically products arrive packaged and the warehouse personnel reorganizes, classifies, sorts and repackages such products. This function is of vital importance in any warehouse because it is needed to break down large chunks of products and redistribute them in small quantities. So, the supply chain is the sequence of the different processes in the organization within which the products move from their origin toward the customers [2].
In this paper, we propose a solution to a warehouse problem of a company in the automotive industry, using a p-median model to minimize the travel distance from the warehouses to all of the production stations.
2. Research objectives and research methodology
2.1. Research Objectives
This document aims to implement the p-median problem modeling with Lingo® software, which is a tool designed to solve linear, nonlinear, integer, stochastic, and optimization programming models as well as concentrate and model exact algorithms. It is done to explain the company’s problems and decrease risk in the industrial process to obtain an exact solution that does not require model validation.
2.2. Research Methodology
The research methodology adopted for the research work has been represented as a theoretical concept. The application of the mathematical model is based on the p-median problem. Such a problem has been implemented in several documents, and by different authors, as cited in the literature review. Such literature review is based on studies carried out with the application of exact algorithms using the p-median problem as the basis.
The following criteria were used to select the literature:
- Literature published on risk industries, supply chain, and cases of study using the p-median problem.
- Literature published from 1975 to 2017.
- Articles published in refereed scholarly journals, working papers, and thesis.
- Journals explain p-median problem algorithms in their editorial scope
- Keywords used in the article: risk, logistics, p-median, risk management
3. Literature Review
In [3] it is mentioned that the p-median problem is useful to model many real-world situations such as the location of public or industrial facilities, warehouses, and others. The p-median problem differs from the Uncapacitated Facility Location Problem in two respects:
- There are no costs for opening facilities
- There is an upper bound on the number of facilities that should be opened.
It models the problem of finding a minimum cost clustering and belongs to the class of NP-hard problems.
In [4], a set L of m facilities (or location points), a set U of n users (or customers or demand points), and a n x m matrix D with the distances traveled (or costs incurred) dij for satisfying the demand of the user located at i from the facility located at j, for all and are considered. The objective is to minimize the sum of these distances or transportation costs.
∑ (i ∈ U) m j ∈ J dij
Where and |J| = p. The p-median can be defined as a purely mathematical problem: given an n x m matrix D, select p, columns, or D so that the sum of minimum coefficients in each line within these columns is the smallest possible.
The p-median can also be interpreted in terms of cluster analysis; locations of users are then replaced by points in an m-dimensional space [5].
Besides this combinatorial formulation, the p-median is also an integer programming problem. Let us define two sets of decision variables: (i) yj = 1 if a facility is opened in , and 0, otherwise; (ii) xij = 1, if customer i is served from a facility located in , and 0, otherwise. Then the integer programming formulation is as follows:
minimize =∑ ni * ∑ mj dij xij (1)
Subject to
∑nj xij =1, ∀I (a)
xij ≤ yj, ∀ i,j (b)
∑mj yj = p, (c)
xij,yj,∈{0,1} (d)
The objective function of the p-median model seeks to minimize the sum of the distances dij for each client. Constraint (a) is the one that assures that each client is assigned to a facility. Constraint (b) makes sure that each client is attended by precisely one server. Constraint (c) indicates that p facilities should be assigned. Equation (d) indicates that the total number of open facilities is set to p by constraint.
The research in [6] shows that the academic research on safety in logistics has mainly focused on transportation, and in particular, on safety concerning motor carriers [7]. Among others, studies research characteristics of professional drivers (e.g., personality, health, attitude), stress factors they face (time pressure, fatigue, stress) and how these relate to safety behavior and/or accidents [8], [9], [10], [11], [12]. Recently, warehouse safety has started to gain attention. For instance, In [13] it is analyzed which factors impact warehouse safety.
In addition, in [14] it is mentioned that the risk in an environment is very significant [15], and the companies that measure it are characterized by several risk factors. The term supply chain vulnerability [16] has been used to describe the dependence and risks that exist among organizations as they rise to the challenge of better, faster, cheaper. Two aspects connected to the risk assessment in supply chains can be found:
1) Risk exists inside the company and at the network level.
2) Risk evaluation is subjective because each people perceives differently a risk and the nature of the upstream and downstream relationships of such risk.
According to [17], the success of risk management will be based on the understanding of various categories of risks, that affect projects in an organization. Achieve an analysis of their mutual dependence, categorize them according to their importance, and develop strategies for risk management based on prioritization.
The physical risk can be further measured in terms of the potential damages in physical spaces such as warehouses and production lines. These measures, called physical risk indexes, are derived from inspection procedures by external experts. The risk measures are monitored from both the logistics and supply chain perspective and the top-management control perspective [18]. Furthermore, in the supply chain the objectives are considered in terms of the organization’s goals concerning the final customer. Thus, the risk evaluation, in terms of weights and importance of indicators, should be guided by an awareness of the nature and importance of the market objectives [14].
4. Problem Description
An International Company of the Automotive Industry has a facility in Mexico; its primary purpose is the manufacturing of automotive cooling components, like radiators and heat exchangers. Currently, this company has only one production line in its planning stage. Their forecasted demand is very significant, and it is expected to grow further. Therefore, they will require a total of four production lines. The design of such lines is already available, as well as the preliminary data of the required and projected production levels.
The raw materials warehouse, as well as the finished goods warehouse, are currently operating on a small scale, working only at floor level, without racks. As the plant is not yet operating in full production mode, it is still possible to relocate the materials and finished goods warehouses, to a certain extent.
The cost of relocating the warehouse; at this stage, is minimal because production lines are not yet established. Still, not all of the building’s spaces can be used for warehouses, as power, gas, water, and overhead lines for production lines are already established, close to the places where the machines would be installed.
The use of the current layout, or relocation to a new position within the plant, should consider the operating cost of the warehouses, but also the risk that comes with the location of those warehouses. If materials must be carried through the plant using a forklift, the cost is higher than if a manual cart can be used. Nevertheless, when using a cart, if the warehouse operators must cross the forklift’s pathway, there is a higher risk of an accident happening than if the route is free of such crossings. The risk of damaging finished goods with the forklift, or by crossing its roads, is also noted. The relationship between cost and risk should then be considered for the solution.
The company leases its forklifts, so the cost of ownership does not change whether they are used or not, except for the cost of fuel. If the distance traveled by the forklift can be kept small enough to meet the need for full production with the fewest number of forklifts, some savings can be made by that means. A shorter distance traveled by the forklift could mean that all production lines are serviced by just one forklift, saving on the fixed cost of the rent.
5. Methods and Procedures
The problem for this company was modeled as a p-median problem, using a distance matrix calculated from the warehouses to each production station.
The distances were computed as follows:
A map of the whole plant was used as a base, and divided, on the scale, to a square grid of 1 meter by side. The location of each working station, and those of the existing warehouses were marked in the map
The possible alternate locations of the warehouses were selected simply by finding the spaces within the plant that were currently not in use, and where the warehouses would fit. Such a method resulted in three possible locations for the warehouses, with little or no movement of the production lines from the current plant layout.
The distance from the warehouse entrance, in each of the proposed locations, to each one of the working stations, whether current or projected, was computed by counting the meters in the map, as if the cart or forklift would have traversed the route from the warehouse to the working station. The same process was done for the reception of raw materials and the finished goods.
If one of the warehouses proposed locations required the relocation of one or more production lines, each one of the distances was computed again, considering the new location of the production lines and warehouses.
As stated, three different scenarios were found possible, and those were evaluated to obtain a comparison against the current situation. The first scenario is the current situation. The second one involves moving the raw materials warehouse to a top-right position, in a space currently unused. The third scenario considers moving the raw materials warehouse to a down-center position, very close to the place where the production lines start, but this last scenario involves the location of the two middle production lines, a few meters offset to the top. Still, those production lines were not operating yet, so a small relocation was still possible.
The considerations to the problem at hand are as follows:
- The cost of relocating the warehouses is minimal, because there is no hardware, like racks, in the warehouse at this point.
- Although production lines 2-4 are not yet set up, some of the needed infrastructures are already prepared. It prevents such lines from being set anywhere. They must remain close to the originally intended position.
- Forklift streets, walkways, isles, etc., can be relocated easily. However, there is no unlimited space.
- If possible, all personnel should avoid crossing, or walking through, forklift pathways. Warehouse operators, pushing a cart with raw materials or finished goods, should also avoid, as much as possible, to cross or traverse forklift routes.
Figure 1 shows the current layout of the plant, including only one production line, which is the current state of the company. However, they foresee the need to upscale their production levels to a full mode, needing four lines, in at most two years from now.
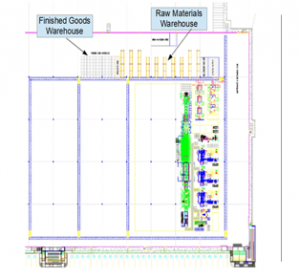
Figure 1. Current layout with only one production line.
Figure 2 shows the possible layout of the plant when all four lines are in place, considering the current location of both the raw materials and finished goods warehouses. Two possible alternatives to the warehouse location have been found in the current plant layout.
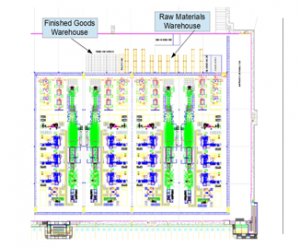
Figure 2. Current layout with no change in the warehouse locations.
Figure 3 shows the possible layout with all four lines in place, but with the warehouses relocated to a place currently unused in the plant, without the need to relocate any of the production lines.
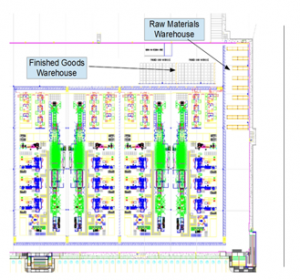
Figure 3. Proposed layout with warehouses in the top right corner.
A third possible scenario relocates the raw materials warehouse to a location very close to the start of all four production lines but needs the location of the two center lines to be moved a little. Figure 4 shows the possible layout of this scenario.
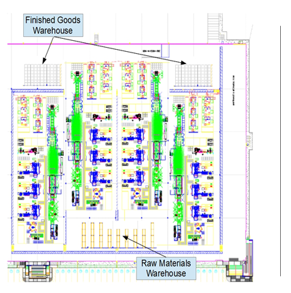
Figure 4. Proposed layout with raw materials warehouse in the bottom center.
6. Data Acquisition and Preparation
The primary way to compute the cost was to obtain the distance from the warehouses to each working station. More distance traveled means the operator would take more time to carry the items, whether by forklift or by manual cart. It was considered that for one production run in each production line, one shipment of raw materials would be required for each working station.
Table 1: Extract of the data table.
| Raw Material 1 | Finished Goods 1 | Raw Material 2 | Finished Goods 2 | Raw Material 3 | Finished Goods 3 | ||||||||||||||
| Equipment | Distance | Risk | Forklift | Distance | Risk | Forklift | Distance | Risk | Forklift | Distance | Risk | Forklift | Distance | Risk | Forklift | Distance | Risk | Forklift | Arrival Factor |
| 0-Raw Material Receive | 17 | 0 | 1 | 0 | 0 | 0 | 47 | 0 | 1 | 0 | 0 | 0 | 121 | 0 | 1 | 0 | 0 | 0 | 1 |
| 1-Core Builder 1 | 62 | 1 | 1 | 0 | 0 | 0 | 34 | 1 | 1 | 0 | 0 | 0 | 70 | 1 | 1 | 0 | 0 | 0 | 0.033 |
| 1-Core Builder 2 | 54 | 1 | 1 | 0 | 0 | 0 | 26 | 1 | 1 | 0 | 0 | 0 | 78 | 1 | 1 | 0 | 0 | 0 | 0.033 |
| 1-Core Builder 3 | 46 | 1 | 1 | 0 | 0 | 0 | 18 | 1 | 1 | 0 | 0 | 0 | 86 | 1 | 1 | 0 | 0 | 0 | 0.033 |
| 1-Tube Mill | 38 | 1 | 1 | 0 | 0 | 0 | 10 | 1 | 1 | 0 | 0 | 0 | 94 | 1 | 1 | 0 | 0 | 0 | 0.125 |
| 1-Laser Welding | 78 | 1 | 0 | 0 | 0 | 0 | 51 | 1 | 1 | 0 | 0 | 0 | 65 | 1 | 0 | 0 | 0 | 0 | 0.125 |
| 1-Paint Flux | 83 | 1 | 0 | 0 | 0 | 0 | 56 | 1 | 0 | 0 | 0 | 0 | 58 | 1 | 0 | 0 | 0 | 0 | 0.125 |
| 1-Furnace | 0 | 0 | 0 | 0 | 0 | 0 | 0 | 0 | 0 | 0 | 0 | 0 | 0 | 0 | 0 | 0 | 0 | 0 | 0.125 |
| 1-Flame Brazing 1 | 14 | 0 | 0 | 0 | 0 | 0 | 21 | 1 | 0 | 0 | 0 | 0 | 129 | 1 | 0 | 0 | 0 | 0 | 0.125 |
| 1-Flame Brazing 2 | 18 | 0 | 0 | 0 | 0 | 0 | 16 | 1 | 0 | 0 | 0 | 0 | 135 | 1 | 0 | 0 | 0 | 0 | 0.125 |
| 1-Flame Brazing 3 | 23 | 0 | 0 | 0 | 0 | 0 | 12 | 1 | 0 | 0 | 0 | 0 | 141 | 1 | 0 | 0 | 0 | 0 | 0.125 |
| 1-EOL Pack 1 | 14 | 1 | 0 | 60 | 1 | 0 | 14 | 1 | 0 | 14 | 1 | 0 | 118 | 1 | 0 | 14 | 1 | 0 | 0.125 |
| 1-EOL Pack 2 | 18 | 1 | 0 | 64 | 1 | 0 | 9 | 1 | 0 | 18 | 1 | 0 | 112 | 1 | 0 | 18 | 1 | 0 | 0.125 |
| 1-EOL Pack 3 | 23 | 1 | 0 | 68 | 1 | 0 | 5 | 1 | 0 | 23 | 1 | 0 | 106 | 1 | 0 | 22 | 1 | 0 | 0.125 |
As stated, a grid was drawn over the map with the proposed layouts, with each square measuring approximately one meter. The same grid size was used for all the proposed locations. The distance within the warehouses was not computed, because currently there is not a definitive warehouse layout in place. The point of origin was set as the point within the warehouses closest to the forklift or cart roads, in the case of the current warehouse location, such point was the entrance of the warehouse. All the distances were then computed and stored in a single table. Each row in that table represents one working station of one production line. Each column represents one of the possible locations of both the raw materials and finished goods warehouses.
A column was added to each location to consider the cost if the type of material that has to be brought to the working station requires the use of a forklift, a value of 1 was added if the materials can be carried with a manual cart, or by hand, the value was 0. In the case of the risk, if the materials could be carried by hand or cart, but the route needed to cross the forklift pathways, a value of 1 was set.
Another value that had to be computed was the reception of the raw materials. This case had to also consider the cost of bringing the raw materials from the receiving docks to the warehouse. A modifier was added to transform this cost for each production round. The modifier consisted of the number of production lines that could be served with a single raw materials shipment. If an item arrives in a pallet containing 40 boxes, and three boxes would be needed for each production run, the modifier for that distance would be 3/40 boxes, or 0.075. Table 1 below shows an extract of the resulting data table, showing the risk, forklift, and arrival cost modifiers, as well as the distance computed for each scenario.
The model needed to include the risk and cost factors, apart from the distance from/to the warehouse. The model was modified to include those values as a weight. If a forklift works through all the shifts, and all of the weekdays, its cost is close to 8 times that of an employee. So, a cost factor of 8 to 1 is considered if the forklift is needed to bring raw material or finished goods to/from a working station. The risk of an accident would be considered to be 2 to 1, because, if an accident happens, the company would have to send the employee to the hospital, while paying his wages, and hiring an extra employee to cover for the recovery time.
Finally, the cost of receiving raw materials was also considered as the distance from the reception points to the raw materials warehouse. Shipments always arrive on pallets, so they must be moved with a forklift. However, as one pallet contains more than one box that could be sent to the production line, a factor was added, considering how many production orders could be fulfilled with that pallet for each working station. Two main factors were computed: For the Core Builder steps, one raw material shipment could cover 30 days’ worth of orders; for the other steps, each shipment would cover eight days. So, factors of 1/30th (0.033) and 1/8th (0.125) were added to the data table.
7. Formulation
It was decided to implement the mathematical model of the p-median problem because the objective of the model is to find the midpoint for a group of clients and their location, so it was extrapolated to a group of workers in a space delimited by the production lines.
A slight modification had to be made to include all those factors in the model. So that each distance would be modified by the risk, cost, and reception factors. The change was made locally, only by computing the cost factors (risk, forklift use, raw materials) and adding it to the main cost. In general, the model remains as a weighted p-median problem, just as the one found in the literature.
minimize ∑n(i=1) * ∑ m(j=1) xi * ((dij (1+ (Cf×Flij) + (Rf ×LCij)) +
RdiSfjCf + Fdij (1+Rf×FLCij+Cf×FFlij))) (2)
Subject to
∑n(i=1) xi =1 (a)
∀i∈{1..n} xi∈{1,0} (b)
∀i∈{1..n},∀j∈{1..m}Flij, LCij, FLCij, FFLij∈{1,0} (c)
Where
is the number of different options to choose from.
is the number of working stations or manufacturing steps.
is the cost factor of the forklift.
indicates if the materials for the working station must be carried with a forklift.
is the risk cost of crossing a forklift’s lane.
indicates if the path to the working station must cross or traverse a forklift’s lane.
is the travel distance from the warehouse to the working station.
is the distance from the reception point to the raw materials warehouse.
is the number of production runs that can be fed by a single pallet.
is the distance from the working station to the finished goods warehouse.
indicates if a forklift’s lane must be crossed with finished goods.
indicates if a forklift must be used for finished goods.
indicates if the option will be used.
Restriction (a) indicates that one option must be selected.
Restriction (b) states that xi can only have a value of 1 or 0.
Restriction (c) assures that FLij (Must use a Forklift), LCij (Lane Crossing), FLCij (Lane Crossing for Finished Goods), and FFLij (Use of Forklift for Finished Goods) have only a value of 1 or 0.
The model was coded using Lingo® and solved. The code is the following:
- Algorithm 1: LINGO ® Coded Model
- 1. Model:
- 2. Sets:
- Alternativa: Alt, Rd, x;
- Estaciones: WS, Sf;
- Arco(Alternativa,Estaciones):Dist, Fl, LC, FDist, FFl, FLC;
- EndSets
- 3. Data:
- Alt = @OLE(“C:\Tmp\WHR.xls”);
- Rd = @OLE(“C:\Tmp\WHR.xls”);
- WS = @OLE(“C:\Tmp\WHR.xls”);
- Sf = @OLE(“C:\Tmp\WHdR.xls”);
- Dist= @OLE(“C:\Tmp\WHR.xls”);
- Fl = @OLE(“C:\Tmp\WHR.xls”);
- LC = @OLE(“C:\Tmp\WHR.xls”);
- FDist=@OLE(“C:\Tmp\WHR.xls”);
- FFl = @OLE(“C:\Tmp\WHR.xls”);
- FLC = @OLE(“C:\Tmp\WHR.xls”);
- EndData
- min=@Sum(Alternativa(i):@Sum(Estaciones(j):x(i)* (Dist(i,j)*(1+(Cf *Fl(i,j))+(Rf*LC(i,j))))+(Rd(i) * Sf(i) * Cf ) + (FDist(i,j)*(1+ (Cf*FFl(i,j))+(Rf*FLC(i,j))))));
- Cf = 7;
- Rf = 2;
- @Sum(Alternativa(i): x(i) ) = 1;
- @For(Alternativa(i): @BIN(x(i)));
- @For(Alternativa(i): @For(Estaciones(j):
- @BIN( Fl(i,j) );
- @Bin(LC(i,j));
- @Bin( FFl(i,j));
- @Bin( FLC(i,j))
- ) );
- End
8. Results and Discussion
The model considered all the risk, cost, and incoming material cost modifiers. The solution obtained showed that the location that minimized the distance from the warehouse to each of the working stations was location number 2. An extract of the raw results obtained by solving the model is shown in table 2.
Table 2. Raw results of the model solver
| Variable | Value | Reduced Cost |
| CF | 7 | 0 |
| RF | 2 | 0 |
| ALT( 1) | 1 | 0 |
| ALT( 2) | 2 | 0 |
| ALT( 3) | 3 | 0 |
| RD( 1) | 17 | 0 |
| RD( 2) | 47 | 0 |
| RD( 3) | 121 | 0 |
| X( 1) | 0 | 22328 |
| X( 2) | 1 | 18161 |
| X( 3) | 0 | 26156 |
| WS( 1) | 1 | 0 |
| WS( 2) | 2 | 0 |
| WS( 3) | 3 | 0 |
| WS( 4) | 4 | 0 |
| WS( 5) | 5 | 0 |
| WS( 6) | 6 | 0 |
| WS( 7) | 7 | 0 |
| WS( 8) | 8 | 0 |
| WS( 9) | 9 | 0 |
| WS( 10) | 10 | 0 |
9. Conclusions and future research
Logistics within the factory add no value to the finished goods, but wrong logistic management can become costly if accidents happen, whether to people, to the facilities, or the finished goods. The proposed location isolates the forklift pathways, mostly for finished goods, and minimizes the cost of moving both raw materials and finished goods from and to the warehouses. It is expected that, even in full production mode, the need for forklifts is kept below the line that requires more than one device. It is also expected that the manual cart movement is reduced and that the crossing of forklift lanes is also kept at a minimum. Both the company and the authors expect that both the raw materials and the finished goods warehouses can be operated by only one operator, as well as the raw materials receiving process. It would, in turn, keep the operating costs at a level similar to the present, where test runs are being performed, but when in full production mode.
Future work in this area could include more general computing of the costs associated with each physical movement. Nevertheless, the company still needs improving in many areas, like minimizing idle time, reducing cooling and heating of the furnaces to make more efficient use of energy, thus reducing costs, optimizing the use of significant items, reducing even further the need to return big items to the raw materials warehouse, and reorganizing the items within each warehouse.
Conflict of Interest
The authors declare no conflict of interest.
- R. Ballou, Logística administración de la cadena de suministro. México: Pearson Educación de México, S. A. de C. V., 2004.
- J. Bartholdi and S. Hackman, “Allocating space in a forward pick area of a distribution center for small parts”, IIE Transactions, vol. 40, no. 11, pp. 1046-1053, 2008. https://doi.org/10.1080/07408170802167662.
- P. Mirchandani and R. Francis, “Discrete location theory”, Discrete Applied Mathematics, vol. 36, no. 1, pp. 93-94, 1992. https://doi.org/10.1016/0166-218x(92)90210-2.
- N. Mladenović, A. Alkandari, J. Pei, R. Todosijević and P. Pardalos, “Less is more approach: basic variable neighborhood search for the obnoxiousp-median problem”, International Transactions in Operational Research, vol. 27, no. 1, pp. 480-493, 2019. https://doi.org/10.1111/itor.12646.
- P. Hansen and B. Jaumard, “Cluster analysis and mathematical programming”, Mathematical Programming, vol. 79, no. 1-3, pp. 191-215, 1997. https://doi.org/10.1007/bf02614317.
- N. Hofstra, B. Petkova, W. Dullaert, G. Reniers and S. de Leeuw, “Assessing and facilitating warehouse safety”, Safety Science, vol. 105, pp. 134-148, 2018. https://doi.org/10.1016/j.ssci.2018.02.010.
- D. Cantor, “Workplace safety in the supply chain: a review of the literature and call for research”, The International Journal of Logistics Management, vol. 19, no. 1, pp. 65-83, 2008. https://doi.org/10.1108/09574090810872604.
- M. Douglas and S. Swartz, “A multi-dimensional construct of commercial motor vehicle operators’ attitudes toward safety regulations”, The International Journal of Logistics Management, vol. 20, no. 2, pp. 278-293, 2009. https://doi.org/10.1108/09574090910981341.
- M. Douglas and S. Swartz, “Career stage and truck drivers’ regulatory attitudes”, The International Journal of Logistics Management, vol. 27, no. 3, pp. 686-706, 2016. https://doi.org/10.1108/ijlm-11-2014-0180.
- R. Grytnes, H. Shibuya, J. Dyreborg, S. Grøn and B. Cleal, “Too individualistic for safety culture? Non-traffic related work safety among heavy goods vehicle drivers”, Transportation Research Part F: Traffic Psychology and Behaviour, vol. 40, pp. 145-155, 2016. https://doi.org/10.1016/j.trf.2016.04.012.
- E. Kemp, S. Kopp and E. Kemp, “Six days on the road”, The International Journal of Logistics Management, vol. 24, no. 2, pp. 210-229, 2013. https://doi.org/10.1108/ijlm-08-2012-0080.
- J. de Vries, R. de Koster, S. Rijsdijk and D. Roy, “Determinants of safe and productive truck driving: Empirical evidence from long-haul cargo transport”, Transportation Research Part E: Logistics and Transportation Review, vol. 97, pp. 113-131, 2017. https://doi.org/10.1016/j.tre.2016.11.003.
- R. de Koster, D. Stam and B. Balk, “Accidents happen: The influence of safety-specific transformational leadership, safety consciousness, and hazard reducing systems on warehouse accidents”, Journal of Operations Management, vol. 29, no. 7-8, pp. 753-765, 2011. https://doi.org/10.1016/j.jom.2011.06.005.
- B. Gaudenzi and A. Borghesi, “Managing risks in the supply chain using the AHP method”, The International Journal of Logistics Management, vol. 17, no. 1, pp. 114-136, 2006. https://doi.org/10.1108/09574090610663464.
- G. Zsidisin, “Managerial Perceptions of Supply Risk”, The Journal of Supply Chain Management, vol. 39, no. 1, pp. 14-26, 2003. https://doi.org/10.1111/j.1745-493x.2003.tb00146.x.
- G. Svensson, “A conceptual framework of vulnerability in firms’ inbound and outbound logistics flows”, International Journal of Physical Distribution & Logistics Management, vol. 32, no. 2, pp. 110-134, 2002. https://doi.org/10.1108/09600030210421723.
- R. Dandage, S. Mantha and S. Rane, “Strategy development using TOWS matrix for international project risk management based on prioritization of risk categories”, International Journal of Managing Projects in Business, vol. 12, no. 4, pp. 1003-1029, 2019. https://doi.org/10.1108/ijmpb-07-2018-0128.
- Kirk, D.L., “Enforcement time nears for German Law,” Business Insurance, Vol. 33 No. 36, pp. 19-20, 1999.