Monte Carlo Estimation of Dose in Heterogeneous Phantom Around 6MV Medical Linear Accelerator
 , Mohamed Reda Mesradi 1, Redouane El Baydaoui 1, Ahmed Bannan 1, Abdennacer Ait Ayoub 2, Kamal Saidi 1, Saad Elmadani 1
Adv. Sci. Technol. Eng. Syst. J. 5(3), 478–486 (2020);
 DOI: 10.25046/aj050359
In this work, we completed a validation of the Varian Clinac IX equipped with the High Definition Multi-Leaf Collimator (HD 120 MLC) instead of the removable jaws, using GATE Monte Carlo Platform version 8.2. We validated the multileaf collimator (MLC) geometry by simulating two dosimetric functions (Percentage Depth Dose (PDD) and Dose Profile (DP)), for 6MV photon beam energy and different field sizes (3×3, 4×4, 6×6, 8×8, 10×10, 12×12, 15×15, and 20×20 cm²). We then compared the results with measurements realized with two detectors, namely the cylindrical ionization chamber and the micro-diode PTW silicon. By applying the Relative Dose Difference method (RDD), we noted a less than 2% and 1% agreement for the field sizes (10×10, 12×12, 15×15, 20×20 cm²) and (3×3, 4×4, 6×6, 8×8 cm²) respectively. Moreover, to evaluate the relevance of Monte Carlo method in a heterogeneous media, particularly in small field sizes (1×1, 2×2, 3×3 cm²), we have simulated three clinical studies based on the Physical Test Objects (PTOs) that are the equivalent slabs of lung and bone included in a water phantom. We noticed that the simulated PDDs exhibit two significant irregularities in the interface between water and lung. To eliminate these phenomena, we have used the “setMaxStepSizeInRegion” parameter implemented in GATE. We also noticed an important difference of 5% corresponding to the small field sizes, between homogeneous and heterogeneous simulated PDDs. We used the RDD method in this case as well. Moreover, we observed a difference between 1-4% between the simulated PDDs and the calculated ones by ECLIPSE Treatment Planning System (TPS). These results indicate that GATE (8.2) is useful in dosimetry with heterogeneous situations as well such as bone and lung.
1. Introduction
In clinical radiotherapy, most TPS are calibrated in a homogeneous media with densities equal to 1. However, some organs have strong heterogeneities such as bone and lung. Hence a better precision requires a corrective dose in conventional TPS. In this context, Monte Carlo simulations present a real alternative allowing enhanced precision related to the transport of high energy photons, particularly in heterogeneous media. However, complex MC simulations require a great amount of computing resources and are time-consuming. Consequently, the optimization of the computation time is necessary. In our study, we used lung and bone equivalent slabs included in a water phantom as Physical Test Objects (PTOs).
Moreover, modern radiotherapy also uses complex beam shapes. For this purpose, we modeled a Varian Clinac IX 6MV photon beam energy with the High Definition Multi-Leaf Collimator (HD 120 MLC). This instrument can hold up to 120 pairs of leaves that move independently to allow the output of a complex beam shape. In practice, there are three types of MLCs, namely type A (e.g. Scanditronix and Siemens) [1], type B (e.g. Elekta) [2] and type C (e.g. Varian) [3]. The three are distinguished by their leaf’s size, speed of movement, and the transmission factor related to their arrangement and their geometry.
In this study, we have used the PTOs to evaluate the relevance of the MC method in the case of small radiation fields used in the context of small tumors. We realized this objective in two parts. In the first part, we have modeled a Varian Clinac IX 6MV photon beam energy to take into account the MLC based on our previous work [4] and using the geometric data provided by the manufacturer [3]. Thus, we compared the simulated dosimetric functions (PDD and DP) for different field sizes (3×3, 4×4, 6×6, 8×8, 10×10, 12×12, 15×15 and 20×20 cm²) to the measured ones using the RDD method [5]. In the second part, we have simulated three PTOs geometries (water+bone, water+lung, and water+bone+lung). Then we compared the PDDs of the heterogeneous media with the homogeneous ones. We also compared the simulated PDDs with the ones calculated by ECLIPSE TPS, based on the Anisotropic Analytic Algorithm (AAA). Finally, we’ve been interested in the optimization of the artefact phenomenon at the interfaces.
2. Material and Methods
2.1. Measurements including the HD 120 MLC
In this study, the Varian Clinac IX 6MV photon beam we used is equipped with the High-Definition Multi-Leaf Collimator (HD 120 MLC). PDD measurements were made at 100 cm of the Source Surface Distance (SSD), with a pitch of 0.1 mm in a depth between 0 and 5 cm in water and 1 mm for depths greater than 5 cm. In the case of DP, we chose 0.1 mm as a pitch in the penumbra region. In measurements with fields greater than or equal to 4x4cm² a cylindrical ionization chamber (Exradin type A28), with a volume of 0.125 cm3 was used, while for fields less than 4x4cm2, measurements were carried out using a micro-diode silicon detector PTW with a volume of 0.03 cm3 placed in a Doseview standard 3D solid water phantom of Standard Imaging.
2.2. HD 120 MLC modelling
The geometry and components materials of the HD 120 MLC have been implemented in GATE (V8.2) code using the manufacturer’s data [3]. It is formed by two blocks (A and B) that can hold 60 independent leaves oriented according to the Y-axis. Each block holds 28 external leaves «half leaves» (0.5 cm width) and 32 internal «quarter leaves» (0.25 cm width). They both are placed at 100 cm from the source [6,7]. Furthermore, the ends of the leaves are rounded with a 16 cm radius, their thickness is 6.9 cm and they are spaced from each other with a distance of 0.0047 cm.
The 32 internal leaves are positioned according to an alternative pattern (Figure 2): a drop with its fine end oriented towards the source (or “Target leaf”) then its neighbor whose fine end is oriented this time towards the isocenter of the accelerator (or «Isocenter leaf»), these two types of leaves differ by the distance tongue and groove which is worth 0.1 and 0.01 cm respectively to create a vertical play between the tongue of a leaf and the groove of the adjacent leaf [8].
Besides, in GATE (V8.2), we introduced four types of leaves (quarter isocenter, quarter target, half isocenter, and half target) (Figure 2). Which we located them at the origin of the marker placed in the entrance of the photon target. Then the leaves were repeated with the possibility of rotation and translation around their center and Y axis, and X, Y, and Z respectively. Figure 3 shows the GATE model of the Varian Clinac IX, including the HD 120 MLC [8].
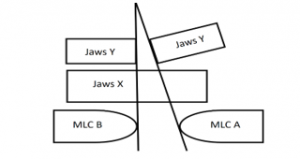
Figure 1: Varian Clinac MLC illustration
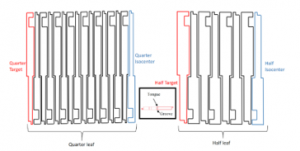
Figure 2: Schematic presentation of the HD 120 MLC, with Target and Isocenter leaf for each type
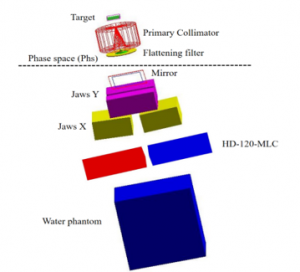
Figure 3: Varian Clinac IX accelerator head GATE modeled including the HD 120 MLC
On the other hand, in GATE (V8.2), the dosimetric functions (PDD and DP) corresponding to the different field sizes (3×3, 4×4, 6×6, 8×8, 10×10, 12×12, 15×15 and 20×20 cm²) were realized using the “DOSE ACTOR”. PDD was normalized at depth (Dmax) where the deposited dose is maximal. We compared the simulation results with those measured using the RDD method [6]. The latter consists of evaluating the relative dose difference between an experimental value and a theoretical reference value using equation 1. The dose difference should be less than 3% in the build-up region and less than 1% for most depths ranging from maximum dose depth (Dmax) to 30 cm. In equation 1, Dc is the calculated absorbed dose, and Dm is the measured dose (reference). Indeed, to obtained good statistic 9.109 particles were generated from a phase space (Phs) previously used as a source [4] and directed into a water phantom of the same size used in measurements.
![]()
Table 1: Material characteristics for lung and bone equivalent slabs
| Materials | Density (g/cm3) | Width (cm) | Composition (%) |
| Lung slab | 0.31 | 10 | H (8.31), C (60.08), N (2.71), O (23.04),
Mg(4.8), Cl(1.02) |
| Bone slab | 1.91 | 5 | H (3.30), C (25.37), N (0.91), O (35.28),
Mg(3.36), P (8.82), Cl(0.03), Ca(22.91) |
2.3. Heterogeneity Study
In this work, we conducted a study of heterogeneity using the two PTOs (lung and bone equivalent slabs). The three heterogeneous geometries studied are illustrated in Figure 4. The Phantom 1 includes a lung equivalent slab with a size of (30 x 30 x 10 cm3) placed at 5 cm from the entrance. The Phantom 2 contains a slab bone with a size of (30 x 30 x 5 cm3) placed at 5 cm. The Phantom 3 includes two slabs: bone and lung located at 5 cm and 10 cm respectively.
To evaluate the ability of GATE to predict the dose distribution in a heterogeneous media, we compared the simulated PDDs with the three phantoms with a homogenous one. This concern six different fields sizes (1×1, 2×2, 3×3, 10×10, 15×15 and 20×20 cm²). In GATE, the composition and the density of lung and bone equivalent slabs were given by the manufacturer (Table 1). We compared GATE results with the ones obtained with the ECLIPSE TPS by applying the RDD method. We note that we used the same GATE geometry in ECLIPSE and that calculations were performed using the AAA algorithm [9,10].
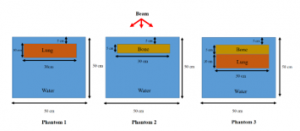
Figure 4: Two PTOs geometries using for three different studies
3. Results and Discussion
3.1. Static validation of the HD 120 MLC
Figures 5 and 6 show the simulated PDDs and DPs compared to those measured for the field sizes (3×3, 4×4, 6×6, 8×8, 10×10, 12×12, 15×15, and 20×20 cm²). Table 2 illustrates the results of this comparison. We note that the PDD results exhibit an agreement of less than 2% for the most points, while with the DP results the differences are around 1% in the build-up region and 2% outside. These simulations indicate that the accuracy with MLC is better than with the removable jaws used in our previous work [4].
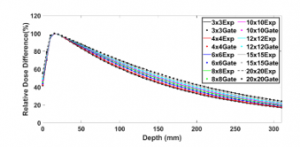
Figure 5: PDDs defined by the 120 HD MLC for different field sizes
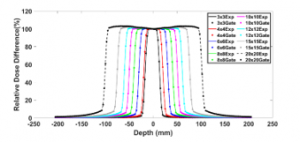
Figure 6: DPs defined by the 120 HD MLC for different field sizes
3.2. Heterogeneity study
- Artefact phenomenon
In the literature, few studies were interested in the artefact phenomenon observed in MC simulations at the boundary between two biological matters [11], for example between water and lung. For this purpose, we simulated the PDD using phantom 1. The results indicated two significant irregularities in the interface between water and lung (Figure 7). The “setMaxStepSizeInRegion” is the key factor for this phenomenon provided in GATE. It is defined as the maximal step size of charged particles. Thus, we performed simulations by varying this parameter within the range of 10-50 μm. Table 3 shows the calculation time for each value corresponding to a step of 10 μm. Adjusting the “setMaxStepSizeInRegion” with the recommended cutoff value [4], the two artefacts are gone.
Table 2: Average RDD between (PDD & DP) calculated and measured ones for different field sizes
| Field sizes (cm2) | RDD (%) | |
| PDD | DP | |
| 3×3 | 0.1666 | 0.1952 |
| 4×4 | 0.1836 | 0.1936 |
| 6×6 | 0.258 | 0.4256 |
| 8×8 | 0.3839 | 0.8934 |
| 10×10 | 0.5289 | 0.9612 |
| 12×12 | 0.7145 | 1.0142 |
| 15×15 | 0.9236 | 1.0958 |
| 20×20 | 1.0147 | 1.3541 |
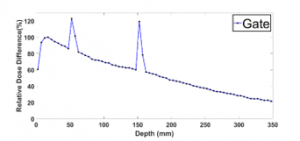
Figure 7: Artefact phenomenon in the boundaries between Water and Lung equivalent slab for 10×10 cm² field size
Table 3: CPU timing for “”setMaxStepSizeInRegion” values
| “setMaxStepSizeInRegion” value (μm) | CPU timing (h) |
| 10 | 30 |
| 20 | 20 |
| 30 | 48 |
| 40 | 53 |
| 50 | 59 |
- Heterogeneity study compared to homogenous one
In Figure 8, the fact that the lung has a weaker density, this doesn’t lead to any change in the PDD in region 1 therefore, the two PDD curves (water and water-lung) are almost identical for all field sizes studied in this region. In region 2, the photon’s attenuation is weaker, and the fact that in small fields (1×1, 2×2, and 3×3 cm²) there is almost no lateral electron equilibrium, lung PDDs are lower than the one in water. This electronic disequilibrium is due to the Compton effect [12]. Indeed, when the electron range produced by the Compton Effect is half of the field size, the electrons produced will transfer their energies outside the radiation field from where the electronic balance is lost. However, for a large field sizes (10×10, 15×15 and 20×20 cm²) the photons’ attenuation and the lateral electron equilibrium becomes significant. This is due to the field sizes increase, consequently, lung PDDs become relatively higher than the ones in the water. Indeed, in region 3, the fact that for all field sizes, the PDDs in the lung are relatively higher than ones in the water, is mainly due to the lower density of lung in region 2.
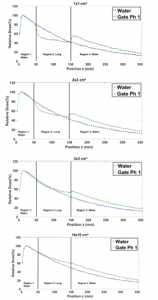
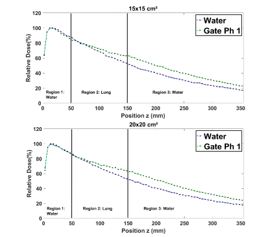
Figure 8: Comparison between the PDD in a homogenous phantom with phantom 1 for 1×1, 2×2, 3×3, 10×10, 15×15 and 20×20 cm² field sizes.
Figure 9 shows that in region 1, for all field sizes the presence of bone seems to not affect the PDDs curves. In region 2, although bone has a higher attenuation coefficient, the related PDDs seem to be relatively weaker than the ones in the water. This is observed for all field sizes, owing to the Compton scattering effect [12]. Indeed, in region 3, the higher attenuation coefficient of bone in region 2, makes that PDDs in bone are still relatively weaker than the ones in water for all field sizes.
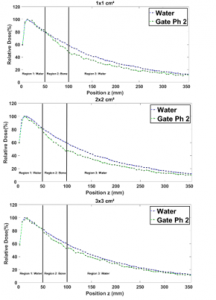
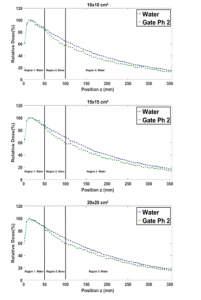
Figure 9: Comparison between the PDD in a homogenous phantom with phantom 2 for 1×1, 2×2, 3×3, 10×10, 15×15 and 20×20 cm² field sizes.
Figure 10 shows that in region 1 the two PDDs curves are almost identical, despite the presence of the two bone and lung slabs. In regions 2 and 3, the related PDDs seem to be relatively weaker than the ones in the water, owing to the Compton scattering effect and the low density of lung. This is observed for all field sizes. In region (4) the fact that for all field sizes, the PDDs in the presence of lung and bone are relatively higher than the ones in water alone, results primarily to the low density of lung in region 3.
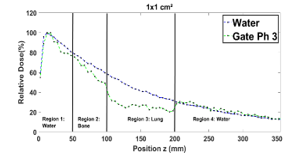
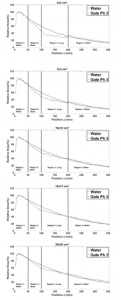
Figure 10: Comparison between the PDD in a homogenous phantom with phantom 3 for 1×1, 2×2, 3×3, 10×10, 15×15 and 20×20 cm² field sizes.
- Heterogeneity comparison study between GATE and ECLIPSE (AAA)
Figure 11 shows that the PDDs obtained by ECLIPSE and GATE from Phantom 1 are in general closely similar with a difference less than 1%, except for the 1×1 cm² field where ECLIPSE PDD exceeds GATE by 4.02%. This can be explained by the fact that ECLIPSE does not take into account the lateral electronic equilibrium in lung slab for very small fields. Table 4 presents the average RDD of the PDDs calculated by ECLIPSE and simulated by GATE for Phantom 1.
Table 4: Average RDD between GATE and ECLIPSE (AAA) PDDs for different field sizes in phantom 1
| Field sizes (cm²) | RDD (%) |
| 1×1 | 4.02 |
| 2×2 | 0.83 |
| 3×3 | 1.27 |
| 10×10 | 1.68 |
| 15×15 | 0.53 |
| 20×20 | 0.63 |
Figure 12 shows that in region 1, the PDDs obtained from Phantom 2, are in general closely similar for all field sizes. In region 2, we note a difference of 1 to 5% explained by the fact that ECLIPSE overestimates the energy deposited by secondary electrons in bone slab [13]. Table 5 presents the average RDD of the PDDs for Phantom 2.
Table 5: Average RDD between GATE and ECLIPSE (AAA) PDDs for different field sizes in phantom 2
| Field sizes (cm²) | RDD (%) |
| 1×1 | 0.26 |
| 2×2 | 1.31 |
| 3×3 | 2.31 |
| 10×10 | 4.08 |
| 15×15 | 4.03 |
| 20×20 | 3.75 |
Figure 13 shows that in region 1, the PDDs obtained from Phantom 2, are in general closely similar for all field sizes. In region 2, for small field sizes, ECLIPSE PDDs exceed the GATE ones by more than 4%. This is because ECLIPSE overestimates the energy deposited by secondary electrons in bone slab [13]. On the other hand, for field sizes greater than or equal to (10×10 cm²) the deference is 2%, owing to the presence also of lung in region 3. Table 6 presents the average difference for PDDs calculated and measured by applying the RDD method.
Table 6: Average RDD between GATE and ECLIPSE (AAA) PDDs for different field sizes in phantom 3
| Field sizes (cm²) | RDD (%) |
| 1×1 | 4.23 |
| 2×2 | 4.59 |
| 3×3 | 3.61 |
| 10×10 | 2.00 |
| 15×15 | 1.91 |
| 20×20 | 1.74 |
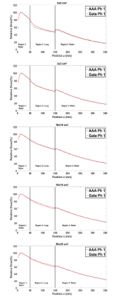
Figure 11: Comparison between GATE and ECLIPSE (AAA) PDDs in phantom 1 for 1×1, 2×2, 3×3, 12×12, 15×15 and 20×20 cm² field sizes.
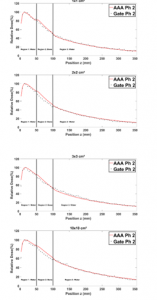
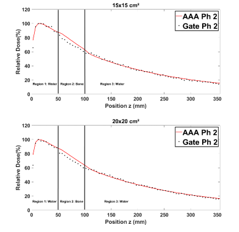
Figure 12: Comparison between GATE and ECLIPSE (AAA) PDDs in phantom 2 for 1×1, 2×2, 3×3, 12×12, 15×15 and 20×20 cm² field sizes.
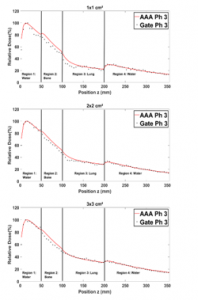
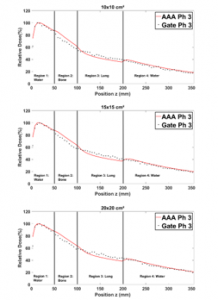
Figure 13: Comparison between GATE and ECLIPSE (AAA) PDDs in phantom 3 for 1×1, 2×2, 3×3, 12×12, 15×15 and 20×20 cm² field sizes.
4. Conclusion
In addition to our previous work, in this study, we successfully used the up-to-date version of GATE 8.2 to simulate the High Definition Multi-Leaf Collimator (HD 120 MLC) using the manufacturers’. We performed the MLC validation by comparing the dosimetric functions (PDD and DP) measured in a water phantom with those simulated for different field sizes using, the relative dose difference method (RDD). Results show an agreement of less than 2% between simulated and measured functions. On the other hand, we demonstrated by using three studies based on the Physical Test Object (PTOs), the capacity of GATE 8.2 code to reproduce the dosimetric function in heterogeneous media such as lung and bone. Moreover, we showed that GATE exceeds ECLIPSE in the assessment of dose in heterogeneous media, since the latter does not take into account the lateral electronic disequilibrium. Indeed, the optimization of the “setMaxStepSizeInRegion” parameter in GATE led to eliminate the phenomenon of artefact in the interface between lung and bone. In conclusion, the static validation of our MLC 120 HD model, as well as the results of the dose distribution in heterogeneous media will lead us in future research for a dynamic validation to test the feasibility of the clinical application of the Monte Carlo simulations.
Conflict of Interest
We declare that we have no conflict of interest.
- AAPM. Basic applications of multileaf collimators. report of the AAPM radiation therapy committee Task Group No 50 AAPM Report No 72 (Madison, WI: American Institute of Physics by Medical Physics Publishing). 2001.
- Heath, E, Seuntjens, J. Development and validation of a BEAMnrc component module for accurate Monte Carlo modelling of the Varian dynamic Millennium multileaf collimator. Phys Med Biol 2003;48(24):4045-4063. https://doi.org/10.1088/0031-9155/48/24/004
- Michael K. Fix, Werner Volken, Daniel Frei, Daniel Frauchiger, Ernst J. Born and Peter Manser, Monte Carlo implementation, validation, and characterization of a 120 leaf MLC. Med. Phys., 38(10) : 5311-5320, 2011. https://doi.org/10.1118/1.3626485
- Z. Aitelcadi, A. Bannan, R. El baydaoui, MR. Mesradi, A. Halimi, S. Elmadani, Feasibility of external radiotherapy dose estimation in homogenous phantom using monte carlo modeling. JATIT, 98(8) :1151-1162, 2020.
- Cho S.H., Vassiliev O.N., Lee S., Liu H.H., Ibbott G.S., and Mohan R. Reference photon dosimetry data and reference phase space data for the 6 mv photon beam from varian clinac 2100 serie linear accelerators. Med. Phys., 32(1) :137–148, 2005. https://doi.org/10.1118/1.1829172
- Huq, MS, Das, IJ, Steinberg, T, Galvin, JM. A dosimetric comparison of various multileaf collimators. Phys Med Biol 2002;47(12):N159-170. https://doi.org/10.1088/0031-9155/47/12/401
- J. V. Siebers, P. J. Keall, J. O. Kim, and R. Mohan, “A method for photon beam Monte Carlo multileaf collimator particle transport,” Phys. Med. Biol. 47(17), 3225 (2002). https://doi.org/10.1088/0031-9155/47/17/312
- C. Borges, M. Zarza-Moreno, E. Heath, N. Teixeira and P. Vaz, Monte Carlo modeling and simulations of the High Definition (HD120) micro MLC and validation against measurements for a 6MV beam. Med.Phys., 39(1), 2012. https://doi.org/10.1118/1.3671935
- Fogliata, A, Vanetti, E, Albers, D, et al. On the dosimetric behaviour of photon dose calculation algorithms in the presence of simple geometric heterogeneities: comparison with Monte Carlo calculations. Phys Med Biol 2007;52(5):1363-1385. https://doi.org/10.1088/0031-9155/52/5/011
- Panettieri, V, Barsoum, P, Westermark, M, Brualla, L, Lax, I. AAA and PBC calculation accuracy in the surface build-up region in tangential beam treatments. Phantom and breast case study with the Monte Carlo code PENELOPE. Radiother Oncol 2009;93(1):94-101. https://doi.org/10.1016/j.radonc.2009.05.010
- Poon, E., Verhaegen, F., 2005. Accuracy of the photon and electron physics in GEANT4 for radiotherapy applications. J. Med. Phys., 2005, 32(6), 1696–1711. https://doi.org/10.1118/1.1895796
- L.A.R. da Rosa, S.C. Cardoso, L.T. Campos, V.G.L. Alves, D.V.S. Batista, A.Facure, Percentage depth dose evaluation in heterogeneous media using thermolumiescent dosimetry. JOURNAL OF APPLIED CLINICAL MEDICAL PHYSICS, 11(1), 2010, 117-127. https://doi.org/10.1120/jacmp.v11i1.2947
- Cardoso SC, Alves VGL, da Rosa LAR, Campos LT, Batista DVS, Facure A, Monte Carlo Simulation of Bony Heterogeneity Effects on Dose Profile for Small Irradiation Field in Radiotherapy. PLoS ONE. 2010; 5(5): e10466. https://doi.org/10.1371/journal.pone.0010466