
The Design of an Experimental Model for Deploying Home Area Network in Smart Grid
Volume 5, Issue 3, Page No 419-431, 2020
Author’s Name: Fatima Lakrami1,a), Najib El Kamoun1, Hind Sounni1, Ouidad Albouidya1, Khalid Zine-Dine2
View Affiliations
1STIC Laboratory, Department of Physics, Faculty of Science, Chouaib Doukkali University, El Jadida, Morocco
2Computer Science Department, FSR, Mohammed V University, Rabat, Morocco
a)Author to whom correspondence should be addressed. E-mail: fatima.lakrami@gmail.com
Adv. Sci. Technol. Eng. Syst. J. 5(3), 419-431 (2020); ![]() DOI: 10.25046/aj050353
DOI: 10.25046/aj050353
Keywords: Smart Grid, Wireless Sensor Network, Mobile Network, QoS, HAN

Export Citations
In the smart power grid, designing an efficient and reliable communication architecture has an important role in improving efficiency, and maintaining the connectivity of different network components. The home area network (HAN) provides an energy management system in houses since it enables home energy control and monitoring. So, it is imperative to determine a HAN configuration that provides low cost and better performance. We propose in this paper a conceptual and experimental model for designing a wireless sensor network to monitor a HAN in a Smart Grid. The novelty of this study is that it considers real object and network configuration. The use of ZigBee standard for wireless communication requires a meticulous physical and logical design to overcome limitations related to nodes density, traffic load by PAN, network topology and motion pattern. The current study allows us to characterize the best configuration of the intelligent studied system and to provide a perspective on addressing the problem of a node failure.
Received: 03 January 2020, Accepted: 10 March 2020, Published Online: 18 June 2020
1. Introduction
Today, the proliferation of intelligent home appliances makes houses one of the most energy-consuming sectors in the world. So, optimizing consumption in terms of electrical energy has become a necessity, especially with the current depletion of non-renewable natural energy sources and the provision prohibiting polluting sources. The transition from the conventional electricity grid to the Smart Grid is dependent on the deployment of control and communication infrastructures, in parallel with electricity infrastructure from production sites to consumers via transmission and distribution networks. For this reason, the new electrical network uses computer technologies to improve the production, storage, and distribution of electricity. This allows these tools to be used along the entire chain of the power generation architecture, and in the concise term, makes it possible to minimize losses [1].
A Smart Grid is defined as an electrical system capable of integrating, intelligently, the actions of users, consumers, and producers to ensure efficient, economical, and secure electricity supply. With the integration of sophisticated power system electronics, communication technologies and networking, the Smart Grid is envisioned to considerably improve the existing electric grid. All elements of the production and distribution chain are affected by the performance of Smart Grids. Smart Grids consist of Power Generation System (PGS), appliances, meters, transmission utilities, sensing devices and information gateways that operate in near real-time. Smart
Grids are based on the integration of Renewable Energy Systems
(RES) and distributed energy storage. Also, Smart Meter (SM) [2] is one of the key components in Smart Grids. The use of smart meters to collect metadata on electricity consumption across the entire network, using sensors, enable suppliers to provide an energy amount according to customer needs. It is more about a communicating electricity network that integrates NTICs (New Technologies of Information and Communication) in its operation, which allows interactions between electricity grid and buildings. The use of NTICs allows distributed and bidirectional management. In fact, with such integration, many optimization options become available to ensure an efficient electricity delivery, economically viable.
The wireless sensor networks (WSNs) have been recently widely recognized as a promising technology, deployed to improve various aspects of Smart Grids. WSNs collect different data (e.g., power production, consumption, weather conditions), these data are analyzed to control the power flow, to balance the power demand/response, to avoid problems of a power blackout and to build intelligent features into the existing electric network. The communication infrastructure of Smart Grid is a composite of three main hierarchical structures which include home area network (HAN), neighborhood area network (NAN) and wide area networks (WAN). A HAN manages principally consumers appliances, renewable energy resources, and storage systems. NAN is deployed to establish interaction between data concentrators and smart meters while WAN serves as a backbone for communication between control centers and bulk power system players.
A HAN enable to connect smart electronic devices, that can operate interactively and autonomously, via different wireless/wired protocols. Smart devices (sensors) are generally implemented (embedded) for monitoring and controlling the energy consumption of different forms of smart devices, such as smart cars, smart microwaves, smart refrigerators, or any smart home appliance.
This paper focuses on designing an experimental scheme for deploying a sensor network to monitor smart objects in a Home Area Network (HAN). It is a multidimensional model where several configurations are considered. The proposed scheme is evaluated according to: the type of logical and physical network topology, the traffic load depending on packet size and traffic distribution, the density of nodes and motion pattern.
The rest of the paper is organized as follows: In section II, related works along with their limitations are presented. In section III, we describe the architecture and functioning of the Smart Grid. Section IV studies the deployment of sensor networks for Home Area Networks in Smart Grid. In section V, we discuss the experimental design and evaluation of the performance of the proposed model. Finally, section VII concludes the paper.
2. Related Works
Research works on the use of sensor networks in the context of Smart Grid networks started a few years ago [3]-[6]. Authors in [7] and [8] present a tutorial on deploying sensors for data collection in Smart Grid. A detailed description of the monitoring process in Smart Grid from power generation to power storage along with the communication network architecture and its components is given by [9]. Authors in [10] present an interesting research that covers several important topics in sensing, communicating and managing a Smart Grid. Authors in [11] give a state-of-the-art of home area communications and networking technologies for energy management, authors discuss the challenges risen with the multitude of wireless standards that are currently used in HANs, causing a fragmentation in HAN market. However, Authors precise that ZigBee is still the most popular standard for wireless communication in HANs, due to several reasons: Low cost, low energy consumption etc. In [12] and [13] focus on studying analytically different communication protocols in HAN. Authors give a review of characteristics, limitations and challenges of ZigBee, Bluetooth, Wi-Fi, RFID, SPI and Home Plug. The comparison is performed according to : Data rate, frequency, coverage range, latency, battery life, security and others. Similarly, authors in [14]] have demonstrated that ZigBee responds precisely to HAN requirement. However, several wireless technologies are needed to be combined to achieve data transmission in HAN, Authors give the example of ZigBee for household appliances to control and monitor systems and Wi-Fi for connecting digital products to communication equipment. To deal with the problem of heterogeneity of devices, authors in [15] propose the cognitive radio based communications infrastructure for the Smart Grid. In [16] gives an overview of communication infrastructure in Smart Grid based on cognitive radio for spectrum regulations since it operates in the license-free bands and so, can be applied in the HAN, NAN and WAN.
Authors in [17] and [18] present a framework of Smart Grid with different challenges related to wireless WSN deployed to monitor smart gird. In [19], a review of wired and wireless communication technologies used in Smart Grid is presented, the authors compare the performance of different technologies and their applicability to different types of smarts grid networks, the comparison was analytically based on the properties and characteristics of each technology.
In [20], a sequential scheme that controls the transmission sequence of wireless sensor nodes to achieve greater energy efficiency is proposed. The optimal combination of subsequent control level and transmission power is calculated according to different delay requirements. In [21] presents a survey of the challenges related to the deployment of Smart Grids. it proposes a literature review of the properties and constraints of Smart Grid simulation platforms; authors address eventually the new limitations of the deployment of WSN in Smart Grid applications. A Similar work is presented in [22] and [23], where authors study different communication schemes of sensors with smart meters integrated into a Smart Grid. The presented work focused on describing and discussing the technical feasibility of communication in the field of low-voltage consumer devices. For this purpose, two network models have been adopted: Flat and hierarchical. Authors have shown that the hierarchical model reduces packet loss for a high nodes density, although the transmission time is considerably increased, compared to the flat one.
In many research studies, different authors prove that the use of mobility can bring more benefits in improving the performance of a wireless network. In this context, several network management algorithms have been developed, taking advantage of the mobility of one or more particular network nodes. In [24] proposes a method to increase the connectivity time of nodes with the coordinator in IEEE 802.15.4 network, based on beacon exchanges. The proposed solution is based on measuring the signal strength of the received beacons to anticipate if the node moves towards the coordinator or is leaving its coverage area. Thus, the connectivity time is increased by choosing the coordinator with good signal strength, located in the area to which the mobile node is moving. Authors in [25] study different patterns of coordinator mobility in a ZigBee network. The mobile coordinator path can be one of the following trajectories : outer periphery, inner periphery, along a main diagonal, circular, and random path. Obtained results indicate that keeping the coordinator static gives the best performance, or if a trajectory must be chosen, then it should provide sufficient time for each segment of the network to collect all exchanged data. In [26], the authors implement a network node control module into its functional system. If needed, the module reconfigures the sensor to preserve its energy. Based on the same principle, [27] proposes to explore the mobility of the coordinator role to control routing processes for energy balancing between nodes, which provides opportunities for dynamic network reconfiguration. In [28], authors present a review of different approaches related to mobility in sensor networks, offering a comparative study of the various mobility protocols in WSN: MBC-based, MDC-based, they propose also an algorithm to optimize the trajectory in the MDC. Another study was given by [29] where the performance sensor network is evaluated, for mesh and tree topologies, in the presence of mobility constraint and node failure. A more detailed study of the impact of mobility is given by [30] considering a high nodes density and two mobility schemes: octagonal and random. In [31]investigates the challenges and future perspectives of IoT (Internet of Everything) research in the Smart Grid, and the way it can contribute to improving various network functions for power generation, transmission, distribution, and final utilization. In the same context, a conceptual model for the Smart Grid within the Internet of Things is proposed by [32]. The proposed model is based on IPV6 as the backbone of the Smart Grid communications layer. Authors assume that every object must be assigned an IPV6 address while using a 6Lowpan communication protocol, however, the conceptual model proposed is not yet validated. In [33] provides a cross-layer data communication scheme target-aware based on cross-layer technique to enhance reliability and to reduce the latency in wireless sensor networks for IOT object communication in Smart Grid. The technique called TACT builds a set of nodes known as connected dominating set and each sensor node sends the data to the nodes present in the connected dominating set. TACT and FTACT approaches presented in this paper, outperform other solutions proposed by the literature like Default IEEE 802.15.4, DRX and FDRX, in terms of packet delivery ratio, latency, and data throughput.
3. Smart Grid Architecture and Functioning
The deployment of Smart Grids requires a diversity of technologies.
This field of activity is located at the crossing of several sectors: Energy: producers, transporters, distributors and electricity suppliers, Electrical network equipment: manufacturers, electrical, and digital equipment.
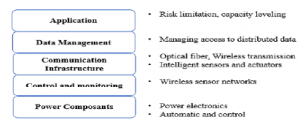
Figure 1: Smart Grid communication plans
Computer networks have a significant role in the interconnection of units in Smart Grid (e. g. Generators, substations, power plants, energy, etc… storage systems, smart meters…) exchanges concern no longer only energy but also information. This information can be a command for control, monitoring, or even maintenance of the consumption chain. In the case of homes (smart houses), grid voltage adjustment is generally managed by control modules equipped with wireless communication interfaces (sensors) and remotely controlled by a control center. Recently, there have been some perspectives of integrating electric vehicles into the house electrical grid. With the development of Smart Grids, the concept of energy consumption in houses is no longer the same. Actually, the supply and demand of electrical energy are no longer centralized. A house can both consume and sell electricity to a neighbor house using a supply and demand procedure. For this reason, conceiving a distribution system to manage supply and demand is necessary. Several proposals have been reviewed in the literature: IDAPS [34] ADAPS [35] and [36]. At the network level, the data infrastructure, the generic model generally consists of a set of sensors that communicate with the smart meter via a home gateway. The information collected can carry several physical quantities. This information is essential to give an idea of the status of the house in the Smart Grid chain (consumer or consumer/producer) and also on the appropriate energy source to use in real-time. The communication architecture in the Smart Grid network is presented by a hierarchy of two primary levels: the central network (CN) and the access network (AN). The central system (CN) connects control centers, power plants, and the distribution network (DAN), also known as the wide-area network (WAN). Control centers take preventive measures when the electricity grid is in crisis, and, during regular hours, they monitor consumption and generate bills. The most favorable communication technology for communication in a core network is the optical fiber. The access network consists of a home network (HAN) and a neighborhood network (NAN). Home Area Network (HAN) is a multi-vendor network of home appliances that collects data on electricity consumption and transmits it. There is also the Advanced Metering Infrastructure (AMI), which supports fault recovery practices, power monitoring, and other miscellaneous supervision functionality.
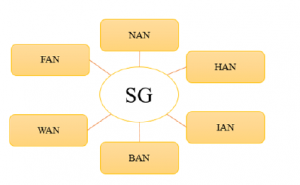
Figure 2: Smart Grid network types
NAN is the network that interconnects AMI HANs located in homes, industries, and businesses. It is also deployed for monitoring support and distribution substation networks. BAN and IAN networks refer to parallel HAN networks when they are implemented in companies/buildings or industrial areas, respectively. The most suitable communication in HAN/BAN/IAN networks is wireless technology. These networks are known for their easy implementation for a large number of users as well as their configuration, and therefore make it possible to supervise electricity consumption at home in a very efficient way. Due to the degree of similarity between HAN, BAN, and IAN, we only present in the next sections HAN, NAN, and WAN [37].
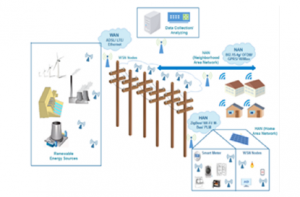
Figure 3: Smart Grid application
3.1 Home Area Network (HAN)
Home Area Network (HAN) connects electrical devices in the home, such as monitors, home appliances, or any intelligent equipment that uses electricity. HAN facilitates communication and interoperability among digital equipment in the house, it also provides better access to digital entertainment tools and increases productivity in plus of organizing the home security. The main challenge in implementing a HAN solution is to simultaneously connect objects inside the home/building while offering smart interoperability features, and to connect the entire home/building network to the outside world for remote monitoring and control. The HAN allows consumers to collect information on their consumption behavior [38] and the electricity usage costs via in-home monitoring devices.
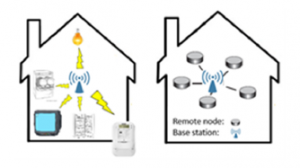
Figure 4: Example of a HAN
Due to the low-bandwidth requirements of HAN applications, it needs cost-effective communication technologies such as Bluetooth, WiFi, Zigbee, PLM. The energy gateway is needed for measurement, management, and communication of energy systems for smart homes and buildings (figure 4). This example design is a bridge between different communication interfaces, such as WiFi, Ethernet, ZigBee, or Bluetooth, … In demand-side, power consumption is a significant parameter. The Smart Grid enables the two-way flow of electricity and information between supplier and consumer by using the smart meters and the Advanced Metering Infrastructure (AMI) [39].
3.2 Neighborhood Area Network (NAN)
NAN is established between data collectors and smart meters in a neighborhood area. It is represented by a Wired/wireless connection from meter to the monitored device, either directly or via a data aggregator. To this end, short-range communication technologies can be used to collect the data measured by smart meters to be transmitted to the data concentrator. NAN is the network that interconnects the HAN AMIs that are in homes, industries, and businesses to the WAN. NAN is used for meter reading, demand response, remote disconnect for load control, local command messages, etc. and connects access network, monitoring support, and distribution substation networks. Wireless NAN can be based on Zigbee, Wifi, Wireless HART. One of the primary uses of the neighborhood area network is to communicate with smart meters. Often, we prefer to use meters from a single vendor to simplify communication between the service provider network and the house meter. However, by standardizing communication through the usage of an open and standardized protocols, meters from different vendors can now be interoperable [40].
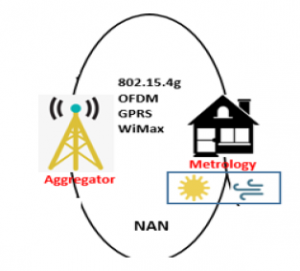
Figure 5: Example of a NAN
The next section discusses the advantages of deploying sensors in smart grid.
3.3 Wide Area Network (WAN)
The WAN creates a communication path between the service provider’s data center and data concentrators. It is a high bandwidth and robust two-way communication network, that can handle long-distance data transmissions for Smart Grid monitoring and applications control. In general, WAN networks adopts mainly the communication technologies that provide the best coverage with the lowest cost, such as LTE, cellular networks (2G3G systems), fiber, power line communication networks. However, other technologies can also be deployed, such as WiMAX, LoRaWAN, NB-IoT, Sigfox.
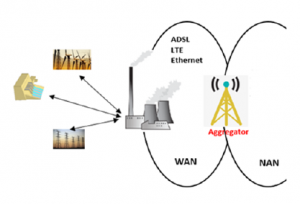
Figure 6: Example of WAN
4. Key Benefits of Deploying WNS in Smart Grid
The market for residential energy management is now increasing dramatically due the growing of Wireless sensor network technology field. So, more and more applications are using this technology. In fact, today’s electronic and computer advances made it possible to develop tiny sensors that can perform variant tasks. WSN can now sense the environment, calculate outputs based on the collected data and send results through to the network to a gateway or a smart meter. The IEEE 802.15.4 standard provides three topologies: star, P2P. The system formed is called PAN (Personal Area Network), each PAN has a unique ID and one or several coordinators. Above 802.15.4 [41], the ZigBee network layer allows the creation of more complex networks such as mesh or tree networks through automatic level 3 routing, AODV [42] for example, is used to route data in WSN mesh network.
HAN networks represent a typical deployment of sensor networks in the Smart Grid field. With the arrival of the IoT, home or domestic appliances are now equipped with integrated sensors for monitoring their energy consumption, temperature, or any other data. The development of the embedded system supports such perspectives, especially with the proliferation of home appliances that dominate a large fragment of the electronics market. Smart houses will contain a large number of devices, and therefore will require continuous monitoring of their power consumption for the proper functioning of a Smart Grid system.
The deployment of HAN come is in response to several communication requirements, the network must transport the sensed data/control signal from/to the sensor or the gateway or any device within the network while considering the requirements that should be met when a service is provided. The performance of the network must achieve to enable energy management applications to monitor and control the devices on the home network. In a similar way to LANs, HANs design a term used generally to describe all the intelligence and activity that occurs in HEM systems [43], the local area in LAN is a home for a HAN [44]. the HAN connects devices that are capable of sending and receiving signals from a meter, a gateway or other wireless device. A typical HAN may consist of the following basic functional components: Node controller (a coordinator), gateway, end devices (sensor), smart meter. Objects in HAN can be connected through Wired or wireless technologies, there are trade-offs that involve power consumption, signaling distance, sensitivity to interference, and security. The main point here is that HANs are not energy management applications, but represent a communication infrastructure for exchanging sensed data (sensors) and commands (actuators) to ensure a real-time monitoring and controlling of energy consumption within a house.
Recent smart homes are equipped with smart appliances and each appliance is considered as a thing (object), each object can be assigned a unique ID and can communicate with the grid to upload and download data and commands from different distant devices. WSN is the most suitable option for HAN, NAN, WAN and smart micro grid applications for integration and operation of renewable energy sources. The Internet of things (IoT) applications are becoming one of the emerging Smart Grid enabling technologies. Several works are now considering HAN component as IoT assets (Reffered to Related works section), and develop solutions for enhancing communication and data transmission over the Smart Grid. The ZigBee [45] wireless technology is classified a low cost technology that allow wide deployment in wireless control and monitoring applications. It has been proven that it offers a low power usage and then a longer life with smaller batteries, compared with other wireless standards. In plus, the mesh networking provides high reliability, redundancy and broader range. ZigBee Home and Building Automation focus on enabling smart homes and buildings that can control appliances, lighting, environment, energy management, and security as well as expand to connect with other ZigBee networks. This is the reason that make this technology fit well into the HAN area.
5. Methodology and Proposed Model
If users aim to manage the energy they consume efficiently,they will require a precise and accurate measurements of their energy consumption. Monitoring objects in HAN, implies deploying a WSN architecture. The most popular standard for communication is ZigBee. In ZigBee standard, the real coverage can reach 50 meters. Each end device can communicate with its neighbor (sensor/Coordinator/Router…) within this distance. The disposition of objects in HAN can impact the degree of reachability according to the covered area and the presence of obstacles. Data converges toward a residential gateway that can serve as a smart meter energy gateway if it supports the same PHYs as handled devices and smart meters. HAN must deal also with other issues, like packet loss due to either failure of coordinator or unreachable destination due to the depletion or a node mobility. In plus, consumers are now aware about the depletion of the natural resources, and the need of deploying all the possible effort for the energy conservation, this is why they need to get a real-time visibility of their energy consumption. Therefore, electrical power consumption monitoring on a real-time basis is very essential to avoid exceeding the critical demand level and also to reduce the latency in detecting accidents in the electric power systems or control systems. So, the network must employ its resources efficiently, to deliver packets in a timely manner.
Designing a HAN is an evolving and changing task. The first step consists on planning the communications architecture to be deployed. The current emphasis on mesh radio technology and the availability of different wireless protocols (ZigBee, RFID, Z-wave, and so on) with different transmission proprieties creates both opportunity and a certain complexity to define the appropriate one (s) to be deployed in a HAN. In fact, designing a communication backbone may depend on several system and data requirements. In this work, we consider further the cost and ease of implementation along with the failure management and the level of QoS provided by the network, for this reason, the proposed model is based on Zigbee.
ZigBee is a bidirectional radio frequency (RF) wireless network standard. The standard operates on the IEEE 802.15 for physical radio specification, it is specially designed for sensors and control device. It is designed for devices requiring low-latency, low-energy consumption and lower bandwidth, it operates in the license-free frequency for short range [46]. However, the multitude of wireless standards that are currently used in HANs cause a fragmentation in HAN market; ZigBee is the most suitable and most implemented protocol in HANs. It is used in most home appliances. ZigBee defined recently an application layer standard for smart energy for HANs with intention of low-cost devices and low energy usage [47].
In order to handle the sensibility of the transported data, the HAN, must provide different levels of data delivery criticality depending on the needs of the Application and supports varied latency requirements messages communicated between various points within the Smart Grid.
The model designed in this work, considers different dimensions: density, mobility, traffic load/distribution and network topology. Different type of sensors are used for collecting (Energy, Temperature, Humidity..). We design the network according to a real house scheme. The network studied in this work uses ZigBee standard for wireless communication, the design of the ZigBee supports star, mesh, and tree topology, so the tree networks are simulated and evaluated. Each room presents a separate PAN, with a supervised area that covers 1500m2. The density of nodes varies according to the nature of the room, so, there is a specific density per PAN. Two types of Traffic distribution are configured: Uniform and personalized. A detailed description of the experiment details is presented by figure 7.
Several performance metrics are considered for evaluating the experiment. Different measures are:
E2E Delay: Represents the duration between the time a message is queued for transmission at the physical layer until the last bit is received by the destination node.
Throughput: In this study, it represents the amount of data transmitted correctly from the source to the destination in an interval. It is quantified with various factors, including packet collisions, obstacles between nodes, and the type of the topology.
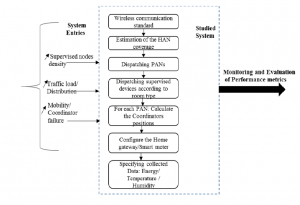
Figure 7: The experimental Model architecture
Loss Rate : The packet loss rate is the percentage of packets lost during data transmission. It is a criterion for measuring the quality of a network’s services. Is calculated by the following equation (1):
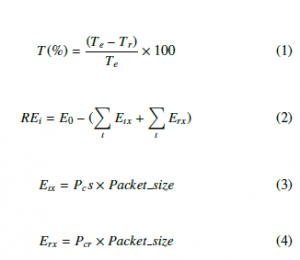
Lf= min(L0,…..Lm) with Lm=Ei/Energy consumption per time unit
Pcs and Pcr are weighting coefficients
We implement in this work a light application that enable nodes to calculate their residual energy to be communicated to a controller charged of collecting data. The controller is also responsible of monitoring and evaluating obtained data. The table below summarizes the configuration parameters:
Table 1: Network Configuration
| Recording Time | 900s |
| Traffic Destination | Random |
| Traffic Distribution | Uniform/ Personalized |
| Number of nodes | from 2 to 25 |
| Mobility Speed | from 1 to 6m/sec |
| Other sensors type | Humidity, Electrictity, Temperature |
| Wireless Technology | Zigbee |
For each experiment, we fixed the topology and increase the impact of density, mobility and traffic load. First, and while varying density and motion pattern in the network, we fixed a constant traffic load of 6 packets per second with fixed size to be routed between randomly selected end-devices (figure 8). To increase the traffic load, we increase the number of packets sent per second, the traffic distribution is varied according to the specific need of the experiment. All sensor nodes are working in the 2.4 GHz band.
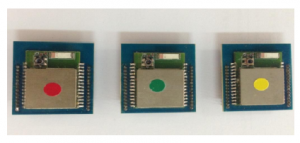
Figure 8: Zigbee modules for Coordinator, sensor and router
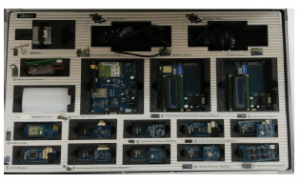
Figure 9: The Zigbee platform of the deployed WSN
The very sensitive role of HANs in the connectivity of objects in the smart grid requires prior planning of the deployed network for better performance. In the second part of the experiment, we study the case of mobility, firstly as a network optimization scheme,
and secondly as a solution for nodes failure. Mobility can provide significant benefits to the studied network if it is well planned in accordance with the disposition of the nodes in a home network, as well as the nature of the deployed devices. The HAN presented by figure 14 is made of 3 separated PANs: PAN1, PAN2 and PAN3.
Devices are able to move while having an auto-assigned PAN. To give more flexibility to the network, we define two types of coordinators mobility:
- Determinist travel: the coordinator has a cyclical operating mode. The trajectory as well as the pause time are fixed.
- Random displacement: the coordinator’s position is defined by the user, or generated randomly.
The purpose of this part is to study the behavior of the HAN network, in the case of the presence of one or more mobile coordinators and end devices. The network consists of 3 distinct PANs; each PAN represents a room of a house with an approximate dimension of 200m2. It is imperative to ensure that the 3 PANs coverage does not interfere. In the first scenario, we consider that at a precise time of the day, the coordinator moves to collect data from different nodes (sensors/routers) with different speeds, when the coordinator reaches the nearest node/router of a given PAN it continues its trajectory with no pause time. In the second case of study, the coordinator stops for a pause time, to collect information on the electrical consumption of the supervised devices; the pause time varies as the coordinator speed increases. We consider four mobility patterns:
Circular, Octagonal, pre-defined trajectory, and Random. The predefined trajectory consists of moving the coordinator directly from one PAN to another, the start point represent, for example, the center of the supervised area of the house. Each PAN is composed of 5 sensors and 3 routers. While the coordinator moves, two devices from PAN1 also leave their positions towards other PANs with a moderated speed that do not exceed for all scenarios 0.5m/sec. In real context, sensors can be generally embedded in the electronic circuit of the smart home appliance or added manually. They can be static or mobile. For example, for a vacuum cleaner or even an electric vehicle or any device with the capacity to roam over different PANs of the same HAN network, the mobility scheme can vary over time. Here, the coordinator moves according to four patterns already defined above, we use a play car with remote control to transport the coordinator through different PANs and according to different trajectories. We plan to determine the speed and the corresponding pause time, depending on the distribution of the traffic sent, and also the best mobility scheme according to sensors distribution in a HAN. The main objective is to guarantee a reliable network service.
The traffic distribution function is also configured to match the coordinator’s crossover, this implies that each node is set according to a specific traffic pattern function, based on the coordinator traveling.
6. Results and discussion
6.1 Results related to varying supervised devices density and Traffic Impact for different topologies
We present in this section results related to varying supervised nodes density and traffic load for different topologies. Figures 11, 12, 13 and 14 present successively Loss Rate, Network Lifetime, throughput and delay:
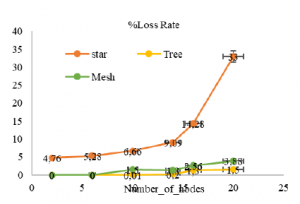
Figure 11: Loss Rate in function of number of Nodes
By examining loss rate results, we can notice that the lowest loss rate is obtained successively for the tree and the mesh network. All nodes in the network are configured to send the collected data at a specific time. In a star topology, the network is controlled by a single coordinator that is responsible for initiating and maintaining all other devices. As the number of nodes in the network increases, the coordinator becomes saturated with the amount of data received. when the coordinator’s buffer is saturated, it will proceed to delete the new incoming packets. In a tree or mesh topology, the coordinator is responsible for starting up the network, but communications can go through intermediate routers, which will create a differential arrival time that will provide additional time to the coordinator to process packets, and then the loss rate (dropped packets) is significantly reduced.
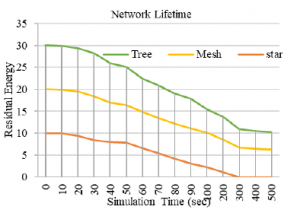
Figure 12: Network Lifetime in function of number of Nodes
Network lifetime is defined as the duration from the time the network is operational until the first node of the WSN depletes its energy completely. Therefore, the lifetime of a sensor node in the WSN depends essentially on the energy consumption of the node with time. At the beginning of each experiment, we set the energy level of the (chargeable) batteries of different nodes in the network to the same initial value. By observing the results of the figure 11, we notice that the first node that runs out is the coordinator of the star topology. A solution to solve this problem is to set up different intervals for sending the data. The mesh network exhausts second. Indeed, when configuring the mesh network, we have placed the coordinators in such a way that they are accessible via several routes. By default, the shortest path is used, which leads to the rapid depletion of one of the sensors.
The throughput (figure 13) represents the quantity of useful data received by all the nodes of the network. The tree topology offers the highest throughput, which is in accordance with the result of the loss rate. In fact, the physical architecture of the network and routing scheme provides a more reliable data transmission. For a reduced number of nodes, star topology outperforms mesh topology. The data routing mechanism in a star topology is simple and efficient, and remains the most appropriate for a HAN network. However, this mechanism becomes less efficient when the number of managed nodes becomes very high.
When the number of nodes is small, the shortest delay (figure 14) is achieved for the star topology, while the mesh topology will result in the highest delay. When the number of nodes increases, the tree topology responds better to the evolution of the network. We can deduce, that in the practical case of a HAN deployed on a large scale, it is the tree topology that is the best adapted. The star topology remains the best solution for the interconnection of a reduced number of nodes. The deployment of sensor networks in other contexts may give better performance using a mesh routing.
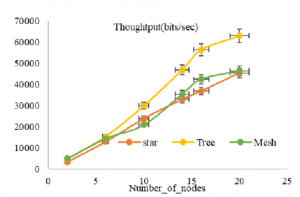
Figure 13: Through put in function of number of Nodes
When the number of nodes is small, the shortest delay (figure 14) is achieved for the star topology, while the mesh topology will result in the highest delay. When the number of nodes increases, the tree topology responds better to the evolution of the network. We can deduce, that in the practical case of a HAN deployed on a large scale, it is the tree topology that is the best adapted. The star topology remains the best solution for the interconnection of a reduced number of nodes. The deployment of sensor networks in other contexts may give better performance using a mesh routing.
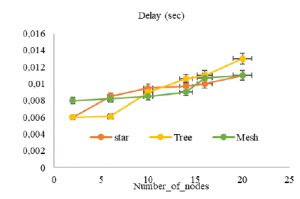
Figure 14: Delay in function of number of Nodes
In the following section, we propose to divide the domestic network into several PANs, to use a single mobile coordinator that moves between different PANs using a play car with a remote control during specific times of the day to collect information from different sensors. The next section studies the different possible mobility patterns for a coordinator, in terms of speed, pause time, and also the movement trajectory. The results of the previous section demonstrate that the tree topology is very suitable for deploying sensors to monitor building, for this reason, the tree routing will be deployed in the next evaluation related to mobility.
In general, ZigBee networks are more designed to work in mesh. However, results presented in figure 11, 12, 13, 14 show that the tree topology offers better results for different performance metrics. We can notice that the tree topology provides a higher bandwidth. So it is revealed to be more suitable for medium density networks, like houses. The packets follow the path through the tree topology to the destination, which is revealed very practical in a HAN network, where the distribution of nodes is already defined. Also, it does not require any routing tables to send the packet to the destination. Despite this, it does not offer redundancy, like mesh topology, so in case of a node failure, the entire network is compromised. Although, in a house building and term of financial cost, the star topology remains the most appropriate, especially if the network is flat and covers a restricted area. But, in reality, and given the size of an area that can be covered by the peripheral in a HAN, the coordinator cannot access all the supervised devices. The tree topology remains practical if the building, for example, is with several floors and one or several routers is/are available to deliver data to the coordinator qualified as a ”root”. Although mesh network offers several advantages like: data can be transmitted simultaneously between nodes, there is a high redundancy, expansion and modification can be done without interrupting the network, but the overall cost is high and practically not suitable in HANs, giving the node density and the physical environment where they are deployed.
6.2 Results related to Motion pattern impact for different network topologies and traffic distribution without pause time
Results presented in figures [15,18], show the performance study of the network according to different mobility schemes. We consider two cases, with and without pause time. Performance metrics are given according to E2E delay, throughput, Loss Rate, network lifetime, and average connectivity duration to each PAN during recording time. Figures [15-18] bellow represent the case without pause time, while figures [19-22] resumes result for the case with pause time.
The lowest loss rate (figure 15) is obtained when the coordinator follows the predefined path, which is configured in such a way that it crosses the centers of the different PANs via the shortest paths. the different PANs contain sensor nodes, routers and also sleeping coordinators. Sleeping coordinators may represent here a state of failure. In the predefined trajectory the mobile sensor is configured to reach the different positions at different intervals, the traffic distribution is also configured to suit the crossing of the coordinator. The octagonal and circular trajectories also show a low loss rate compared to the random trajectory.
Figure 16 shows that the shortest delay of the forwarding of the useful data is also obtained successively for the predefined trajectory, circular and finally the octagonal. This is mainly due to the distance between the coordinator and the sensor/router nodes for each mobility scheme.
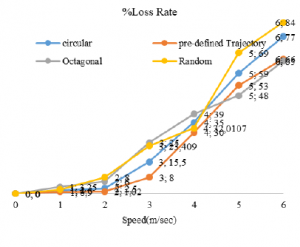
Figure 15: Percentage of Loss rate in function of increasing Coordinator speed without Pause time
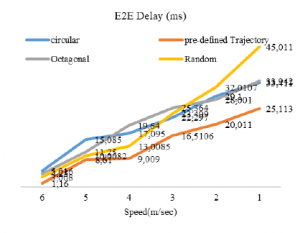
Figure 16: End to End delay(ms) in function of increasing Coordinator speed without Pause time
Regarding the lifetime of the network shown in the figure 17, presented by the average residual energy remaining at the end of the experiment, we can notice that following the predefined trajectory, it is the octagonal trajectory that offers a higher lifetime compared to the circular and the random trajectories. The octagonal trajectory allows the coordinator to reach the closest positions to the centers of the PANs being traversed, which means that at the time the data are sent, the coordinator is within the radius of coverage of a PANi, and the particularity of the trajectory is that the coordinator takes a significant amount of time to traverse the PANi, and given its speed, the coordinator reaches the next PAN before the start of data transmission. As a result, the nodes do not quickly deplete as a consequence of the increase in their transmission power in order to reach the coordinator in case of a distant coordinator.
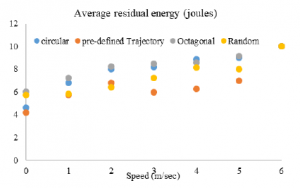
Figure 17: Average of residual energy in function of increasing Coordinator speed without Pause time
Figure 18 shows the average connectivity time to the coordinator per PAN. the highest time is obtained for the predefined trajectory and the octagonal trajectory. the same interpretation as for the case of the residual energy is valid also in this case.
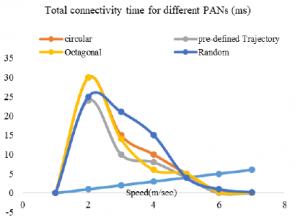
Figure 18: Total connectivity time for a coordinator to different PANs in function of increasing Coordinator speed without Pause time
6.3 Results related to Motion pattern impact for different network topologies and traffic distribution with pause time
The figure 19 shows the average connectivity time to the coordinator per PAN. the highest time is obtained for the predefined and the circular trajectories, especially for high speeds. The result was significantly improved compared to experiments without pause time. the average connectivity has increased by 20% after the introduction of the pause time. The coordinator stops for a moment before continuing his movement, which allows nodes to maintain their connectivity with the coordinator for a longer period of time.
In the meantime, as in the case of mobility experiments without pause time, the short delay (figure 20) of the useful data is obtained successively for the predefined trajectory, circular, octagonal and finally the random. We can also add here that the coordinator stops for a period of time that is proportional to its travel speed during data collection.
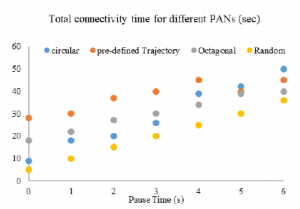
Figure 19: Total connectivity time for a coordinator to different PANs in function of increasing Coordinator speed with Pause time
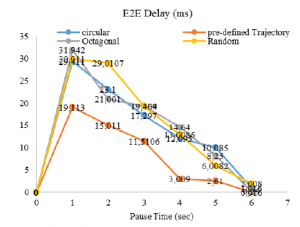
Figure 20: Total connectivity time for a coordinator to different PANs in function of increasing Coordinator speed with Pause time
Referring to figure 21, we can notice that the predefined and circular trajectory results in the best performance in term of loss rate. The results have significantly improved compared to the case without pause time. In the previous experiments, the coordinator moves without stopping, and as the speed increases, the loss rate increases, since the coordinator does not have enough time to collect the data and then transmit it to the home gateway.
By referring to figure 22, we can conclude that indeed, the methodology of managing the coordinator mobility increases the life expectancy of the wireless sensor network by leveling the difference in the remaining energy between all the elements of the network. If the coordinator is far away from a given PAN at the moment of sending the information, the emitter node deploys more energy by increasing the transmission power to reach the coordinator, which depletes the network quickly.
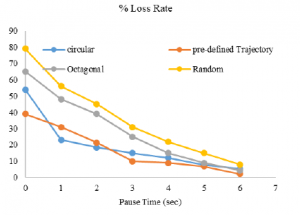
Figure 21: Percentage of Loss rate in function of increasing Coordinator speed with Pause time
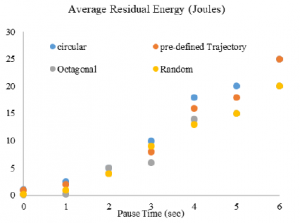
Figure 22: Average of residual energy in function of increasing Coordinator speed with Pause time
Figures [19- 22] have shown the performance results of different mobility schemes of a single coordinator for different speeds, with and without pause time. According to the obtained results, the best network performance is obtained respectively for: the predefined trajectory, circular, octagonal, and finally random path, although the latter gives the highest throughput for both the transmitter and the receiver. The circular configuration shows better performance than the octagonal configuration, especially for high speeds. The proposed ZigBee network works very efficiently using the circular configuration mobility model. This model can even be used in a ZigBee network on a large scale. The introduction of a pause time during the coordinator movement improves significantly the network performance. The pause time was configured to allow the coordinator to remain in each PAN for a duration that increases proportionately to the mobility speed. According to the obtained results, we can conclude that, for reasonably high speed, it is imperative to have a higher pause time, to get better performances. The deployment of an adequate mobility scheme can solve several problems, related to cost nodes failure and communication centralization. However, the mobility scheme must take into account several parameters and constraints related to: traffic distribution and load, physical properties such as transmission and reception power, and also the size of the coordinator’s MAC queue. We intend in our future researches to exploit, the results obtained for mobility to resolve the problem of node failure, in the case of networks where several coordinators can be deployed. A recovery algorithm will be implemented in a centralized server than manage nodes position via a monitoring system (SCADA for example), the node can be either a smart gateway, smart meter or even an SDN server. The presented study enables us to extract numerous experimental results about several configurations like: Nodes disposition, traffic distribution and motion pattern. The accuracy of the extracted results is very important since they will be used in configuring a HAN for smart grid monitoring, to ensure better performances and high efficiency, through controlling the system entries instead of setting them randomly.
7. Conclusion and Perspectives
Wireless sensor networks have greatly facilitated the different operating processes of Smart Grids. However, the diversity of characteristics of different WSN applications means that they have different transmission performance requirements. As a result, several challenges may arise depending on various application contexts, increasing the difficulty of deploying and maintaining the Smart Grid. In this paper, we have experimented with the different operating modes of HAN by considering several constraints related to the physical/logical installation of the network and also to the process of collecting and exchanging information. We started by comparing the performance of routing schemes in a ZigBee network, the obtained results attested that Mesh routing offers the best throughput, while the tree topology is more efficient for the rest of the metrics and is suitable for medium nodes density. For optimization purposes, we propose to exploit the mobility of a single coordinator to collect data from sensing nodes to be forwarded to the home gateway or directly transferred to the smart meter. We demonstrate that rapid movement during the communication process reduces transmission delay with an increase in network lifetime as long as an optimal pause time is configured according to the trajectory, mobility speed, and also traffic distribution function. In future work, we plan to implement a testbed of a HAN, that implements a centralized solution for configuring and managing nodes consumption and communication through the network for a better efficiency. The studied solution can be implemented either on a smart meter or a separate device as an SDN server. Managing nodes failure will also be addressed.
- Uslar, Mathias, et al, ”Applying the smart grid architecture model for designing and validating system-of-systems in the power and energy domain: A European perspective” Energies 12.2 (2019): 258.https://doi:10.3390/en12020258
- Depuru, Soma Shekara Sreenadh Reddy, et al, ”Smart meters for power grid- Challenges, issues, advantages and status” in 2011 IEEE/PES Power Systems Conference and Exposition. IEEE, 2011.
- M. El Brak and M. Essaaidi, ”Wireless sensor network in smart grid technol- ogy: Challenges and opportunities” in 2012 6th International Conference on Sciences of Electronics, Technologies of Information and Telecommunications (SETIT). IEEE, 2012.
- McBee, D. Kerry, G. Marcelo, ”Utilizing a smart grid monitoring system to improve voltage quality of customers” IEEE Transactions on Smart Grid 3.2 (2012): 738-743.
- Luan, Wenpeng, D. Sharp, S. Lancashire, ”Smart grid communication network capacity planning for power utilities” IEEE PES T and D 2010. IEEE, 2010.
- Erol-Kantarci, Melike, T. Hussein, ”Suresense: sustainable wireless recharge- able sensor networks for the smart grid” IEEE Wireless Communications 19.3 (2012): 30-36.
- Le Cam, Vincent, et al. ”Applications des rseaux de capteurs intelligents et de la communication sans fil l’instrumentation des structures de gnie civil.” (2008).
- Chen, Shu-yong, et al, ”Survey on smart grid technology” Power system technology 33.8 (2009): 1-7.
- Fan, Zhong, et al, ”Smart grid communications: Overview of research chal- lenges, solutions, and standardization activities”, IEEE Communications Sur- veys and Tutorials 15.1 (2012): 21-38.
- Kayastha, Nipendra, et al, ”Smart grid sensor data collection, communication, and networking: a tutorial”, Wireless communications and mobile computing 14.11 (2014): 1055-1087.
- Ghasempour, Alireza, ”Internet of Things in Smart Grid: Architecture, Appli- cations, Services, Key Technologies, and Challenges” Inventions 4.1 (2019): 22.
- Devidas, A. Remanidevi, M. V. Ramesh, ”Wireless smart grid design for monitoring and optimizing electric transmission in India” in 2010 Fourth Inter- national Conference on Sensor Technologies and Applications. IEEE, 2010.
- Kailas, Aravind, V. Cecchi, A. Mukherjee, ”A survey of contemporary tech- nologies for Smart Home energy management” Handbook of green information and communication systems. Waltham, USA: Elsevier (2012): 35-56.
- Hafeez, Ayesha, et al, ”Smart home area networks protocols within the smart grid context” journal of Communications 9.9 (2014): 665-671.
- Kuzlu, Murat, M. Pipattanasomporn, S. Rahman, ”Communication network requirements for major smart grid applications in HAN, NAN and WAN” Computer Networks 67 (2014): 74-88.
- Zaballos, Agustin, A. Vallejo, J. M. Selga, ”Heterogeneous communication architecture for the smart grid” IEEE network 25.5 (2011): 30-37.
- Sharma, Priya, G. Pandove, ”A Review Article on Wireless Sensor Network in Smart Grid” International Journal of Advanced research in computer science 8.5 (2017).
- L. Li, et al,”The applications of wifi-based wireless sensor network in internet of things and smart grid” 2011 6th IEEE Conference on Industrial Electronics and Applications. IEEE, 2011.
- S. Pranesh, J. Pyun, ”Mobility support in IEEE 802.15. 4 based mobile sensor network” IEICE Transactions on Communications 97.3 (2014): 555-563.
- L. Chhaya, et al, ”Wireless sensor network based smart grid communications: cyber attacks, intrusion detection system and topology control” Electronics 6.1 (2017): 5.
- A. Jurenoks, M. Boronowsky, ”Dynamic Coordinator Mobility Management Methodology for Balancing Energy Consumption in the Wireless Sensor Net-
work” Procedia Computer Science 77 (2015): 176-183. - A. Jurenoks, and Dejan Jokib, ”Coordinator Role Mobility Method for Increas- ing the Life Expectancy of Wireless Sensor Networks” Applied Computer Systems 21.1 (2017): 46-51.
- E. Eylem, Y. Gu, D. Bozdag, ”Mobility-based communication in wireless sensor networks” IEEE Communications Magazine 44.7 (2006): 56-62.
- N. Shantanu, et al, ”Investigation and performance analysis of some imple- mented features of the ZigBee protocol and IEEE 802.15. 4 Mac specification” International Journal of Online and Biomedical Engineering (iJOE) 13.01 (2017): 14-32.
- I. Nazrul, et al, ”Mobility Issue on Octagonal Structured ZigBee Network Us- ing Riverbed” International Journal of Communications, Network and System Sciences 9.3 (2016): 55-66.
- H. Daki, et al, ”Big Data management in smart grid: concepts, requirements and implementation”, Journal of Big Data 4.1 (2017): 1-19.
- Y. Saleem, et al, ”Internet of things-aided Smart Grid: technologies, architec- tures, applications, prototypes, and future research directions” IEEE Access 7 (2019): 62962-63003.
- S. Emiliano, et al, ”Industrial internet of things: Challenges, opportunities, and directions” IEEE Transactions on Industrial Informatics 14.11 (2018): 4724-4734.
- D. Amarnath, S. Sujatha, ”Internet-of-Things-aided energy management in smart grid environment” The Journal of Supercomputing (2018): 1-13.
- A. Manimuthu, R. Ramesh, ”Privacy and data security for grid-connected home area network using Internet of Things” IET Networks 7.6 (2018): 445-452.
- A. Jaffar, et al, ”Wireless sensor network design for smart grids and Internet of things for ambient living using cross-layer techniques” International Journal of Distributed Sensor Networks 15.7 (2019): 1550147719862208.
- Y. Wang, et al, ”Review of smart meter data analytics: Applications, method- ologies, and challenges” IEEE Transactions on Smart Grid 10.3 (2018): 3125- 3148.
- K. Gram-Hanssen, S. J. Darby, ”Home is where the smart is. Evaluating smart home research and approaches against the concept of home” Energy Research and Social Science 37 (2018): 94-101..
- B. Benaouda, ”La communication sans fil dans un rseau lectrique intelligent (smart grid): mthodologie de dveloppement” (2013).
- Luque-Ayala, Andrs, S. Marvin, ”Developing a critical understanding of smart urbanism” Handbook of Urban Geography. Edward Elgar Publishing, 2019.
- Uslar, Mathias, et al, ”Applying the smart grid architecture model for designing and validating system-of-systems in the power and energy domain: A European perspective” Energies 12.2 (2019): 258.
- Mahmood, Anzar, N. Javaid, S. Razzaq, ”A review of wireless communications for smart grid” Renewable and sustainable energy reviews 41 (2015): 248-260.
- Wang, Xiaojun, et al, ”A joint routing and channel assignment in multi-radio multi-channel wireless mesh networks” International Journal of Sensor Net- works 24.3 (2017): 173-182.
- Saputro, Nico, K. Akkaya, ”Investigation of smart meter data reporting strate- gies for optimized performance in smart grid AMI networks” IEEE Internet of Things Journal 4.4 (2017): 894-904.
- Farahani, Shahin. ZigBee wireless networks and transceivers. Newnes, 2011.
- etin, Grcan, ”IEEE 802.15. 4/ZigBee based wireless sensor network design for monitoring server rooms” in 2017 International Conference on Computer Science and Engineering (UBMK). IEEE, 2017.
- Zheng, Jianliang, J. Myung, ”A comprehensive performance study of IEEE
802.15. 4” Sensor network operations 4 (2006): 218-237. - Perkins, Charles, E. Belding-Royer, Samir. Das, ”RFC3561: Ad hoc on- demand distance vector (AODV) routing” (2003).
- Mahapatra, Bandana, A. Nayyar, ”Home energy management system (HEMS): concept, architecture, infrastructure, challenges and energy management schemes” Energy Systems (2019): 1-27.
- Foley, F. Peter, ”Home area network system and method” U.S. Patent No. 6,069,899. 30 May 2000.
- D. Amarnath, S. Sujatha, ” Internet-of-Things-aided energy management in smart grid environment” The Journal of Supercomputing, 1-13, 2018.
- Deshmukh, D. Akshay,B. Shinde, ”A low cost environment monitoring system using raspberry Pi and arduino with Zigbee” in 2016 International Conference
on Inventive Computation Technologies (ICICT). Vol. 3. IEEE, 2016.