
Analysis of Local Rainfall Characteristics as a Mitigation Strategy for Hydrometeorology Disaster in Rain-fed Reservoirs Area
Volume 5, Issue 3, Page No 299-305, 2020
Author’s Name: Kartono Kartono1,2,a), Purwanto Purwanto1,3, Suripin Suripin4
View Affiliations
1Doctorate Program of Environmental Science, School of Postgraduate Studies, Universitas Diponegoro, Semarang, 50241,Indonesia
2Department of Mathematics, Faculty of Sciences and Mathematics, Universitas Diponegoro, Semarang, 50275, Indonesia
3Department of Chemical Engineering, Faculty of Engineering, Universitas Diponegoro, Semarang, 50275, Indonesia.
4Department of Civil Engineering, Faculty of Engineering, Universitas Diponegoro, Semarang, 50275, Indonesia
a)Author to whom correspondence should be addressed. E-mail: kartono@live.undip.ac.id
Adv. Sci. Technol. Eng. Syst. J. 5(3), 299-305 (2020); ![]() DOI: 10.25046/aj050339
DOI: 10.25046/aj050339
Keywords: Hydrometeorology Disasters, Rain-fed Reservoir, Mann-Kendall Test, Time series model , Mitigation

Export Citations
The Gembong reservoir in Pati Regency, Java, Indonesia is a rain-fed reservoir, which experiences a depletion of it carrying capacity. The characteristic of local rainfall is one of the important factors in assessing the potential of hydrometeorology disasters in its area. Sedimentation in watersheds and reservoirs has covered water sources, so local rainfall determines the dynamics of water availability. This research is needed in the development of mitigation strategies. This article contains an analysis of the characteristics of local rainfall, and forecasting based on local daily rainfall data. This data was obtained from the rainfall gauge station in the Gembong reservoir area in 2007-2019. Variation coefficient, anomaly index, rainfall concentration index, and Mann-Kendall test were used to identify its characteristics. The time series model is used as modeling for forecasting. The results of empirical analysis show that rainfall volatility with irregular changes in high variability, meteorological drought in moderate category, rainfall trends follow fluctuating patterns and do not follow monotonic trend patterns but high concentrations of rainfall. Forecasting results with the Autoregressive Integrated Moving Average model for the wet months show an increasing in total rainfall by 17% in the next year. So, the potential for flooding is greater than the potential for drought. Based on the analysis of the local rainfall characteristics, then mitigation on flood is preferred.
Received: 09 April 2020, Accepted: 13 May 2020, Published Online: 29 May 2020
1. Introduction
Water is the most important natural resources for sustainable life in the world. Rainfall is one of the environmental variables that is often used to track the level and variability of climate change and is influencing the availability of water in the future [1]. Long-term climate change associated with changing patterns and intensity of rainfall has a potency to increase the frequency of drought or flooding.
Trend analysis based on historical rainfall data is needed to detect trends in climate variables [2], and in general, patterned sinusoidal periodic waves [3]. Climate change with volatile changes between water abundance and water scarcity make it difficult to manage its water availability [4]. Volatility of rainfall shows the size of fluctuations in rainfall data that is the size of the deviation to the average rainfall needs to be observed properly [5].
Rainfall volatility explains changes in rainfall intensity, which is very important to consider in the preparation of hydrometeorology disaster mitigation strategies [3-5]. The number of losses incurred due to natural disasters of climate change is necessary to mitigate disasters.
Observations at the location confirmed that the Gembong reservoir in Pati Regency, Indonesia is a rain-fed reservoir. The water collected in the Gembong Reservoir comes from direct rainwater or water through watersheds that inflow to the reservoir during the rainy season. The rivers are not able to drain their water into the reservoir in the dry season. The availability of water in the reservoir depends only on local rainfall. Climate change and its effect on local rainfall condition potentially influences the annual variability of water availability in reservoir.
Potential of hydrometeorology disasters depend on rainfall volume, intensity and duration of rainfall. Rainwater increases river flow and causes flooding [5,6]. Extreme changes of low to high rainfall intensity in a short period of time are often indications of flash floods or landslides. The frequency and intensity of hydrometeorology disasters and their impacts in Indonesia are increasing and resulting in greater losses, even claiming human lives. The Situ Gintung tragedy on March 27, 2009 is as an example
Extreme changes in rainfall intensity from high to low over a long duration of time lead to drought. Water scarcity impacts all aspects of life and the economy [7, 8]. Floods, landslides and drought are related with the characteristics of local rainfall as a consequence of climate change. The Climate change impacts the changes in hydrological cycle and water availability in reservoirs [9], the frequency and extent of flooding [6], and also makes it difficult to form reservoirs operating patterns [10].
The agricultural sector is directly affected [11], so food security is very vulnerable to this disaster, both droughts in the dry season and flooding in the rainy season. Failure to harvest can occur due to lack of water, as well as when the plants approaching the harvest hit by flooding. The agricultural sector is very dependent on climatic conditions and its variability that can change agricultural ecosystems, which have an impact on agricultural production and food security [12]. Deforestation in the Muria Mountain by human activities in land use can trigger a potential of hydrometeorology disasters in reservoir areas at any time [13]
Reservoir operation patterns in Indonesia are based on the results of rainfall estimates [14], so that an understanding of the characteristics (volatility, trends, patterns) of local rainfall [15] is needed in its preparation. This article contains the results of research aimed at identifying and analyzing the volatility of local rainfall and its predictions in the future in rain-fed reservoirs. Local rainfall is a key component of climate, changing patterns and intensity having a direct impact on the availability of water in rain-fed reservoirs. The results of this research provide a very important and valuable input on sustainable management of water resources and planning for hydrometeorology disaster mitigation strategies [3, 5]. The Gembong Reservoir, built in 1933, is very vulnerable to climate change, especially the local rainfall volatility.
Therefore, the main discussion in this article includes (1) detecting and analyzing the characteristics of local rainfall in the Gembong reservoir area, (2) predicting local rainfall using a time series forecasting model, (3) identifying a potential hydrometeorology disaster, and (4) conclusions.
2. Methods
2.1. Study Area
Gembong Reservoir belongs to Gembong District, Pati Regency, Central Java Province, Indonesia and on the eastern of Mount Muria with altitude of 500-1000 meters above sea level. Gembong Reservoir is located on 06041’47.99” South Latitude and 110057’21.79” East Longitude. The main benefit of this reservoir is as irrigation water supply to agricultural land area of around 4,606 ha. The Gembong Reservoir was chosen as the location of the study because it was the same age as the Situ Gintung Reservoir, Banten, Indonesia, which had experienced a flash flood disaster. The tragedy occurred on March 27, 2009 not only due to rainfall factors but also by the age of the old embankment [16].
2.2. Research Design
Daily rainfall data from the rainfall gauge station in the Gembong reservoir area in 2007-2019 was obtained from the reservoir operator’s daily records through observation. Raw data is then presented in an Excel worksheet. It was processed and analyzed by using the Statistics methods. Software R version 3.6.1 for descriptive statistics dan Minitab version 17 for forecasting.
Rainfall volatility analysis is based on calculating the coefficient of variation (CV), the standardized precipitation anomaly index (SPAI), and the precipitation concentration index (PCI) [17], while the trend is analyzed by using Mann-Kendall (MK) test [2,18-21]. SPAI was used to display quantitative analysis related to changes in rainfall and identify potential floods or droughts [8, 22], where rainfall is seasonal and periodic in a monsoon-dominated climate context [23], like the climate in Indonesia. The PCI is an important feature in water resource management planning, prediction or serves as a warning tool for potential hydrometeorology disasters [24]. A positive value of Z-statistic indicates that there is the upward trend in time series data and vice versa [3].
The ARIMA (Autoregressive Integrated Moving Average)-Box Jenkins method is one of the prediction methods that is often applied for the prediction of rainfall time series data [25, 26]. In this research, the ARIMA model for wet months is used for forecasting. The MASE (Mean Absolute Scaled Error) value measures the accuracy of the prediction, because there are zero data in the dry month [27].
3. Results and Discussion
3.1. Description
The results of in-depth interviews with the community around the reservoir, sub-district and village officials, reservoir operator and reservoir care communities, and observations onsite confirm that there are no spring water sources in the river basin. This statement confirms that Gembong Reservoir is a rain-fed reservoir. The daily local rainfall graph in the Gembong Reservoir area is presented in Figure. The pattern of each year illustrates the form of periodic sinusoidal waves as generally occurs in other countries [3], although extreme rainfall of 425 mm occurred at the beginning of the month in 2018. Extreme fluctuations of rainfall increase the inflow of the river into the reservoir. Such conditions have the potential for flooding [5, 6].
Descriptive statistics in Table 1 can explain the average rainfall on the Gembong Reservoir has a wide data distribution. It shows the interval of changes in the rise and fall of the local daily rainfall is wide. Rainfall in the Gembong Reservoir has fluctuations in the data distribution is quite large. Table 2 shows the maximum rainfall occurring in January. as in Figure 1.
|
Table 1. Descriptive Statistics of Rainfall (2011-2018)
|
3.2. Analysis of rainfall trends and volatility in the Gembong Reservoir
Non-parametric tests are used to detect trends where the results are shown in Table 2. Results on Table 2 explain that the largest CV occurred in August and September, which shows that the variability between years is greater than in other months, but it has the smallest volatility. The level of variability in rainfall events is high according to the classification developed by Hare [2]. At the significance level , the rainfall data do not follow monotonic trend patterns at all months. Only in January, August and December, it was significant with , with approaching the pattern of ascending monotonic trends. It illustrates that the rainfall data fluctuate with the uncertainty in the sense of the monotonic trend patterns.
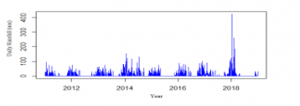
Figure 1: Daily Rainfall on Gembong reservoir 2011-2019
|
Table 2: Rainfall characteristics at Gembong station
Note: * statistically significant at the level of significance |
||||||||||||||||||||||||||||||||||||||||||||||||||||||||||||||||||||||||||||||||||||||||||||||||||||||||||||||||||||||||||||||||||
|
Table 3: Classification of meteorological drought severity
|
|||||||||||||||||||||||||||||||||||||||||||||||||||||||||||||||||||||
Volatility, the magnitude of fluctuations in rainfall data measured using standard deviations, values ranging from 4 to 32. January has the highest volatility value by 31.7 with an upward monotonic trend (Z>0) with significance level. Likewise, in the month of December, however, the value of volatility is smaller than January by 18.7. In June, October and November, it has an upward trend (Z>0) but does not follow a monotonic trend pattern. August has a downward monotonic trend with a level of significance, while in other months it has a downward trend but does not follow a monotonic trend pattern. Based on the calculation of rainfall anomalies standardized as Z in Table 2, the severity class of meteorological drought is presented in Table 3. It can be seen that severe meteorological drought is occurred only in August
A strong indicator for the distribution of temporal rainfall is shown by PCI [17, 20]. Table 4 present the annual PCI values based on monthly rainfall data each year. The classification criteria using the criteria introduced by Oliver in 1980 [21] are presented in Table.5. The average PCI in the 2007-2018 periods was 19.67, which was classified as a high concentration of rainfall. Table 5 shows those 9 out of 12 years have a heterogeneous distribution of rainfall, so the occurrence of rainfall is less predictable. In 2018, extreme rainfall was confirmed, as shown in Figure. Furthermore, the amount of rainfall for the future is predicted using the time series model [26]. Therefore, forecasting local rainfall in the wet months is needed to analyze the potential for hydrometeorology disasters.
|
Table 4: The Annual PCI 2007-2018
|
|||||||||||||||||||||||||||||
|
Table 5: The PCI Classification
Note: *Processing results based on Oliver’s criteria |
|||||||||||||||||||||||||||||
3.3. ARIMA modeling for wet months
In this modeling, wet months are months where rainfall exceeds 100 mm/ month, otherwise called dry months. Modeling is based on rainfall data in the Gembong reservoir in 2007-2018, while testing uses rainfall data for 2019. The iterative steps that have been carried out in ARIMA modeling for the wet month include:
- Data stationary test shows that the rainfall data of the Gembong reservoir is stationary in the mean.
- The charts of the autocorrelation function( ACF) and partial autocorrelation function (PACF) describe that the Autoregressive (AR) model was interrupted at lag 3, 4 and the Moving Average (MA) model was also interrupted in lag 3, 4. Therefore, the possible ARIMA models are ARIMA([3, 4], 0, [3, 4]), ARIMA([3, 4], 0, 0) or ARIMA(0, 0,[3, 4]).
- Testing parameter in the AR model. The hypothesisH0: (the parameter is not significant in the model) is rejected based on the t test statistic with level of significance . Table 6 displays the test results for significance of the model parameters. The parameters of the ARIMA ([3, 4], 0, 0) or ARIMA (0, 0, [3, 4]) are significant.
- The white-noise process can be detected using the residual autocorrelation test in its error analysis, which is detecting whether there is a residual correlation between lags. The H0 hypothesis is rejected with level of significance . The ARIMA([3,4], 0,0) has the R2 greater than the ARIMA(0.0, [3,4]).
- The ARIMA([3,4],0,0) or AR([3,4]) model was chosen as the best model because it fulfills all assumptions. Based on the coefficient values in Table 6, the ARIMA([3,4],0,0) model can be written
|
Table 6: Test results for the significance of model parameters
|
|
Table 7: Validations and Forecasting
|
||||||||||||||||||||||||||||||||
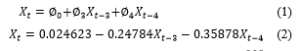
where Xt is the observation data at time t.
- The model is validated using rainfall data for 2019. Because there is monthly rainfall data that is the amount of 0 (dry season), then forecasting accuracy is based on value of MASE studied in [27]. Table 7 presents the model validations and forecasting.
The calculation results show that the MASE value is smaller than one, which indicates it is a good forecasting [27]. Forecasting results show that the accumulation of average rainfall in a wet month is increased by 17%. This condition can trigger a hydrometeorology disaster in the reservoir area.
3.4. Potential of Hydrometeorology Disasters
Analysis of rainfall data is also intended to be able to assess the dynamics of extreme fluctuations in rainfall. Potential of hydrometeorology disasters generally occur in extreme conditions that cause very heavy rain to fall in a short time or long drought. From Figure, an extreme rainfall was occurred on the Gembong Reservoir area in 2018. Therefore, studies in extreme conditions need to be conducted in order to anticipate the potential hydrometeorology disasters.
From Table 2, the volatility value is ranging from 4 to 32, and the rainfall data fluctuate with an uncertainty of the monotonic trend patterns. This condition of rainfall that fluctuate in this way with irregular changes between water abundance and water scarcity make it difficult to manage water allocation [4]. Changes in rainfall patterns and intensity have a direct impact on the availability of water in reservoirs, which has the potential of hydrometeorology disasters. Increased rainfall trends can lead to an increase in the frequency of floods, but a downward trend can increase meteorological drought [23, 28]. Hydrological behavior in catchments is influenced by changes in local rainfall patterns that trigger erosion [15]. Uncertainty in local rainfall trend patterns makes it more difficult to anticipate disaster risk. The capacity of the Gembong Reservoir as a rain-fed reservoir experiences environmental stress [13, 29]. The pressure is even greater with the uncertainty of this rainfall trend pattern, and the occurrence of rainfall is less predictable. Its condition will complicate the management of reservoir water availability.
According to the classification in Table 5, the frequency of both High and Very High Concentration of Rainfall is 75%, and there is no Low Concentration. This high concentration triggers erosion and landslides [15, 24], the material of which will increase sedimentation in reservoirs and upstream reservoirs. The smaller the capacity due to increased sedimentation and is triggered by high rainfall concentrations, the chance of flooding through the watershed or even the sinking Gembong reservoir will increase. When rain with high intensity flushes the slopes of Muria experienced deforestation and land conversion in the catchment area, the absorption capacity of rainwater in the area is getting smaller, resulting in erosion and the material conducted by water flow on the slopes of Mount Muria which is included in the Gembong District area of 342 ha [30]. The occurrence of a flash floods caused by a broken embankment in Situ Gintung on March 27, 2009is a warning to raise awareness [16].
Potential of hydrometeorology disasters can be caused by the inability of a reservoir to collect direct rainwater or surface water from a watershed. When the flow of inflow and precipitation into the reservoir exceeds the reservoir capacity, it will overflow through the spillway which has the potential to cause flash floods. The results of in-depth interviews with community leaders confirmed that there was a flash flood in 2006 that affected settlements adjacent to the river that tipped on the slopes of Muria. The flash floods occurred due to the upstream river on the slopes of Mount Muria being unable to support rainwater, what if the Gembong Reservoir which volume of water is 9.5 million meters3 is broken down? In fact, the Situ Gintung tragedy occurred with a volume of water of around 2.1 million m3 which caused huge losses and caused many casualties [16].
When the water inflow discharge and precipitation into the reservoir do not exceed the capacity, even smaller than the capacity, there will be a shortage of water that starts a drought. Lack of water will result in drought in the area of irrigation. Forecasting results with the ARIMA model for wet months show that an increase of 17% in 2020 (Table 7). The average PCI is high (Table 4) and the reservoir capacity that is shrinking due to sedimentation will increase the potential for flooding. The potential for flooding is greater than the potential for drought, especially since the reservoir is getting older.
Conservation of the catchment areas and protected forests to increase the absorption capacity of rainwater on the slopes of Mount Muria is prioritized as flood mitigation strategy in the highlands. Directives for the management of protected areas have been outlined in the Pati Regency Spatial Planning in 2010-2030 [30]. Protecting forest conservation should be implemented immediately when the mountainous area is not yet barren and loses the topsoil.
4. Conclusions
The characteristics of local rainfall in the Gembong reservoir area based on empirical studies with statistical methods are (1)volatility of rainfall with irregular changes in high variability between maximum and minimum rainfall, (2) there is no extreme meteorological drought, (3) rainfall trends follow fluctuating patterns and do not follow monotonic trends with a significance level , but high rainfall concentrations have the potential to cause erosion or flooding, (4) forecasting with the ARIMA model for wet months shows that there is an increase in rainfall accumulation. The ARIMA’s prediction results warn that the vigilance against potential flood disasters is greater than the potential for drought disasters.
These findings indicate that the Gembong Reservoir is sensitive to climate change and vulnerable to potential hydrometeorology disasters.. Preparation of mitigation strategies is more directed at reducing the risk of flooding because rainfall is not the only environmental factor that causes disasters. Disaster mitigation strategies need to pay attention to other triggering factors, such as reservoir infrastructure and surrounding land use. Reducing sedimentation in watersheds and reservoirs, accelerating conservation of water catchment areas and reforestation of protected forests on the slopes of Mount Muria are mitigation strategies on flood that can be preferred at this time.
Conflict of Interest
The authors declare no conflict of interest.
Acknowledgment
Authors thank Universitas Diponegoro for funding this research through RPP Research Grant 2019 contract: 329-55/UN7.P4.3/PP/2019.
- IPPC, Climate Change 2007: Impacts, Adaptation and Vulnerability, Cambridge University Press, Cambridge , USA, 2007
- A. Asfaw, B.Simane,, A.Hassen, A.Bantider, “ Variability and time series analysis of rainfall and temperature in northcentral Ethiopia: A case study in Woleka sub-basin”, Weather and Climate Extremes 19, 29-41,2018. https://doi.org/10.1016/j.wace.2017.12.002.
- R. Mahmood.,S. Jia, W. Zhu.,” Analysis of climate variability, trends, and prediction in yhe most active parts of the Lake Chad basin, Africa”, Scientific Reports 9:6317, 2019 https://doi.org/10.1038/s41598-019-42811-9
- A. Kuhn, W. Britz, D.K.Willy, P.van Oel, “Simulating the viability of water institutions under volatile rainfall conditions- The case of the Lake Naivasha Basin”, Environmental Modlling & Software 75, 373-387,2016. http://dx.doi.org/10.1016/j.envsoft.2014.08.021.
- L.Malinowski, I.Skoczko, “Impacts of Climate Change on Hydrological Regime and Water Resources Management of the Narew River in Poland”, Jounal of Ecological Engineering 19(4), 167-175, 2018. https://doi.org/10.12911/22998993/91672.
- S.Szewranski, J.Kazak, M.Szkaradkiewicz, J.Sasik, “Flood risk factors in suburnan area in the context of climate change adaptation policies-Case study of Wroclaw Poland”, Journal of Ecological Engineering 16(2), 13-18, 2015. doi:10.12911/22998993/1854
- Y.Uttaruk, T.Laosuwan, “Drought Detection by Application of Remote Sensing Technology and Vegetation Phenology”, Journal of Ecological Enginnering 18(6): 115-121, 2017. DOI:10.12911/22998993/76326.
- A.Lopez-Nicolas, M.Pulido-Velazquez, H.Macian-Sorribes, “Economic risk assessment of drought impacts on irrigated agriculture”, Journal of Hydrology 550:580-589, 2017. http://dx.doi.org/10.1016/j.jhydrol.2017.05.004.
- A.W.Salami, H. Ibrahim, A.O.Sojobi,” Evaluation of impact of climate variability on water resources and yield capacity of selected reservoirs in the north central Nigeria”. Environ. Eng. Res. 20(3): 290-297, 2015. http://dx.doi.org/10.4491/eer.2015.0041.
- N.Ehsani, C.J.Vorosmarty, B.M.Fekete, E.Z .Stakhiv, “ Reservoir operations undrr climate change: Storage capacity options to mitigate risk”, Journal oh Hydrology 555, 435-446, 2017. https://dx.doi.org/10.1016/j.jhydrol.2017.09.008.
- K.Ryzuma, E.Radzka,, T. Lenartowicz, “ The Impact of Precipitation Conditions on Medium-Early Cultivars of Potato Yielding”, Journal of Ecological Engineering 16(3): 206-210, 2015. DOI: 10.12911/22998993/2958.
- R.K.Rai, L.D.Bhatta, U.Acharya, A.P.Bhatta, “Assessing climate-resilient agricultural for smallholders”, Environmental Development xxx, 2018. http://doi.org/10.1016/j.envdev.2018.06.002.
- K.Kartono,P. Purwanto, S.Suripin, “Potential environmental pressures on water availability in Gembong reservoir in Pati District for the development of agropolitan area”, Journal of Physics:Conf.Series 1217- 012061, 2019. doi:10.1088/1742-6596/1217/1/012061.
- Government Regulation of the Republic of Indonesia number 37 of 2010 concerning Dams.
- E.Aydin, J.Antal, “Introduction to Precipitation Runoff Process and Soil Erosion Risk Analysis in a Specific Area of Interest to design Control Measures”, Journal of Ecological Engineering 20(2), 44-50, 2019. https://doi.org/10.12911/22998993/94921.
- B.Harsoyo, “Jebolnya Tanggul Situ Gintung (27 Maret 2009) Bukan Karena Faktor Hujan Ekstrem”, Jurnal Sains dan Teknologi Modifikasi Cuaca, 11(1), 9-17. 2010. http://ejurnal.bppt.go.id/index.php/JSTMC/article/view/2176/1814.
- E.Radzka, “Classification of Precipitation Intensity During Vegetation Season in Central-Eastern Poland (1971-2005)”, Journal of Ecological Engineering 15(3):51-55, 2014. DOI:10.12911/22998993.1109123
- A.Mondal, S.Kundu, Mukhopadhyay, “Rainfall Trend Analysis by Mann-Kendall Test: A case study of North-Eastern Part of Cuttack District, Orissa”, International Journal of Geology, Earth and Environmental Sciences ISSN:227-2081, 2(1):70-78, 2012. http://www.cibtech.org/jgee.htm.
- E.Gasiorek, E.Musial, ,”Evaluation of the precision of standardized precipitation index (SPI) based on years 154-1995 in Lodz”. Journal of Ecological Engineering 16(4): 49-53, 2015. https://doi.org/ 10.12911/22998993/59347
- K.Zhang , Y.Yao, X. Qian, J.Wang, “Various characteristics of precipitation concebtration index and its cause analysis in China between 1960 and 2016”, Int J Climatol; 1-11. 2019 https://doi.org/10.1002/joc.6092..
- B.Lamboni, L.A.Emmanuel, C.Manirakiza, Z.M.Djibib, “Variability of Future Rainfall over the Mono River Basin of West-Africa”, American Journal of Climate Change 8:137-155, 2019 http://www.scirp.org/journal/ajcc.
- A.H.Nury, K.Hasan, “Analysis of drought in northwestern Bangladesh using standardized precipitation index and its relation to Southern oscillation index”. Environ.Eng.Res. 21(1):58-68, 2016. http://dx.doi.org/10.4491/eer.2015.115.
- K.Chanda, R.Maity, “Meteorological drought quantification with standardized precipitation anomaly index for the regions with strongly seasonal and periodic precipitation”, J. Hydrol. Eng, 2015. doi:10.1061/(ASCE)HE.1943-5584.0001236.
- E.E.Ezenwaji, C.P.Nzolwu, G.N. Chima, “Analysis of Precipitation Concentration Index (PCI) for Awka Urban Area, Nigeria”, Hydrology Current Research 8(4), 2016. doi:10.4172/2157-7587.1000287
- W.W.S.William, “Time Series Analysis: Univariate and Multivariate Method”, New York : Pearson Education, Second Edition, 2006.
- J.Farajzadeh, A.F. Fard, S. Lotfi, “ Modeling of monthly rainfall and runoff of Urmia lake basin using “feed-forward neural network” and “time series analysis” model”, Water Resources and Industry 7-8, 38-48, 2014. http://dx.doi.org/10.1016/j.wri.2014.10.003
- R.J.Hyndman, A.B. Koehler, “Another look at measures of forecast accuracy”, International Journal of Forecasting 22, 679-688, 2006. doi:10.1016/j.ijforecast.2006.03.001
- C.M. Tfwala,, L.D van Rensburg, R.Schall, P.Dlamini, “ Drought dynamics and interannual rainfall variability on the Ghaap plateau, South Africa, 1918-2014”, Physics and Chemistry of the Earth 107:1-7, 2018. https://doi.org/10.1016/j.pce.2018.09.003.
- Pemali-Juana River Region Center, “ Final Report of the infrastructure investigation in the Gembong Reservoir on 2015”, 2015
- Pati Regency Regulation Number 5/2011 concerning Pati Regency Spatial Planning in 2010-2030