Improved Nonlinear Fuzzy Robust PCA for Anomaly-based Intrusion Detection
Volume 5, Issue 3, Page No 249-258, 2020
Author’s Name: Amal Hadri1,a), Khalid Chougdali2, Raja Touahni1
View Affiliations
1LASTID Laboratory, Faculty of Science, Ibn tofail University, Kenitra, Morocco
2GREST Research Group, National School of Applied Sciences (ENSA), Kenitra, Morocco
a)Author to whom correspondence should be addressed. E-mail: amal.hadri@uit.ac.ma
Adv. Sci. Technol. Eng. Syst. J. 5(3), 249-258 (2020); ![]() DOI: 10.25046/aj050332
DOI: 10.25046/aj050332
Keywords: KDDCup99, Principal Component Analysis, PCA, NFRPCA, IDS, Feature extraction methods, NSL-KDD
Export Citations
Among the most popular tools in security field is the anomaly based Intrusion Detection System (IDS), it detects intrusions by learning to classify the normal activities of the network. Thus if any abnormal activity or behaviour is recognized it raises an alarm to inform the users of a given network. Nevertheless, IDS is generally susceptible to high false positive rate and low detection rate as a result of the huge useless information contained in the network traffic employed to build the IDS. To deal with this issue, many researchers tried to use a feature extraction methods as a pre-processing phase. Principal Component Analysis (PCA) is the excessively popular method used in detection intrusions area. Nonetheless, classical PCA is prone to outliers, very sensitive to noise and also restricted to linear principal components. In the current paper, to overcome that we propose a new variants of the Nonlinear Fuzzy Robust PCA (NFRPCA) utilizing the popular data sets KDDcup99 and NSL-KDD. The results of the conducted experiments demonstrated that the proposed approaches is more effective and gives a promising efficiency in comparison to NFRPCA and PCA.
Received: 05 February 2020, Accepted: 10 May 2020, Published Online: 28 May 2020
1. Background
Thanks to the major shift in technology tools in the twenty first century, the complexity of network security has greatly increased, which gave birth to highly developed attacks. There are several traditional security methods like firewalls, data encryption and user authentication. Those techniques are insufficient to protect the network systems against all the existing threats. As a consequence, they may be less effective in detecting several dangerous attacks. Therefore, we need to strengthen our systems by adding more powerful systems such as intrusion detection system (IDS). The IDS protects the network systems by preventing the eventual damages that could be caused by an intrusion. Commonly, there is 2 principal categories of IDS, misuse-based and anomaly-based. The misuse-based method aim to classify an attack via comparing its signature with the attacks currently existing in a database of signatures of attacks and produce an alarm if any malicious activity is detected. The most two well-known misuse detection methods are STAT [1] and Snort [2]. This technique has proved its effectiveness in detecting the attacks stored in the datasets but it can not detects new intrusions or attacks and maintaining the databases is very expensive. Hence anomaly-based detection was initiated by Anderson [3] & Denning [4], the fundamental idea behind this concept is to specify the normal behaviour or model and generate an alarm if the difference between an observation and the defined model surpasses a threshold already defined. The uniqueness of this concept is its capability to categorize new and unusual intrusions.
Nonetheless, the current network traffic data, which are usually tremendous, are in fact a big challenge to anomaly based IDS. This type of traffic may decrease the whole detection mechanism and lead frequently to a falsified classification accuracies. This kind of huge dataset often have redundant and noisy data, that can be very difficult to model.
To address that, many feature extraction techniques have been used to increase network IDS efficiency. For instance, the paper [5] used a Discrete Differential Evolution to recognize the most important features. The detection accuracies were enhanced significantly. Likewise, the work [6] presented an IDS that can detect several attacks by exploring just a small number of features, the algorithm utilized is called Ant Colony Optimization algorithm. In [7] the authors used a feature selection method called cuttlefish which suppress the noisy and redundant data and simultaneously guarantee the quality of data. The authors of [8] proposed to utilize
the Principal Component Analysis (PCA) and Fuzzy Principal Component Analysis (FPCA) as a pre-processing step, before applying the k nearest neighbor (KNN) classifier, the same authors suggest in another publication [9] an improved variant method called Robust Fuzzy PCA. The acquired results show the promising performance of the technique proposed with regard to network attacks detection, as well as false alarms reduction.
Neverthless, PCA [10]-[12] and its linear variants are known to be sensitive to noise and outliers, which can impact on the deriving
principal component (PCs) [13], therefore they effect as well the results of classification. In addition to that, PCA allows uniquely a linear dimensionality reduction [14]. Hence, in the case of complicated structures like nonlinear structures, the data will not be correctly expressed in a linear space, linear variants of PCA will not be the optimal solution. To deal with this issue, NFRPCA (Nonlinear Fuzzy Robust PCA) [15] was suggested to calculate PCs by utilizing a non-linear technique.
Nevertheless, this method is based on the L2-norm that is highly sensitive to outliers and it also squares the error, and so the model can have a much bigger error. So as to tackle this issue, we introduce a new variant of NFRPCA called Lp-norm NFRPCA. Note that this paper is an extension of work originally published in 2018 IEEE 5th International Congress on Information Science and Technology (CiSt) [16], in that work we suggested a variant of NFRPCA employing L1-norm rather than the classical Euclidian norm. In this paper, we propose another variant of NFRPCA using Lp-norm, we conducted new experiments besides the ones previously proposed in [16].
The remainder of this paper is structured as follows: Section 2 deliver a brief presentation of PCA, Section 3 will present an overview of NFRPCA. We present the suggested techniques in Section 4, Section 5 is dedicated to give shortly an overview of the two popular datasets namely KDDcup99 and NSL-KDD. Section 6 presents the conducted experiments and discuss the results and conclusions are summarized in section 7.
2. Principal Component Analysis Method
Principal Component Analysis (PCA) [17] is as an exploratory data analysis tool that involves a dataset with observations on variables, it was employed extensively in several research areas. The principal concept of PCA is to change data into a downsized form and preserve most of the initial variance from the original data at the same time. In other terms, PCA major role is to change variables n that were correlated into uncorrelated state d, the uncorrelated variables d are usually called the principal components (PCs) [14] [18].
Consider we already have a data set of M vectors v1, v2, v3,…., vM where each vector is represented by N features. To obtain the PCs we comply to the strategy explained through the steps underneath:
- Compute the mean µ of the data set
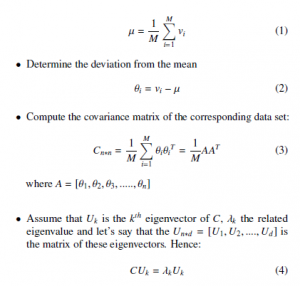
- Sort the Eigenvalues in decreasing order, hence pick the eigenvectors (known as principal components PCi)that have the largest Eigenvalues. We can compute the number of PCs that we could keep as follow:
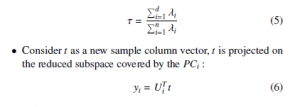
3. Nonlinear Fuzzy Robust pca (nfrpca) Method
The Nonlinear fuzzy robust principal component analysis employed in the current paper was suggested initially by Luukka in [15]. It was inspired from the robust principal component techniques that Yang & Wang proposed in [19] that fundamentally introduced by Xu
& Yuilles techniques [20] where PCA learning rules are associated to energy functions and they proposed a cost function in regard to outliers. In Yang & Wang’s proposed methods the cost function was modified to be fuzzy and it involved Xu & Yuilles techniques as a particular case. We introduce briefly these methods in this section. Xu and Yuille [20] suggested an objective function, based on ui ∈ {0,1}:

The variables are defined as follows: η is the threshold, U = {ui|i = 1,,n} is the membership set, & X = {x1, x2,…., xn} is the dataset.
The principal objective is to minimize E(U,w) with regard of ui & w.
It should be noted that w is a continuous variable and ui is a binary variable that engender optimization challenging to resolve with a gradient descent technique. To solve the problem employing the gradient descent technique the minimization problem is simplified into maximization of Gibbs distribution as underneath:

Where Z is the partition function confirming PU Rw P(U,w) = 1. The measure e(xi) might be, e.g. one of the below functions

subject to ui ∈ [0,1] and m1 ∈ [1, ∞). Now ui is the membership value of xi associated to the data cluster and (1 − ui) is the membership value of xi associated to the noise cluster and m1 is the fuzziness variable. And e(xi) is the error between the class center and xi.
As ui is a continuous variable now, the complexity of an amalgamation of continuous and discrete optimization could be obviated and the gradient descent technique can be employed.
The gradient of E(15) is calculated with regard to ui. By choosing δδuEi = 0, we obtain
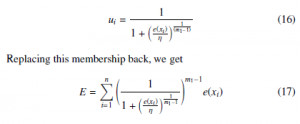
The gradient with regard to w would be
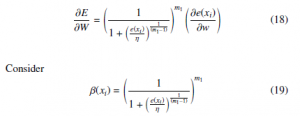
right now η is a though threshold in this situation. The setting
of m1 has no rule. We sum up NFRPCA steps in Algorithm1.
Algorithm 1 NFRPCA algorithm
Step 1: At first set the count of iteration t = 1, bound of iteration T, learning coefficient α0 ∈ (0,1] soft threshold η to a very small positive value then initialize in random way the weight w. Step 2: As long as t is smaller than T, do steps 3-9.
Step 3: Calculate αt = α0(1 − t/T) , set i = 1 and σ = 0.
Step 4: As long as i is smaller than n, do steps 5-8
Step 5: Calculate y = wT xi, u = yw and v = wTu.
Step 6: Calculate g(y), F = dyd (g(y)), e3(xi) = xi − woldg(y), then the
weight is updated: wnew = wold + αt(xieTwoldF + e3(xi)g(y))
In [15] g(y) was selected to be a sigmoid function such as g(y) = tanh(10y), F is the first derivative of g(y).
4. The Proposed Methods
4.1 Nonlinear Fuzzy Robust L1-norm PCA method
We can clearly remark that, NFRPCA technique utilize an Euclidian norm for computing the reconstruction error in (13), and it is widely recognized that the Euclidian norm usually squares the reconstruction error, thus the approach have a much bigger error. Consequently, this could falsify the results and deteriorate the quality of solutions.
For the sake of addressing this issue, the paper [16] suggest utilizing L1-norm to compute the reconstruction error.
The reconstruction error equation could be re-written as below:

Where :F0 = dyd0 (g(y0)).
Equally as in algorithm 1, we utilize updating weight to compute the PCs.
Algorithm 2 L1-NFRPCA algorithm
Step 1: At first set the count of iteration t = 1, bound of iteration T, learning coefficient α0 ∈ (0,1] soft threshold η to a very small positive value then initialize in random way the weigh w.
Step 2: As long as t is smaller than T, do steps 3-9.
Step 3: Calculate αt = α0(1 − t/T) , set i = 1 and σ = 0.
Step 4: As long as i is smaller than n, do steps 5-8
Step 5: Calculate y0 = w0T xi, u0 = y0w0 and v0 = w0Tu0.
Step 6: Calculate g(y0), F0 = dyd0 (g(y0)), e30(xi) = xi − w0oldg(y0), then the weight is updated: w0new = w0old +αt(xie0Tw0oldF0 +e03 (xi)g(y0))
In the proposed algorithm g(y0) was picked to be sigmoid like the function g(y0) = tanh(10y0), & F0 is the first derivative of g(y0). We use the term L1-norm NFRPCA to refer to this technique in the rest of this paper.
4.2 Nonlinear Fuzzy Robust Lp-norm PCA method
The technique that we suggest is Lp-norm NFRPCA where we propose to substitute the L2-norm with generalized Lp-norm in the computation of the reconstruction error, in order to minimize the large error that L2-norm can cause. The reconstruction error equation would be re-written as follow:
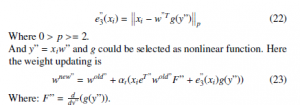
Where: F” = dyd”(g(y”)).
In the same way as in algorithm 1, we use the updating weight to compute the PCs. Finally the main steps of the proposed method is summarized in Algorithm 3.
Algorithm 3 Lp-norm NFRPCA algorithm
Step 1: At first set the count of iteration t = 1, bound of iteration T, learning coefficient α0 ∈ (0,1] soft threshold η to a very small positive value then initialize in random way the weight w”.
Step 2: As long as t is smaller than T, do steps 3-9.
Step 3: Calculate αt = α0(1 − t/T), set i = 1 and σ = 0.
Step 4: As long as i is smaller than n, do steps 5-8
Step 5: Calculate y” = w”T xi, u” = y”w” and v” = w”Tu”.
Step 6: Calculate g(y”), F” = dyd”(g(y”)), e”3(xi) = xi − w”oldg(y”), then the weight is updated: w”new = w”old + αt(xie”Tw”oldF” + e”3(xi)g(y”))
The function g(y”) was picked to be sigmoid function, such as g(y”) = tanh(10y”), and F” is the first derivative of g(y”). We use the term Lp-norm NFRPCA to refer to this technique in the rest of this paper.
5. The Simulated Datasets and its Preprocessings
5.1 Datasets
In the experiments we conducted, the popular public intrusion data sets were used, they are called KDDcup99 and NSL-KDD. We present them shortly in the next subsections.
5.1.1 KDDCup99 Dataset
KDDCup99 [21, 22] is a dataset that contains many TCPdump raws, that was captured during 9 weeks. This dataset was prepared and still conducted by Intrusion Detection Evaluation Program called DARPA. The main aim of KDDCup99 is to establish a generalized data set to examine researchs in intrusion detection field.
The training data set represents 4 gigabytes of data compressed (most of it is binary TCP dump), it contains 4,898,431 records, while the test dataset contains around 311,029 connection records and each record in dataset contains exactly 41 features. The attacks existing in KDDCup99 are categorized as underneath:
- Denial of Service (DoS): cyber-attack where the perpetrator attempt to consume network or machine resources to make it unavailable or limited to its legitimate users.
- Remote to Local (R2L): Where the attacker control the remote machine pretending that he is a user of the system, by exploiting the system vulnerabilities.
- User to Root (U2R): by exploiting the vulnerabilities and the flaws existing in a machine or on a network, the hacker tries to start accessing from a normal user account as to get the root access privilege to the system.
- Probing: The intruder tries to collect useful information of all services and machines existing in the same network to exploit it later.
5.1.2 NSL-KDD Dataset
The NSL-KDD [23] data set has been created to alleviate a couple of the major shortcoming of the KDDCup99 data set. This new version has some improvement compared to KDDCup99 data set and has solved a few of its fundamental issues. The main advantages of NSL-KDD are as follow:
- It suppressed redundant instances in the trainining set.
- The test dat set does not contain replicate records.
- The current version allow us to use the whole data set. Correspondingly, the random selection method will be needless because of the reduction of the number of instances in both train set and test set. Consequently, the accuracy and consistency of the evaluation and review of research works will increase.
- Every complexity level group involve a couple of instances that is oppositely corresponding to the percentage of instances in the KDDCup99 dataset. Therefore, we obtain more realistic examination of various machine learning techniques.
5.2 Normalization Phase
The normalization phase is more than important, because it allow us to apply the techniques cited above on the data set in a correct manner. To perform effectively this phase, we replaced the discrete values with continuous values for all the discrete attributes existing in the data sets through the same process used in [10], the process is briefly clarified as follow: for every attribute y that acceptes x variant values. The attribute y is illustrated by x coordinates contains zeros and ones. E.g., the attribute of the protocol type, that acceptes three, values i.e. tcp, udp or icmp. Utilizing this logic, these values are modified to the following coordinates (1,0,0), (0,1,0) or (0,0,1).
6. Experiments and Discussion
In the current part of this paper, several experiments were performed to examine the efficiency of the suggested method utilizing KDDcup99 and NSL-KDD databases, for the sake of evaluating the effectiveness of the suggested technique. We compute the measures: detection rate (DR), F-measure and false positive rate (FPR) described underneath:
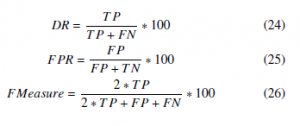
When :
- An intrusion is successfully predicted we call it a True positives (TP).
- An intrusion is wrongly predicted we call it a False negatives (FN).
- A normal connection is wrongly predicted we call it a False positive (FP).
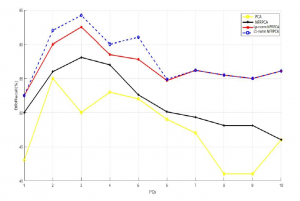
Figure 1: detection rate vs. PCs using KDDcup99 dataset
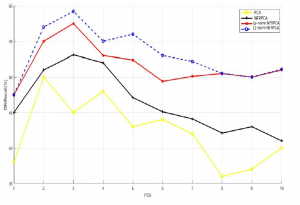
Figure 2: detection rate vs. PCs using NSL-KDD dataset
- A normal connection is correctly predicted we call it a True negatives (TN).
The classifier that was utilized in all our conducted experiments is the nearest neighbor, and for the sake of obtaining more trustworthy results we computed the average of twenty runs. The highest robust feature extraction technique must have the highest DR and F-measure rates and as much as possible the lowest FPR rate. The simulation settings used in our first experiments are as follow: for the training sample we randomly selected 1000 normal, 100 DOS, 50 U2R, 100 R2L and 100 PROBE as for the test sample we have this structure: 100 normal data, 100 DOS data, 50 U2R data, 100 R2L data and 100 PROBE also choosed randomly using the test database. So as to both KDDcup99 and NSL-KDD data sets the settings of the simulation are similar. Also the value of p is set to 0.5 in all our experiments.
During our first experiments and to choose the ideal number of prinicipal components(PCs) for all the feature extraction techniques which helps drastically to raise F-measure and detection rate (DR) and decrease FPR, examine and make a comparaison between PCA, NFRPCA, L1-NFRPCA and Lp-norm NFRPCA. To achieve that, we have performed PCA, NFRPCA ,L1-NFRPCA and Lp-norm NFRPCA to train our model first. Consequently, we obtained the PCs. The number of principal components PCs represent the dimension of the new downsized samples. Furthermore, the test sample is proojected on the new downsized subspace established via the PCs.
The aim of our first experiment is to compute the measures detection rate, F-measure and false positive rate for each single principal component through choosing 10 of 41 principal component and changing their number iteratively throughout the test. We can observe clearly in the Figure.1 and Figure.2 in both datasets KDDCup99 and NSLKDD the L1-NFRPCA and Lp-norm NFRPCA takes the lead over the original NFPRCA and the linear PCA which is very logical.
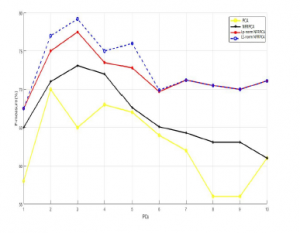
Figure 3: F-measure vs. PCs using KDDcup99 dataset
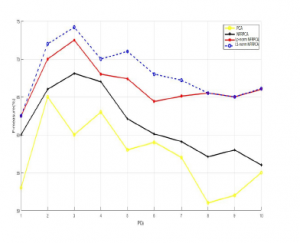
Figure 4: F-measure vs. PCs using NSL-KDD dataset
Following the previous concept, we computed the F-measure by increasing the number of PCs. As we can see from the Figure.3 and Figure.4, for both datasets the L1-NFRPCA and Lp-norm NFRPCA got the highest values for the F-measure comparing to the original NFRPCA and the classical PCA which support our previous results.
And so as to calculate the false positive rate (FPR), all the algorithms cited above were implemented, but only the proposed algorithms (L1-NFRPCA and Lp-norm NFRPCA) who has the lowest FPR for both datasets, as we see clearly in the figures (Figure 5 and Figure 6).
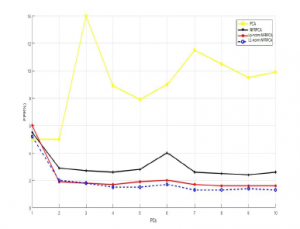
Figure 5: FPR vs. PCs using KDDcup99 dataset
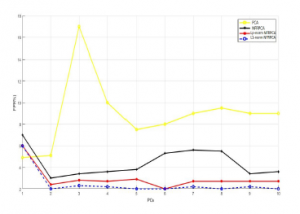
Figure 6: FPR vs. PCs using NSL-KDD dataset
Table 1: DR of Attacks for PCA, NRFPCA, L1-NRFPCA and Lp-norm NFRPCA using KDDCup99 dataset
| Method | DOS | U2R | R2L | Probing | |
| DR (%) | PCA | 68,6656 | 8,6923 | 4,7734 | 92,1121 |
| NRFPCA | 72,1123 | 14,4615 | 4,1165 | 90,2345 | |
| L1-NRFPCA | 73,1993 | 15,9815 | 4,1775 | 91,8325 | |
| Lp-norm NRFPCA | 74,2314 | 16,1111 | 4,5556 | 92,1211 |
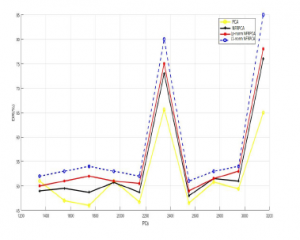
Figure 7: detection rate vs. Training data using KDDcup99 dataset
In the second stage of our experiments, we intend to examine all the techniques cited above under a wide range of different training dimensionnality, and examine their impact on the DR, FPR, and F-measure. To achieve that, the structure of the test data set was kept intact by fixing it at 100 normal connections, 100 DOS, 50 U2R, 100 R2L, and 100 PROBE.
Concerning DR, Figure.7 and Figure.8 assert that the proposed methods produce a detection rate higher than the original ones. It proves that the methods are very powerful in differentiating between normal connections and attacks.
In Figure.9, Figure.10, we can clearly see that the L1-NFRPCA achieve at least 5% improvement over Lp-norm NFRPCA, 10% over original NFRPCA and the classical PCA, the new approaches surpasses permanently the original techniques. In terms of FPR,the Figure.11 and Figure.12 show that the L1-NFRPCA still gives the lowest FPR even under different dimensionnality. These results support the great capability of the new approaches to classify the connections autonomously of the training samples size.
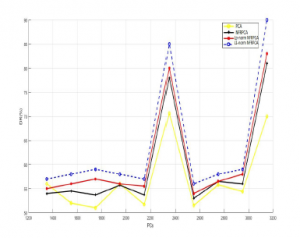
Figure 8: detection rate vs. Training data using NSL-KDD dataset
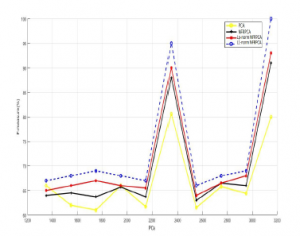
Figure 9: F-measure vs. Training data using KDDcup99 dataset
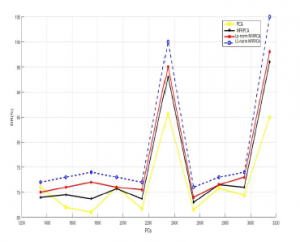
Figure 10: F-measure vs. Training data using NSL-KDD dataset
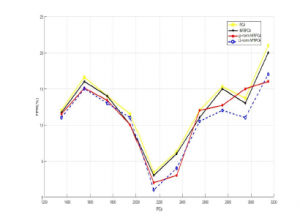
Figure 11: FPR vs. Training data using KDDcup99 dataset
L1-NRFPCA and Lp-norm NFRPCA for U2R and DOS attacks are often the highest compared to U2R and DOS attacks of NRFPCA and PCA.
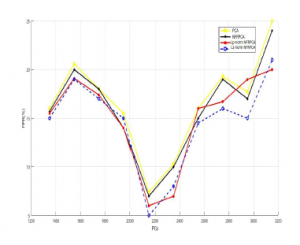
Figure 12: FPR vs. Training data using NSL-KDD dataset
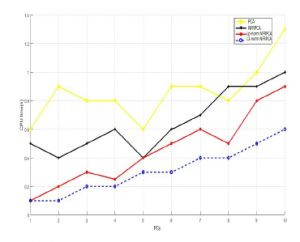
Figure 13: CPU time(s) vs. PCs using KDDCup99 dataset
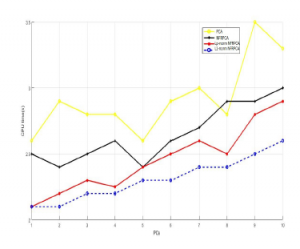
Figure 14: CPU time(s) vs. PCs using NSL-KDD dataset
7. Conclusion
As several linear statistical techniques Principal Component Analysis (PCA) has many shortcoming, it is limited just to Gaussian distribution and it has basically a high sensitivity to noise. In addition to that, principal components are frequently damaged by outliers, therefore feature extraction utilizing PCA are not credible if outliers exits in data. To tackle this issue, we proposed an effective new variants of nonlinear feature extraction techniques called Nonlinear Fuzzy Robust PCA for anomaly-based intrusion detection. The experiments performed on the popular databases (KDDcup99 and NSL-KDD), approved the effectiveness of the suggested approaches, the New variants outperfom NFRPCA and PCA in the detection of the most categories of attacks and in reducing the false positive alarms.
Conflict of Interest
The authors declare no conflict of interest.
Acknowledgment
This work is supported by CNRST-MOROCCO under the excellence program, grant no. 15UIT2016.
- E. Spafford and S. Kumar, A software architecture to support misuse intrusion detection, in Proceedings of the 18th National Information Security Conference, 1995, pp. 194-204.
- B. Caswell and J. Beale, Snort 2.1 intrusion detection. Syn- gress, 2004.
- J. P. A. Co, Computer Security Threat Monitoring and Surveil- lance, 1980.
- D. E. Denning, Intrusion-Detection Model, IEEE Trans. Softw. Eng., vol. SE-13, no. 2, pp. 222-232, 1987.
- E. Popoola and A. O. Adewumi, Efficient feature selection tech- nique for network intrusion detection system using discrete differential evolution and decision.,” International Journal Net- work Security, vol. 19, no. 5, pp. 660-669, 2017.
- M. H. Aghdam and P. Kabiri, Feature selection for intrusion detection system using ant colony optimization,” International Journal Network Security, vol. 18, no. 3, pp. 420-432, 2016.
- A. S. Eesa, Z. Orman, and A. M. A. Brifcani, A novel feature- selection approach based on the cuttlefish optimization algo- rithm for intrusion detection systems,” Expert Systems with Applications, vol. 42,no. 5, pp. 2670-2679, 2015.
- A.Hadri, K.Chougdali and R.Touahni,Intrusion detection sys- tem using PCA and Fuzzy PCA techniques, in the proceeding of the Interntional Conference on Advanced Communication Systems and Information Security (ACOSIS), 17-19 October 2016, Marrakesh, Morocco.
- A.Hadri, K.Chougdali and R.Touahni, Identifying intrusions in computer networks using Robust Fuzzy PCA, in the proceeding of the IEE/ACS 14th International Conference on Computer Systems and Applications (AICCSA), 30 October-3 November 2017,Hammamet , Tunisia.
- Y. Bouzida and N. Cuppens-boulahia, Efficient Intrusion De- tection Using Principal Component Analysis. pp. 381-395. 2004
- M.-L. Shyu, S.-C. Chen, K. Sarinnapakorn, and L. Chang, A novel anomaly detection scheme based on principal compo- nent classifier, Miami Univ. Dept Electr. Comput. Eng. Tech. Rep, 2003.
- W. Wang and R. Batitti, Identifying intrusions in computer networks with principal component analysis, 2006, p. 8.
- L. Xu and A. L. Yuille, Robust principal component analysis by self-organizing rules based on statistical physics approach, IEEE Trans. on Neural Net., vol. 6, no. 1, pp. 131-143, 1995.
- R. L. Kashyap, M. J. Paulik, N. Loh, A. Automation, A. K. Jain, G. M. Jenkins, S. Francisco, and L. Sirovich, Application of the Karhunen-Lokve Procedure for the Characterization of Human Faces, vol. 12, no. 4, 1990.
- P. Luukka, A New Nonlinear Fuzzy Robust PCA Algorithm and Similarity Classifier in Classification of Medical Data Sets, Int. J. Fuzzy Syst., vol. 13, no. 3, pp. 153-162, 2011.
- Amal HADRI, Khalid Chougdali, and Raja Touahni.”A Net- work Intrusion Detection based on Improved Nonlinear Fuzzy Robust PCA.” 2018 IEEE 5th International Congress on Infor- mation Science and Technology (Cist).IEEE, 2018.
- M. Ringnr,What is principal component analysis?,” vol. 26, no. 3, pp. 303-304, 2008.
- J. Shlens, M. View, and I. Introduction, A Tutorial on Principal Component Analysis, 2014.
- T. N. Yang and S. D. Wang, Robust algorithms for princi- pal component analysis, Pattern Recognit. Lett., vol. 20, pp. 927-933, 1999.
- L. Xu and A. L. Yuille, Robust principal component analysis by self-organizing rules based on statistical physics approach,
- M. Tavallaee, E. Bagheri, W. Lu, and A. A. Ghorbani, A De-tailed Analysis of the KDD CUP 99 Data Set, no. Cisda, pp. 1-6, 2009.
- [Online] Available: http://kdd.ics.uci.edu/databases/kddcup99/task.html
- [Online] Available: http://www.unb.ca/cic/research/datasets/nsl.html.
