
Study of Wrinkling and Thinning Behavior in the Stamping Process of Top Outer Hatchback Part on the SCGA and SPCC Materials
Volume 5, Issue 3, Page No 241-248, 2020
Author’s Name: Sri Wahyanti, Agus Dwi Anggonoa), Waluyo Adi Siswanto
View Affiliations
Department of Mechanical Engineering, Universitas Muhammadiyah Surakarta, Jl.Ahmad Yani, PO.BOX 1 Pabelan, Surakarta 57162, Indonesia.
a)Author to whom correspondence should be addressed. E-mail: ada126@ums.ac.id
Adv. Sci. Technol. Eng. Syst. J. 5(3), 241-248 (2020); ![]() DOI: 10.25046/aj050331
DOI: 10.25046/aj050331
Keywords: Deep Drawing, Thinning, Wrinkling, Friction Coefficient, Forming Limit Diagram

Export Citations
The objective of the research is to determine the changes in wrinkling and thinning behavior in the stamping process of the top outer hatchback. The study was conducted using two types of materials, i.e., SCGA (Steel Cold rolled Galvanized Annealed) and SPCC (Steel Plate Cold rolled Coiled) with a thickness of 0.80 mm. During the stamping process, the coefficient of friction values varied of 0.0, 0.05, 0.10, and 0.15 for each material. The stamping process was carried out by using the simulation method to investigate the wrinkling and thinning behavior. The forming limit diagram (FLD) provides information on material changes and the amount of safe and unsafe areas on the blank. The results showed that in the fifth step, the parts that experienced high values of major-minor stress and strains, thinning, and wrinkling decreased in the last step. That caused by removing unused areas after the trimming process. Therefore, the safe zone of SCGA was increased from 9.52% to 18.19%. For the SPCC material, the safe area increased from 8.63% to 16.31%. The coefficient of friction affects the thinning and wrinkling defects. The greater of the friction coefficient will increase the value of thinning and wrinkling. Based on the Non-Linear FLD analysis, both materials SCGA and SPCC are still in a safe condition.
Received: 14 April 2020, Accepted: 12 May 2020, Published Online: 21 May 2020
1. Introduction
The development of the automotive industry today, requires the manufacturing industry to make products effectively and efficiently [1]. Automotive panel components are made by stamping [2], [3]. In the stamping process, product quality is strongly influenced by several factors, such as material properties, die geometry, friction characteristics, and punch forces [4]-[6]. In the stamping process, there are some defect problems that are usually present, namely wrinkle, fracture, springback, and cracking [7]-[9]. To solve these defects, stamping companies require more time and cost. An accurate sheet metal forming simulation is needed to develop an effective production process so that it can reduce the cost of producing automotive components. The use of stamping simulations to reduce defects can shorten the time of making molds, increasing material utilization, and reducing component damage. As such, stamping simulations make a significant contribution to the automotive industry to reduce product defects [10], [11].
In previous studies, researchers have used sheet metal forming simulations to predict defect problems during the stamping process. One of the efforts made is to analyze the influence of drawbead geometry to reduce failures and defects in the deep drawing process [12]. Researchers make changes in material flow by using drawbead to optimize cavity pressure. Thus, wrinkling can be reduced [13]. Analyzing blank holding forces related to draw-bead depth [14]. The drawbead retaining force is evaluated using the finite element method (FEM) for a variety of blank size variations. Recently, a design sensitivity analysis was also carried out to optimize the blank holder force (BHF) and draw-bead strength in the stamping process [15]. Reducing and eliminating cracking in the deep drawing process is done by analyzing the blank holder force and punch stroke variants [16]. Researchers suggest the factors that need to be considered while making a stamping simulation are the holding force, the shape of the draw-bead, the distance between the tool and the blank, and the boundary conditions [17]. In the stamping simulation, it uses not only the holding force but also the lift force because the draw-bead and strain become the boundary conditions in the stamping process [18].
Researchers have used FEM to analyze thinning and wrinkling behavior [19]-[21] and the factors that influence wrinkling [22]. BHF optimization and friction coefficient studies have been conducted to reduce the occurrence of wrinkling [23]. The combination of displacement adjustment (DA) and spring forward (SF) methods into a hybrid method (HM) has been carried out to reduce springback and optimize die in the stamping process [24]. Case studies for analyzing springback and compensation in automotive components have been carried out using FEM [25].
FLD is an empirical diagram used to determine the safe area of the plate during the forming process, which is applied to avoid failure [26]. FLD can be used to observe the behavior of isotropic hardening and strain in the deep drawing process [27][28]. That is also used to analyze the damage and thinning due to sheet metal forming processes such as fracture, necking, wrinkling, local bonding, and wrinkling [29]. FLD uses surface strain measurements by calculating major and minor strains [30][31].
This study aims to investigate wrinkling and thinning behavior. The effect of the coefficient of friction on the formation of wrinkling and thinning was also investigated. The automotive component studied is a top outer hatchback with material using two different materials, namely SCGA and SPCC.
2. Research Method
The study was conducted by using numerical simulations of Autoform software. The design was created by using CATIA V5 software. The CAD (Computer-Aided Design) data in the form of surface models, then developed into upper and lower dies. Other CAD data were blank holder, outer trimming, and inner trimming. All models in the form of surfaces have been prepared from CATIA V5, as shown in Figure 1. The models were then saved in the type of an IGS file for input files in Autoform.
The material used in this study was a commercial plate for the stamping industry, namely SCGA and SPCC. The material properties was described in Table 1. Plate thickness is 0.80 mm with a length of 1,610 mm and a width of 1,120 mm. Variations in the friction coefficient used were 0.0, 0.05, 0.10 and 0.15 for each material. It was done to determine the effect of the coefficient of friction on the formation of wrinkling and thinning defects. The component studied was the back part of the Micro Bus, the top outer hatchback.
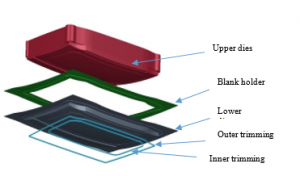
Figure 1. Surface definition for sheet metal forming.
Table 1. Material properties of SCGA and SPCC [32][33].
| Mechanical properties | Material type | |
| SCGA | SPCC | |
| Young’s Modulus (GPa) | 160 | 210 |
| Poisson’s ratio | 0.3 | 0.3 |
| Yield Stress (MPa) | 157.1 | 157.1 |
| Yield Strain (Ô0) | 0.00869 | 0.00869 |
| Strain Rate Exponents (m) | 0.228 | 0.225 |
| Strength Coefficient C (MPa) | 551.4 | 551.4 |
Strain hardening for hardening curves use the Swift formula:
![]()
Hardening curves are defined using a combination of Swift and Hockett-Sherby approaches. The combination factor of α determines the composition of the equation.
where s is stress equivalent, Ôpl is equivalent plastic strain and the others are material parameters.
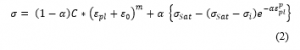
Tools setting parameters were described in the Table 2. Analyzes were performed on both SCGA and SPCC materials with a thickness of 0.8 mm each. The cushion stroke was 90 mm, and the blank holder force 60 kN. The investigation was carried out using FLD in 6 steps. The step is made based on the distance between punch and die or distance to bottom, as shown in Table 3. FLD is a curve that represents the boundaries of the process of material formation based on the major and minor strain stresses of an element. That means that material that experiences a strain above the curve’s limit will experience thinning. wrinkling. springback or cracking. Material changes in the process of forming the top outer hatchback underwent several changes as indicated by the difference in the color of the formation, which consists of areas of thickening, compressing, stretch insuftion, safe, risk of split, excess thinning and split as shown in Figure 2.
Table 2. Tools setting parameters for stamping simulation.
| Setting Tool | Punch | Die | Binder | Cutting Tool |
| Tool Contact |
Manual Upper Side of Blank |
Manual Lower Side Blank |
Manual Upper Side of Blank |
Inner Cutting Outer Cutting |
| Support Type | Force Control | Rigid | Force Control | – |
| Displacing Tool | Die | – | Die | – |
| Cushion Stroke | 90. mm | – | 90. mm | – |
| Tool Stiffness | 50. MPa/mm | – | 50. MPa/mm | – |
|
Force/ Pressure |
60.0 kN | – | 60.0 kN | – |
| Maximum Cutting Depth | – | – | – | 70. mm |
Table 3. Definition of each step for investigation.
| Step |
Distance to Bottom (mm) |
Process |
| 1 | -125 | Drawing |
| 2 | -115 | Drawing |
| 3 | -105 | Drawing |
| 4 | -95 | Drawing |
| 5 | 0.00 | Drawing |
| 6 | 0.00 | Trimming |
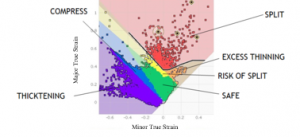
Figure 2. FLD description for forming investigation.
3. Results and Discussion
3.1. FLD based Investigation
The FLD results of the SCGA and SPCC material in the first step with a distance of -125 mm from the die was shown in Figure 3. Plate material flow behavior has been seen, and material changes occur from several conditions in both materials. Plate material changes that occur are the thickening area for SCGA material 0.12% and SPCC of 0.13%. The compressed area for SCGA material was 0.03% and SPCC 0.04%. Insuft stretch area for SCGA material was 99.84% and SPCC material 99.80%. Both material SCGA and SPCC have a safe area of <0.01%. The risk of split area, excess thinning, and split of all materials remained unchanged at 0.00%.
In the second step, the distance was -115 mm from the die. The thickening area of the SCGA and SPCC material was 0.32% and 0.39%. The compressed area was 0.11% and 0.13%, respectively. The area of insuft stretch on SCGA material was 99.56% and SPCC of 99.46%. The safe zone for SCGA material was 0.01% and 0.02% for SPCC material.
The investigation FLD based results for all steps were described in Table 4 for SCGA material and Table 5 for SPCC. The thickening area continues to increase until the fifth step for both SCGA and SPCC materials. Likewise, for compressed areas, insuft stretch, and safe regions. The forming simulation parameters used have shown that the stamping process can work safely. It can be seen from the area of risk of a split, exes thinning, and split, giving zero results. But in step six, the split area arose. The areas of risk of split and exes thinning was shown in Figure 4. (a) and (c). Figure 4. (b) and (d) show the FLD results after trimming. The thickening area has given zero results in the sixth step, and the compressed area as well. The area has decreased after the trimming process. The results of the analysis based on FLD indicate that the thickening area occurs in the regions that are not used. The results can be seen the sixth step or after trimming.
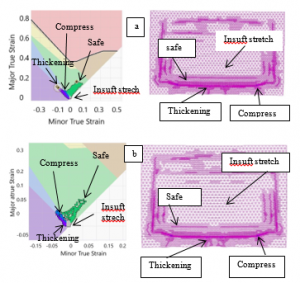
Figure 3. FLD results at step 1 for (a) SCGA, and (b) SPCC.
Table 4. FLD based results of SCGA material for all steps.
| Parameters (%) | Step for SCGA | |||||
| 1 | 2 | 3 | 4 | 5 | 6 | |
| Thickening | 0.12 | 0.32 | 1.16 | 6.21 | 14.6 | 0 |
| Compress | 0.03 | 0.12 | 0.43 | 1.43 | 3.76 | 0.01 |
| Insuft. stretch | 99.8 | 99.6 | 91.9 | 91.9 | 72.1 | 81.6 |
| Safe | 0.01 | 0.01 | 0.1 | 7.2 | 9.52 | 18.2 |
| Risk of split | – | – | – | – | – | – |
| Exes thinning | – | – | – | – | – | – |
| Split | – | – | – | – | – | – |
Table 5. FLD based results of SPCC material for all steps.
| Parameters (%) | Step for SPCC | |||||
| 1 | 2 | 3 | 4 | 5 | 6 | |
| Thickening | 0.13 | 0.39 | 1.33 | 6.27 | 15.04 | 0 |
| Compress | 0.04 | 0.13 | 0.56 | 1.29 | 3.66 | 0.19 |
| Insuft stretch | 99.8 | 99.5 | 97.9 | 92.0 | 72.6 | 81.6 |
| Safe | 0.01 | 0.02 | 0.45 | 8.2 | 8.63 | 16.3 |
| Risk of split | – | – | – | – | 0.01 | 0 |
| Exes thinning | – | – | – | – | 0.01 | 0 |
| Split | – | – | – | – | 0.01 | 0 |
3.2. Non-Linear FLD based Investigation
Nonlinear FLD analysis was performed to determine material behavior based on strain changes. Material failure behavior depends on the strain path. Figure 5 shows the results of the nonlinear FLD analysis after the trimming process for both materials SCGA and SPCC. Based on these results, there were no cracks or splits occur in the component. Material failures have occurred in unused areas. That has been explained before. Local necking was generated due to unstable deformation. This phenomenon occurs before the appearance of a crack or split.
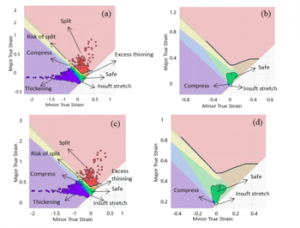
Figure 4. FLD results of SCGA before and after trimming (a-b), SPCC before and after trimming (c-d).
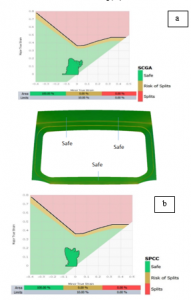
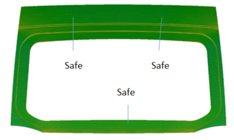
Figure 5. Nonlinear FLD results of SCGA (a) and SPCC (b) material.
3.3. Strain Based Investigation
The material behavior has been observed in six predetermined steps. Observations have been made for minor strains, as shown in Figure 6 (a-b) for both SCGA and SPCC material. The materials have changed the value of minor strains in step five. Observations have been made in four areas with potential defects, namely in areas A, B, C, D, as shown in Figure 6 (c-d). In area A, the highest minor strain values were 2.2 x 10⁻³ for SCGA material and 3.10 x 10⁻³ for SPCC material. It has happened in the drawing process. In the sixth step or the trimming process, the minor strain has decreased. It was 0.03 x 10⁻³ and 0.02 x 10⁻³ for SCGA and SPCC respectively.
The minor strain is a smaller value of principal logarithmic strain. Minor strain values indicate that the material has a stretching. The value of this strain affects the wrinkling phenomenon. On observing the process of changing minor strains for SCGA material from steps 3, 4, and 5, the value of minor strains was increased. That was resulted in wrinkling in part, shown in Figure 6 (c-d). The same thing has happened to the SPCC material. The minor strain and wrinkling values also increase in steps 4 and 5. The wrinkling area for both materials occurs at the edge of the trimming area.
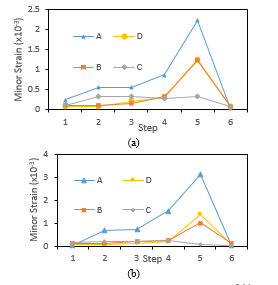
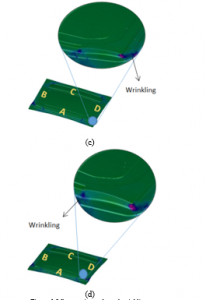
Figure 6. Minor strain results and wrinkling.
Figure 7 shows the results of major strains for both SCGA and SPCC materials. Observations have been made in four areas that have the potential to experience defects, namely in areas A, B, C, D, the same as previous observations. Major strains show the greater value of principal logarithmic strains. It affects the behavior of thinning and wrinkling during the forming process.
In the C area, the SPCC material was experienced a more significant major strain than SCGA. The most considerable major strain was occurred at the end of the fifth drawing step. In this step, the dominant strain values are SCGA 8.0 x 10⁻³ material and SPCC 7.9 x 10⁻³ material. Major strains in SCGA material have increased significantly from step 4 to step 5. It has resulted in wrinkling in several areas of the blank. In the SPCC material, the significant stress begins to increase from stage 4 to stage 5, generating more wrinkling on the edge of the blank. In step six, the major strain has dropped to zero because the process has been completed for all materials. Based on the analysis of major and minor strains, the forming process has been seen to be safe because it did not exceed the yield strain of material.
3.4. Stress Based Investigation
The results of investigations based on the stress experienced by the blank during the forming process were shown in Figure 8. Major stress and minor stress appear to have similar patterns. These results were greater and smaller values of principal stress. Major stress was closely related to the appearance of surface defects and springback. While minor stress was affected by wrinkling defect. The observations have been made on areas A, B, C, and D for all steps from 1-6 as well as strain observations (see Figure 6).
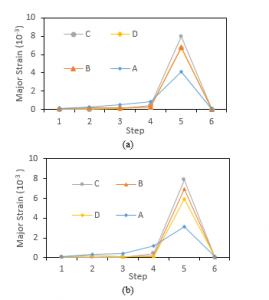
Figure 7. Major strain results for SCGA (a) and SPCC (b)
The value of major stress was always greater than minor stress. SCGA material was delivered major stress of 299.4 MPa. While at the end of the forming process, the major stress becomes 29 MPa (see Figure 8 (a-b)) because it has not suffered pressure from the dies. The most significant minor stress has occurred in area A, which was 199 MPa in the fifth step. After the trimming process, minor stress has decreased to 19 MPa because the process has been completed. Almost the same results were obtained for SPCC material for both major and minor stress, as shown in Figure 8 (c-d).
Figure 9 shows the results of wrinkling defect analysis for SCGA and SPCC materials. Wrinkling defects were corrugated surfaces at the end of the sheet metal forming process. That happened because of a non-uniform strain on the surface of the plate. These strains occur as a result of compressive stress in the direction of the plate. Other factors affecting wrinkling were material properties, friction coefficient, plate thickness, the shape of dies, blank holder force, and draw bead patterns.
Wrinkling analysis was carried out in areas A, B, C, and D as before (see Figure 10). The highest wrinkling was recorded at every step from 1-6. Based on the evaluation of the geometry, the results were obtained during the forming process. Wrinkle geometry was calculated by its radius (r). It was used to calculate the wrinkle constant, which was then called “C”. The c value is one per radius (1/r). So wrinkle was calculated by multiplying C by half of the plate thickness (t/2). The results of this wrinkle are dimensionless.
In the fifth step, the highest wrinkle values were seen in all parts A, B, C, and D (Figure 10) for both materials (see Figure 9). It was related to the results of stress and strain analysis, where the highest value has occurred in the fifth step. The highest wrinkles occur in section A. It was 1.71 and 1.48 for both SCGA and SPCC materials, respectively. While at the end of the process, the wrinkle value was 0.5 and 0.24 after trimming. The wrinkle value was decreased after the trimming process because the highest wrinkling occurs outside the used area.
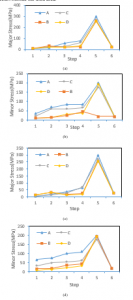
Figure 8. Major and minor stress for SCGA (a-b) and SPCC (b-c).
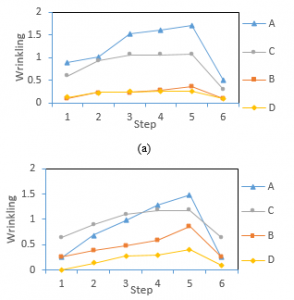
Figure 9. Results of wrinkling for SCGA (a) and SPCC (b).
The effect of the coefficient of friction on wrinkling was done by making variations of the coefficient of friction of 0, 0.05, 0.1, and 0.15. Based on the observed wrinkle value, the coefficient of friction was affected the wrinkling behavior during the forming process. A high coefficient of friction gives high wrinkle value. The same results were obtained from thinning observations. An increase in the coefficient of friction gives an increased amount of thinning, as shown in Figure 11. Thinning calculation is the difference in thickness divided by the initial thickness. The thickness difference was obtained from the final thickness minus the initial thickness. Observations were made in areas B and D, which have a higher chance of thinning compared to other areas.
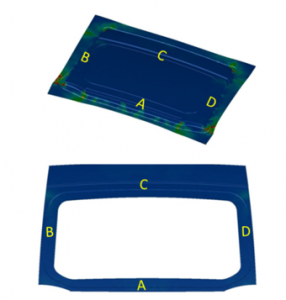
Figure 10. Wrinkling and thinning area investigation at step 5-6.
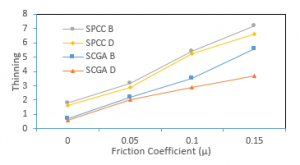
Figure 11. Influence of friction coefficient to the thinning.
4. Conclusions
The changes in wrinkling and thinning behavior on SCGA and SPCC material were successfully observed in six steps. The observations has shown that the plate received the higher stress-strain. The higher chance of wrinkling and thinning was delivered. It cannot be avoided because the deep drawing process always has high compressive stress on the plate. Major stress was increased from 78.46 MPa to 299.3 MPa in step 5. The coefficient of friction was affected the wrinkling and thinning behavior during the sheet metal forming process. The efforts to reduce friction was significant to reduce the phenomenon of wrinkling and thinning. At the end of the investigation, the forming results of the top outer hatchback part have yielded good results with minimal wrinkling and thinning defects.
Conflict of Interest
The authors certify that they have NO affiliations with or involvement in any organization or entity with any financial interest or non-financial interest in the subject matter or materials discussed in this manuscript.
Acknowledgment
The authors would like to acknowledge the Ministry of Research Technology and Higher Education, the Republic of Indonesia for the funding support of the research project under the schema of Thesis Magister Research No. 133.52/A.3-III/LPPM/IV/2020, and Master Program of Mechanical Engineering Department of Universitas Muhammadiyah Surakarta for the support of the project.
- A. Zoesch, T. Wiener, and M. Kuhl, “Zero Defect Manufacturing: Detection of Cracks and Thinning of Material during Deep Drawing Processes,” Procedia CIRP, vol. 33, pp. 179–184, 2015. https://doi.org/10.1016/j.procir.2015.06.033.
- M. Sigvant et Sigvant, Mats Pilthammar, Johan Hol, Johan Wiebenga, Jan Harmen Chezan, ToniCarleer, Bartvan den Boogaard, Ton, “Friction in sheet metal forming: influence of surface roughness and strain rate on sheet metal forming simulation results,” Procedia Manuf., vol. 29, pp. 512–519, 2019. https://doi.org/10.1016/j.promfg.2019.02.169
- M. El Sherbiny, H. Zein, M. Abd-Rabou, and M. El shazly, “Thinning and residual stresses of sheet metal in the deep drawing process,” Mater. Des., vol. 55, pp. 869–879, 2014. https://doi.org/10.1016/j.matdes.2013.10.055
- X. L. Geng, B. Wang, Y. J. Zhang, J. X. Huang, M. M. Duan, and K. S. Zhang, “Effect of crystalline anisotropy and forming conditions on thinning and rupturing in deep drawing of copper single crystal,” J. Mater. Process. Technol., vol. 213, no. 4, pp. 574–580, 2013. DOI: 10.1016/j.jmatprotec.2012.11.009
- M. A. Hassan, N. Takakura, and K. Yamaguchi, “Friction aided deep drawing of sheet metals using polyurethane ring and auxiliary metal punch. Part 1: experimental observations on the deep drawing of aluminium thin sheets and foils,” Int. J. Mach. Tools Manuf., vol. 42, no. 5, pp. 625–631, 2002. DOI: 10.1016/S0890-6955(01)00146-8
- P. Ramanjaneyulu, P. Venkataramaiah, and K. D. Reddy, “Multi parameter optimization of deep drawing for cylindrical cup formation on brass sheets using Grey Relational Analysis,” Mater. Today Proc., vol. 18, pp. 2772–2778, 2019. https://doi.org/10.1016/j.matpr.2019.07.142
- A. Atrian and H. Panahi, “Experimental and finite element investigation on wrinkling behaviour in deep drawing process of Al3105/Polypropylene/Steel304 sandwich sheets,” Procedia Manuf., vol. 15, pp. 984–991, 2018. https://doi.org/10.1016/j.promfg.2018.07.396
- W. Liu, Y. Xu, and S. Yuan, “Effect of Pre-bulging on Wrinkling of Curved Surface Part by Hydromechanical Deep Drawing,” Procedia Eng., vol. 81, pp. 914–920, 2014. https://doi.org/10.1016/j.proeng.2014.10.117
- E. Doege, T. El-Dsoki, and D. Seibert, “The prediction of necking and wrinkles in deep drawing processes using the FEM,” in Materials Processing Defects, vol. 43, S. K. Ghosh, Ed. Elsevier, 1995, pp. 91–105. https://doi.org/10.1016/S0922-5382(05)80007-8
- A. K. Choubey, G. Agnihotri, C. Sasikumar, and M. Singh, “Analysis of Die Angle in Deep Drawing Process Using FEM,” Mater. Today Proc., vol. 4, no. 2, pp. 2511–2515, 2017. https://doi.org/10.1016/j.matpr.2017.02.104
- I. A. Choudhury, O. H. Lai, and L. T. Wong, “PAM-STAMP in the simulation of stamping process of an automotive component,” Simul. Model. Pract. Theory, vol. 14, no. 1, pp. 71–81, 2006.
- N. Triantafyllidis, B. Maker, and S. K. Samanta, “An Analysis of Drawbeads in Sheet Metal Forming: Part I — Problem Formulation,” 2018. https://doi.org/10.1115/1.3225889
- B. Meng, M. Wan, X. Wu, S. Yuan, X. Xu, and J. Liu, “Inner wrinkling control in hydrodynamic deep drawing of an irregular surface part using drawbeads,” Chinese J. Aeronaut., vol. 27, no. 3, pp. 697–707, 2014. https://doi.org/10.1016/j.cja.2014.04.015
- J. Cao and M. C. Boyce, “Sae Technical Draw Bead Penetration as a Control Element of Material Flow,” no. 412, 1993. DOI: https://doi.org/10.4271/930517
- T. H. Choi and H. Huh, “Draw-bead Simulation by an Elasto-plastic Finite Element Method with Directional Reduced Integration,” vol. 0136, no. I, 1997. https://doi.org/10.1016/S0924-0136(96)02704-5
- S. Candra, I. M. L. Batan, W. Berata, and A. S. Pramono, “Analytical study and FEM simulation of the maximum varying blank holder force to prevent cracking on cylindrical cup deep drawing,” Procedia CIRP, vol. 26, pp. 548–553, 2015. https://doi.org/10.1016/j.procir.2014.08.018
- M. Nozic, “Numerical Simulation Of Deep Drawing Process With Faculty of Mechanical Engineering,” no. September, pp. 10–11, 2013. https://doi.org/10.5545/sv-jme.2010.258
- T. Meinders, H.J.M. Geijselaers, J. Huétink “Equivalent Drawbead Performance In Deep Drawing Simulations,” 1994.
- B. R. Billade and P. S. K. Dahake, “Optimization of Forming Process Parameters in Sheet Metal Forming Of Reinf-Rr End Upr-Lh / Rh for Safe Thinning,” vol. 8, no. 8, pp. 1–7, 2018. DOI: 10.9790/9622-0808010107. 1
- F. E. M. Study, “Plastic Wrinkling Investigation of Sheet Metal Product Made by Deep Forming Process: A FEM Study,” vol. 3, no. 10, pp. 186–191, 2014.
- V. Laxman and S. R. Srivatsa, “Sheet Metal Forming Processes – Recent Technological Advances,” Mater. Today Proc., vol. 5, no. 1, pp. 2564–2574, 2018. https://doi.org/10.1016/j.matpr.2017.11.040
- J. P. De Magalhães Correia and G. Ferron, “Wrinkling predictions in the deep-drawing process of anisotropic metal sheets,” J. Mater. Process. Technol., vol. 128, no. 1–3, pp. 178–190, 2002. DOI: 10.1016/S0924-0136(02)00448-X
- A. D. Anggono, W. A. Sharif, A. Trianto, and M. Y. Darmawan, “Influence of lubrication and blank holder force in dome wrinkling defect on cup drawing process,” ARPN J. Eng. Appl. Sci., vol. 11, no. 16, pp. 9985–9991, 2016. http://www.arpnjournals.org/jeas/research_papers/rp_2016/jeas_0816_4870.pdf
- W. A. Siswanto, A. D. Anggono, B. Omar, and K. Jusoff, “An alternate method to springback compensation for sheet metal forming,” Sci. World J., vol. 2014, 2014. https://doi.org/10.1155/2014/301271
- S. Jadhav, M. Schoiswohl, and B. Buchmayr, “Applications of Finite Element Simulation in the Development of Advanced Sheet Metal Forming ProcessesAnwendungen der Finite-Elemente-Simulation für die Entwicklung hochwertiger Blechumformprozesse,” BHM Berg- und Hüttenmännische Monatshefte, vol. 163, no. 3, pp. 109–118, 2018.
- R. Dwivedi and G. Agnihotri, “Study of Deep Drawing Process Parameters,” Mater. Today Proc., vol. 4, no. 2, pp. 820–826, 2017. https://doi.org/10.1016/j.matpr.2017.01.091
- L. Zhang, H. Liu, and W. Wang, “Numerical Simulation and Analysis of Hydromechanical Deep Drawing Process for Half-three-way Tube,” Procedia Eng., vol. 174, pp. 524–529, 2017. https://doi.org/10.1016/j.proeng.2017.01.181
- G. Sun, W. Zhang, Z. Wang, H. Yin, G. Zheng, and Q. Li, “A novel specimen design to establish the forming limit diagram (FLD) for GFRP through stamping test,” Compos. Part A Appl. Sci. Manuf., vol. 130, p. 105737, 2020. DOI: 10.1016/j.compositesa.2019.105737
- S. Basak, S. K. Panda, and M. G. Lee, “Formability and fracture in deep drawing sheet metals: Extended studies for pre-strained anisotropic thin sheets,” Int. J. Mech. Sci., vol. 170, no. November 2019, p. 105346, 2020. DOI: 10.1016/j.ijmecsci.2019.105346
- V. R. Shinge and U. A. Dabade, “Experimental Investigation on Forming Limit Diagram of Mild Carbon Steel Sheet,” Procedia Manuf., vol. 20, pp. 141–146, 2018. https://doi.org/10.1016/j.promfg.2018.02.020
- H. J. Bong, F. Barlat, M. G. Lee, and D. C. Ahn, “The forming limit diagram of ferritic stainless steel sheets: Experiments and modeling,” Int. J. Mech. Sci., vol. 64, no. 1, pp. 1–10, 2012. https://doi.org/10.1016/j.ijmecsci.2012.08.009
- C. D. Schwindt, M. Stout, L. Iurman, and J. W. Signorelli, “Forming Limit Curve Determination of a DP-780 Steel Sheet,” Procedia Mater. Sci., vol. 8, pp. 978–985, 2015. https://doi.org/10.1016/j.mspro.2015.04.159
- H. Zein, M. El Sherbiny, M. Abd-Rabou, and M. El shazly, “Thinning and spring back prediction of sheet metal in the deep drawing process,” Mater. Des., volume 53, pp. 797–808, 2014. https://doi.org/10.1016/j.matdes.2013.07.078