
Evaluation of Type A Uncertainty in a Network Analyzer From 300 kHz to 8.5 GHz
Volume 5, Issue 3, Page No 226-235, 2020
Author’s Name: Tan Ming Hui1,2,a), Ahmad Yusairi Bani Hashim2 , Mohd Rizal Salleh2
View Affiliations
1Radio Frequency Calibration Laboratory, National Instruments (M) Sdn Bhd, 11900, Malaysia
2Faculty of Manufacturing Engineering, Universiti Teknikal Malaysia Melaka, 76100, Malaysia
a)Author to whom correspondence should be addressed. E-mail: ming.hui.tan@ni.com
Adv. Sci. Technol. Eng. Syst. J. 5(3), 226-235 (2020); ![]() DOI: 10.25046/aj050329
DOI: 10.25046/aj050329
Keywords: Network Analyzer Calibration, Type A uncertainty, Repeatability

Export Citations
Network Analyzer is equipment widely used for the execution of radio frequency application scattering parameters. Throughout absolute reading the scattering parameter measured. An absolute reading does not include error, drift, offset, linearity, resolution, coefficient of sensitivity and several other variables that will contribute to the measured measurement dispersion. Type A evaluations of measurement uncertainty clarified according to ISO / IEC Guide 98-1. Type A uncertainty assumption is always done best to characterize an input quantity given in repeated indication values. The assumption was calculated from arithmetic mean, variance of probability distribution and standard deviation respected to the frequency from 300 kHz to 8.5 GHz in a Network Analyzer measurements. Furthermore, ISO/IEC 17025 is the standard for accredited testing and calibration laboratory to calculate the uncertainty of measurement to be declared in the scope of accreditation. Type A uncertainty calculation is one of the mandatory requirements for an accredited testing and calibration laboratory. The Type A uncertainty will be combined with Type B uncertainty to calculate the expanded uncertainty in measurement.
Received: 01 January 2020, Accepted: 10 May 2020, Published Online: 21 May 2020
1. Introduction
National Instruments manufacture network analyzer. NI PXIe-5632 Vector Network Analyzer [1] is one of the popular and commonly used models in Radio Frequency (RF) manufacturing. The PXIe-5632 is a Vector Network Analyzer (VNA) able to perform measurements of the scattering parameters which are reflection coefficient and transmission insertion loss. The reflection coefficient measures the voltage reflected from the device under test (DUT). It is known as port 1 VNA reflection coefficient (S11) and port 2 VNA reflection (S22) in a full two ports VNA. The reflected voltage will measure as the mismatch [2] of the DUT. Ttransmission line from the VNA measured from port 2 to port 1 known as forwards transmission (S21) and reverse transmission port 1 to port 2 (S12) [3]. The transmission voltage will measure as the insertion loss.
The reflected voltage calculated from the prototype or product will help researchers and designers ensure that their design reaches impedance of 50-ohm. It is because RF devices usually use 50-ohm impedance to apply the principle of maximum power transfer. High reflection voltage will create a high return loss. The return loss will determine by ratio. The best loss of return is 1:1 ratio meaning there is no reflected voltage towards the generator. If metric 4:1 of the return loss is measured as 25% of the reflected power towards the generator [4]. The measured reflected voltage knows as absolute reading. The absolute reading does not contain the errors known as systematic and random errors. ISO / IEC Guide 98-1 [5] clarified the importance of estimated uncertainty would determine the accuracy and performance of the entire measuring system. The measurement uncertainty is calculated based on Type A and Type B contributors.
Type A uncertainty contributor is an evaluation of standard uncertainty based on any valid statistical calculation. The statistical calculation mainly estimated by using the sample of the mean and standard deviation of mean formula. The sample of the mean is based on the sample of repeated measurements under the same condition. The standard deviation of mean is the estimation of Type A uncertainty. The standard deviation of mean will help researchers to perform repeatability [6] and reproducibility [7] statistical analysis. The objective is to set up a stable and accurate test system for manufacturing production. It is mainly to increase precision and accuracy [8]. Throughout the statistical analysis, the researcher can enhance the system from low accuracy and low precision to a better performance set up. As the results of this paper, it will guide to create a good system with calculating the lower numbers of Type A uncertainty.
This paper is an extension of the work originally presented in the 2016 7th International Conference on Mechanical, Industrial, and Manufacturing Technologies [9] , Journal of Engineering Science and Technology Vol. 14, No3 (2019) 1587-1600 [10] and Journal Advances in Science, Technology and Engineering System Journal Vol 5, Issue 3 [11].
2. Network Analyzer PXIe-5632
2.1. Selection of Network Analyzer
Until a manufacturer begins production, engineers are expected to conduct a lot of research until making the decision to invest in any of the production standards. Table 1 contrasts the variations between the network analyzer PXIe-5632, E5080B and ZNB8. Because of the cost-effectiveness and scale, the key reasons PXIe-5632 was chosen. A piece of cost-effective machinery will shorten investment returns. Capital investment risk [12] is low, and profitability is optimised. It is to ensure that the returns on the production product are greater than capital equipment expenditure and very necessary to persuade creditors that a sense of estimating the returns is adequate to cover the debt. Comparison of Network Analyzer between 3 different manufacturers and models was shown in Table 1.
Table 1 : Comparison of Network Analyzer With Other Manufacturers
| Network Analyzer | |||
| PXIe-5632 | E5080B | ZNB8 | |
| Cost | Effective | Expensive | Expensive |
| Frequency Range | 300 kHz – 8.5 GHz | 9 kHz – 9 GHz | 9 kHz – 8.5 GHz |
| Dynamic Range | 110 dB | 152 dB | 140 dB |
| Rack Size | 4U | 8U | 8U |
| Sweep Time | 28 mS | 3 mS | 4 mS |
| Sweep Points | 401 | 401 | 401 |
Every square foot is costing money on the production floor. An 18 slot PXI-Express chassis with 4U (7 Inches) rack size capable of fitting 6 PXIe-5632 Network Analyzer units. Compared to six E5080B and ZNB8 units, they are 36U (63 Inches) and 48U (84 Inches) respectively. As for power consumption, PXIe-5632 Network Analyzer’s 6 units consume the same power rate in a single PXIe-1095 chassis with internal clock and trigger synchronization accuracy of timing system working well [13]. E8050B and ZNB8 are, however, going to consume 6 times the rated capacity. The 6 times increase in the rated power would generate a lot of heat on the production floor. Indirectly, the facility team had to raise the flow of air conditioner to sustain at 23 degree Celsius in the production cycle. As a result, the operating cost increase in production by the volume of E5080B or ZNB8 running.
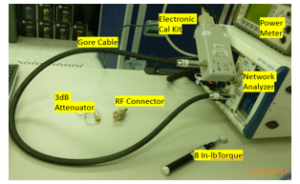
Figure 1: A PXIe-5632 Full 2 Ports Calibration Set Up
Figure 1 demonstrates complete setting up of a PXIe-5632 VNA full 2 ports calibration. It is consisting of a PXIe-1082 chassis and Anritsu electronic calibration module. The PXIe-1082 chassis which can fit with 2 units of PXIe-5632 VNA and work simultaneously. Meanwhile, if the chassis is PXIe-1095, it will fit with 6 units of PXIe-5632 VNA and operate 12 channels at the same time. This configuration is not only cost-effective and required a limited work bench space to run 6 units of PXIe-5632 VNA in the production floor at the same time. The PXIe-5632 owns the advantages of cost effective and space.
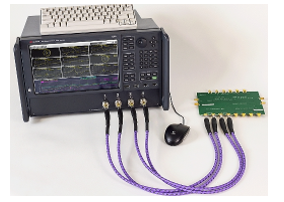
Figure 2 : E5080B 4-Ports Network Analyzer (Adapted from Keysight.com)
Figure 2 shown the Keysight manufactured E5080B 4-ports VNA. It is a highly integrated, complete characterization for radio frequency and microwave impedance measurement solution. The embedded software installed in the E5080B enables complete device characterization for passive device and components for researcher [14]. This VNA package with an extra wide bandwidth of up to 152 dB dynamic range feature improves the RF component and system testing throughput. It is approximate 10 times faster than PXIe-5632 but in terms of price, it is expensive in capital equipment investment.
Figure 3 shown the ZNB8 network analyzer with the mechanical calibration kits used in an electrical laboratory to perform characteristic impedance calibration. ZNB8’s key benefit is this VNA capable of extending up to 48 ports by using the matrix switches [15]. The switch matrix benefit is that it allows 48 channels to function simultaneously in output. This feature helps production reduce the waiting and testing period substantially, but the investment and maintenance plan cost will also be high.
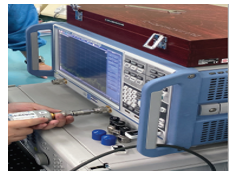
Figure 3 : A ZNB8 Network Analyzer
As a result, the operating cost increase in production by the volume of E5080B or ZNB8 running in a manufacturing production floor compare to PXIe-5632 is not merely cost-effective in terms of capital investment and manufacturing space savings as well.
2.2. Recommended Equipment for PXIe-5632 Calibration
From Table 1, it was found that the PXIe-5632 VNA is low in capital investment and physical small in size are the two main advantages compare to E5080B and ZNB8. The low investment in capital equipment will shorten the return of investment. The PXIe-5632 hardware small in size helps production significantly reduce the space for their test system. Table 2 shown the recommended equipment for PXIe-5632 during calibration.
Table 2 : Recommended Equipment for PXIe-5632 Calibration
| Equipment | Model | Where Used | Minimum Requirements |
| PXI Express Chassis | PXIe-1095 | All Tests | 3 Adjacent, empty PXI Express slots |
| PXI Express Controller | PXIe-8880 | All Tests | 1 System Slot |
| Precision Coaxial Cable | K-Type (NI Part Number 781611-01) | Scattering Parameter Calibration | Low Loss RF Cables |
| Automatic VNA Calibration Kit | NI Part Number 782364-01 | Automatically Calibrating Full 2 Ports Calibration | K-Type, Male and Female calibration kits up to 9 GHz |
To operate the PXIe-5632 a PXI chassis with model PXIe-1095 was required. The PXIe-1095 available with 18 slots, where it can slot and work simultaneously in 6 units of PXIe-5632 VNA. The PXIe-1095 chassis equipped with a PXIe-8880 controller. Only 1 controller needed to operate all the 18 slots in a chassis. An automatic VNA calibration kit used to perform full 2 ports calibration. Figure 1 provided a complete calibration setup for the PXIe-5632 characteristic impedance calibration.
After full 2 ports calibration completed shown in Figure 4, the device under test (DUT) measurement is ready to be measured. In this analysis, a mini-circuit fixed attenuator VAT-3 used to measure the Type A analysis. It is a 3 dB insertion loss fixed attenuator. The fixed attenuator forwards transmission (S21) and reverse transmission port 1 to port 2 (S12) analysis shown in Figure 5.
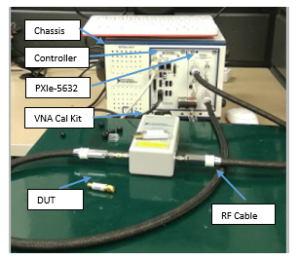
Figure 4 : A set up of PXIe-5632 Calibration
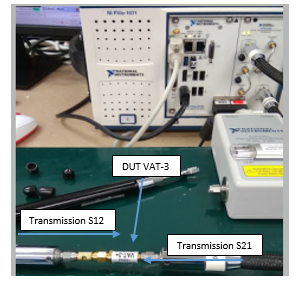
Figure 5 : A Set up of PXIe-5632 Calibration
Type A measurement would acquire a small number of repeated measurements of N number to populate a precision Type A measurement. The minimum of repeated measurement is 2. It is to calculate a small number of standard deviations. The smaller number of standard deviation calculated, the better performance of the network analyzer. In this case study, it is applying 5 repeated measurement under the same condition including equipment, personal and environmental condition. The objective is to minimize the error and standard deviation.
3. Estimation of Type A Uncertainty Calculation
Evaluation of measurement uncertainty classified into two categories Type A and Type B. Type A evaluation evaluates the uncertainty resulted from the statistical study. The statistical analysis may be an undergrowth series of repeated measurements of the same process. The series of repeated measurements will fill in a standard deviation of mean to calculate the Type A uncertainty.
3.1. Arithmetic Mean in Type A Uncertainty Analysis
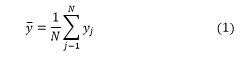
The estimation of Type A evaluation of uncertainty can be applied when a set of measurement was recorded under the same condition. Minimum repeated measurement is 2. Example a quantity of Y input with N statistically independent (N > 1) observed as (where j = 1, 2, 3, …, n). The estimation of quantity of Y is , arithmetic mean wrote as Equation 1 [16].
The system measured in the VNA under test may differ each time it under repeated condition. Even though it is the same set of equipment and the technician performs the measurement in production, it is difficult to determine the true value [17] from 300 kHz to 8.5 GHz frequency swept. This may be caused by various factors such as environmental condition, input line frequency stability, random error effect, impedance mismatch and others. Estimates the mean will help harmonize the cause of effect in the PXIe-5632 VNA towards the measurement. The higher sample size of repeated measurement will be resulting the measurement in lower noise.
3.2. The variance in Type A Uncertainty Analysis
The arithmetic means of is evaluated in Equation 1 will applied in Equation 2 to estimate the variance of probability distribution define as
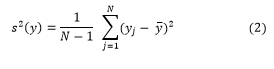
The size of the arithmetic mean samples determined by PXIe-5632 VNA which corresponds to Equation 2. In this study, it is very important that to keep the probability of variance distribution in a small number. The smaller number of the distribution of variance reflects the capability of PXIe-5632 VNA measured in good repeatability. Although the PXIe-5632 measured in good repeatability condition, it does not determine the system is accurate. The PXIe-5632 VNA framework must be validated against another external reference standard [18], which is specified in discussion.
3.3. Type A Uncertainty Analysis
After estimation of arithmetic mean and variance had been calculated, the experimental standard
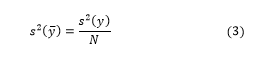
The standard uncertainty associated with the initial set of measurement repeated is the experimental standard deviation of mean as shown in Equation 4.
The key purpose of repetitive analysis is to disperse the data into a predictive waveform or pattern. To fill a Type A precision calculation, a high-stability system will acquire several repeated measurements of N (example 5). Indirectly, it calculates a small number of standard deviations. Calculating the smaller number of standard deviations resulting the PXIe-5632 measured precisely. If the standard deviation analysis did not calculate in small number, the higher sample size of repeated measurement is required.
4. PXIe-5632 Type A Uncertainty Calculation
After 5 repetitive measurements were taken by PXIe-5632, a statistical analysis to analyse the data. Figure 3 indicates the unit under test swept at 50 MHz calculated S21 and S12 with a total number of 201 points to approximate the nominal 3 dB error population as guide. The maximum and the minimum were measured at respectively 3.06 dB and 2.94 dB. The error was calculated as 0.02% from 3 dB nominal reference point. A linear graph was plot, and the formula was determined as y=0.5012x+0.0147. R square was calculated at 0.3564. R square shown in Figure 3, calculate 35.64% variance distributed along the linear line at y=0.5012x+0.0147 as shown in Figure 6.
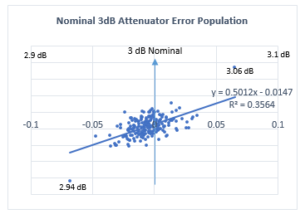
Figure 6 : Nominal 3 dB Fixed Attenuator Error Population
The error calculated 0.02% from 3 dB with R square 35.64% conclude that the measurement variability of the dependent at 3 dB, where approximately at 71 points. The 71 points are distributed from 3.0075 dB (maximum) until 2.9983 dB (minimum). The remaining 130 points are calculated as 64.36% of the variability is still uncounted from total number of 201 points. However, the maximum and minimum error calculated at ±0.06 dB and it was measure at 3.06 dB and 2.94 dB respectively. The error of ± 0.06 dB was found insignificant respect to the product specification limit at ±0.15 dB. The population lies within the 3 dB attenuator specification.
A nominal 3 dB fixed attenuator repeatability distribution was plotted as shown in Figure 4. The population distribution close to normal distribution trend with total number of 199 points lies within the 95% confidence interval. There are only 2 points was measures outside the 95% confidence interval as shown in figure 4.
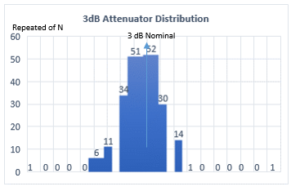
Figure 7 : Nominal 3 dB Fixed Attenuator Distribution Trend
The results from Figure 6 and Figure 7 were found satisfaction, precision and accurate. It can conclude the system repeatability is good and stable.
4.1. PXIe-5632 Experimental Transmission S21 Analysis
Measurement of transmission S21 from port 2 of PXIe-5632 to port 1. It is also known as forward transmission measurement. The configuration shown as Figure 2. The concept is PXIe-5632 VNA power generated from port 2 transmitted to the DUT and received the power at PXIe-5632 VNA port 1. The power is transmitted over the DUT and received at port 1 also known as insertion loss. Equation 1 required minimum 2 repeated measurement to calculate the arithmetic mean. In this experiment. a total of 5 repeated measurements swept from 300 kHz to 8.5 GHz. Frequency swept at 8.5 GHz is the maximum capability for PXIe-5632 VNA. The 5 repeated measurement was proceeded with the same set of equipment used and perform by same technician in 5 consequences day in calibration laboratory. The repeated measurement results obtained in Table 1.
Table 3 : 5 Repeated Measurement S21 Gathered from PXIe-5632
| Frequency | Run 1 | Run 2 | Run 3 | Run 4 | Run 5 |
| GHz | S21 | S21 | S21 | S21 | S21 |
| 0.0003 | -2.935 | -2.941 | -2.939 | -2.943 | -2.936 |
| 1.0 | -3.087 | -3.097 | -3.091 | -3.090 | -3.094 |
| 2.0 | -3.145 | -3.155 | -3.156 | -3.156 | -3.157 |
| 3.0 | -3.176 | -3.188 | -3.193 | -3.193 | -3.193 |
| 4.0 | -3.273 | -3.289 | -3.300 | -3.301 | -3.288 |
| 5.0 | -3.214 | -3.236 | -3.257 | -3.252 | -3.237 |
| 6.0 | -3.348 | -3.374 | -3.399 | -3.399 | -3.377 |
| 7.0 | -3.381 | -3.408 | -3.425 | -3.421 | -3.408 |
| 8.0 | -3.469 | -3.505 | -3.510 | -3.504 | -3.495 |
| 8.5 | -3.530 | -3.559 | -3.560 | -3.562 | -3.557 |
From Table 3, minimum and maximum insertion loss S21 was measured at -2.935 dB and 3.562 dB at frequency 300 kHz and 8.5 GHz respectively. The frequency swept at 7 GHz , 8 GHz and 8.5 GHz are beyond manufacturer specification. It is expected when the frequency increased will results higher error and drift.
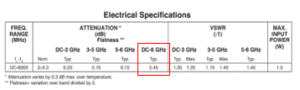
Figure 8 : Mini Circuit VAT-3 Manufacturer Specification
Figure 8 was taken from the manufacturer’s manual Mini-Circuit VAT-3 Fixed Attenuator product specification. The manufacturer warranted specification only up to 6 GHz. This experiment was a case study of Type A uncertainty up to 8.5 GHz. The frequency swept from 6 GHz to 8.5 GHz does not adhere to the manufacturer specification. Although the frequency swept beyond the manufacturer warranted specification, this study only required a precise in repeated measurement. However, the repeated measurement study will helps to plot the statistical analysis and the VAT-3 fixed attenuator characteristic. The statistical analysis will calculate the error dispersion from nominal 3 dB attenuation. This error also contribute by drift [20] proportional to the PXIe-5632 VNA frequency increased. The precise repeated measurement will helps to reduce the Type A uncertainty in calculation.
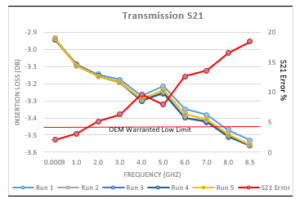
Figure 9: Transmission S21 With Repeated Number of 5
Figure 9 shown the transmission S21 with repeated number of 5 measurement. From 300 kHz found the lowest error calculated as 2.47%. The maximum error was calculated as 18.44% from nominal 3 db reference point. The VAT-3 fixed attenuator warranted specification only up to 6 GHz cut off at -3.45 dB, but this device remain stable up to 8.5 GHz with maximum error less than 20 % from the nominal points. From figure 9, it can conclude that the attenuation loss and error propotional with frequency increased from nominal point at 3 dB.
4.2. PXIe-5632 Experimental Transmission S12 Analysis
Transmission S12 measurement is measurement from PXIe-5632 port 1 to port 2. It is also known as reverse transmission. The set up was shown as Figure 5. The methodology applied from transmission S21 to perform the transmission S12 analysis. The only different the PXIe-5632 VNA measured the transmission S12 opposite direction from transmission S21. The power will be transmitted from Port 1 and received in Port 2 at PXIe-5632. Table 4 shown the 5 repeated measurement gathered under the same calibration condition.
Table 4 : 5 Repeated Measurement S12 Gathered from PXIe-5632
| Frequency | Run 1 | Run 2 | Run 3 | Run 4 | Run 5 |
| GHz | S12 | S12 | S12 | S12 | S12 |
| 0.0003 | -2.946 | -2.952 | -2.951 | -2.953 | -2.951 |
| 1.0 | -3.108 | -3.111 | -3.112 | -3.114 | -3.111 |
| 2.0 | -3.159 | -3.172 | -3.169 | -3.171 | -3.171 |
| 3.0 | -3.182 | -3.197 | -3.204 | -3.199 | -3.194 |
| 4.0 | -3.278 | -3.298 | -3.309 | -3.304 | -3.297 |
| 5.0 | -3.216 | -3.239 | -3.261 | -3.256 | -3.239 |
| 6.0 | -3.365 | -3.394 | -3.417 | -3.409 | -3.390 |
| 7.0 | -3.395 | -3.427 | -3.440 | -3.439 | -3.424 |
| 8.0 | -3.470 | -3.503 | -3.510 | -3.508 | -3.497 |
| 8.5 | -3.537 | -3.569 | -3.570 | -3.569 | -3.562 |
From Table 2, minimum and maximum measurement was measured at -2.946 dB and 3.570 dB respectively. The minimum and maximum measured were very close to S21 measurement in Table 1.
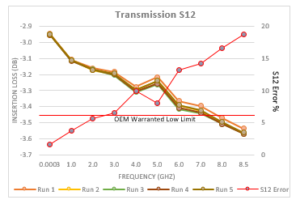
Figure 10: Transmission S12 With Repeated Number of 5
Figure 10 shown the transmission S12 with repeated number of 5 measurement. From 300 kHz found the lowest error calculated as 1.64%. The maximum error was calculated as 18.72% from nominal 3 db reference point.
4.3. Mini-Circuit VAT-3 Transmission S21 and S12 Measurement Error and Limit
Table 5 indicates repeated measurement error on transmission S21 and S12. Transmission S12 error was found from Table 5 to calculate a minimum of 0.217% and a maximum error of 18.926%. The Mini-Circuit VAT-3 was swept beyond its manufacturer specification, so it’s important to measure the frequency error maximum. The function of the S21 and S12 limits is used to monitor the repeatability of Type A analysis and identify any deviations or variations in performance by the measurement system as shown in Figure 11. If the S21 or S12 error is measured beyond the control limits, it is required to carry out validation and verification again from chapter 4.1. The main objective to perform validation and verification again is to detect the characteristic change from the equipment used or the device under test.
Table 5 : S21 and S12 Repeated Measurement Error
| Frequency | Measurement Error (%) | ||||
| GHz | S21 Error | S12 Error | tolerance | New S21 Limits | New S12 Limits |
| 0.0003 | 0.461 | 0.217 | 0.18926 | 0.548 | 0.259 |
| 1 | 5.808 | 6.228 | 0.18926 | 6.907 | 7.407 |
| 2 | 5.784 | 6.165 | 0.18926 | 6.879 | 7.332 |
| 3 | 5.598 | 5.867 | 0.18926 | 6.657 | 6.977 |
| 4 | 10.159 | 10.521 | 0.18926 | 12.082 | 12.513 |
| 5 | 8.889 | 9.124 | 0.18926 | 10.572 | 10.851 |
| 6 | 12.694 | 13.173 | 0.18926 | 15.097 | 15.667 |
| 7 | 11.310 | 11.946 | 0.18926 | 13.451 | 14.207 |
| 8 | 14.746 | 15.032 | 0.18926 | 17.537 | 17.877 |
| 8.5 | 18.646 | 18.926 | 0.18926 | 22.175 | 22.508 |
The standard used characteristic changed may affect the accuracy in repeated measurement. The inaccurancy of the measured may cause by mishandling of the equipment or the equipment degraded over the time being used in production. The same causes happen to the device under test. The new limit is very important to maintain the stability and repeatability measurement and to ensure the system always running in optimum condition.
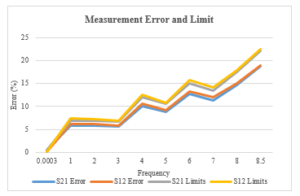
Figure 11: Measurement Error and Limit Control Chart
Figure 11 shown the Transmission S21 and S12 characteristic are close to each other. The device under test, Mini-Curcuit VAT-3 fixed attenuator is a known good attenuator and high stability device eventhrought the calibration was proceed approximate 20% beyond its warranted frequency specification.
4.4. The variance of S21 and S12
The variance of S21 and S12 is important to distinguish between the population from the data measured across the frequency. The variance of S21 and S12 were calculated from Equation 2. The variance is calculated from the 5 sample of measurements in S21 and S12. It was found that the observation does not vary from the group of mean swept from frequency 300 kHz until 8.5 GHz.
The calculated variance concludes that the 5-sample size of mean provide a low number of variances. This experiment does not require more sample of measurement. If the variance calculates a larger number, it represents that the individual frequency results was vary greatly from the group of mean. It could be contributing by any factor such as personal, skills, equipment, environmental condition and other factors.
Table 6: Variance S21 and S12
| Frequency | Variance | |
| GHz | S21 | S12 |
| 0.0003 | 1.09857E-05 | 7.0013E-06 |
| 1.0 | 1.36665E-05 | 4.8213E-06 |
| 2.0 | 2.58515E-05 | 2.7513E-05 |
| 3.0 | 5.26069E-05 | 6.5316E-05 |
| 4.0 | 0.000132802 | 0.00014041 |
| 5.0 | 0.000286582 | 0.00031072 |
| 6.0 | 0.000448815 | 0.00039954 |
| 7.0 | 0.000292401 | 0.00032702 |
| 8.0 | 0.000262793 | 0.00026651 |
| 8.5 | 0.000180771 | 0.00019919 |
The results from Table 6 is ready to calculate the Type A uncertainty.
4.5. Type A Uncertainty Calculation
The Type A uncertainty calculated by applying the Equation 3. Standard deviation is calculating for each frequency points. It is several variations between each data point relative to the mean. The calculated standard deviation in Table 7 will be the calculated Type A uncertainty as per Equation 4.
Table 7: Standard deviation of S21 and S12
| Frequency | Standard Deviation | |
| GHz | S21 | S12 |
| 0.0003 | 0.003314 | 0.002646 |
| 1.0 | 0.003697 | 0.002196 |
| 2.0 | 0.005084 | 0.005245 |
| 3.0 | 0.007253 | 0.008082 |
| 4.0 | 0.011524 | 0.01185 |
| 5.0 | 0.016929 | 0.017627 |
| 6.0 | 0.021185 | 0.019989 |
| 7.0 | 0.0171 | 0.018084 |
| 8.0 | 0.016211 | 0.016325 |
| 8.5 | 0.013445 | 0.014114 |
From Table 7, the minimum standard deviation for S21 measure at 0.003314 at 300 kHz meanwhile S12 measure at 0.002196 at 1 GHz. The minimum Type A uncertainty represent the best repeatability measured in the system. The maximum standard deviation for S21 and S12 were calculated as 0.021 and 0.019 respectively at 6 GHz. The worst case [21] of standard deviation demonstrate the maximum deviation at 6 GHz. From the worst case Type A uncertainty, it can observe that occurs at the maximum frequency point at warranted specification. As the conclusion from Table 7, the minimum and maximum standard deviation did not proportional towards the frequency increased. The minimum and maximum standard deviation could scatter between the frequency range from 300 kHz until 8.5 GHz.
4.6. Type A Uncertainty Associate with Transmission S21 and S12 Measurements
Table 8 and Figure 12 shown the Type A uncertainty evaluation reported into the device under test measurement report. The Type A uncertainty reported respect to its frequency point. The reading of transmission S21 and S12 were the magnitude of absolute measurement from PXIe-5632 VNA and associate with Type A uncertainty. Each of the individual Type A uncertainty will be computed with Type B uncertainty to calculate the total expended uncertainty expended uncertainty which the total expended uncertainty should reported in 2 decimal points [11].
Table 8 : An Example of Calibration Report With Type A Uncertainty
| DUT Calibration Report | ||||
| Freq. (GHz) | S21 | Type A Unc. | S12 | Type A Unc. |
| 0.0003 | -2.939 | 0.0033 | -2.951 | 0.0026 |
| 1 | -3.092 | 0.0037 | -3.111 | 0.0022 |
| 2 | -3.154 | 0.0051 | -3.168 | 0.0052 |
| 3 | -3.189 | 0.0073 | -3.195 | 0.0081 |
| 4 | -3.290 | 0.012 | -3.297 | 0.012 |
| 5 | -3.239 | 0.017 | -3.242 | 0.018 |
| 6 | -3.379 | 0.021 | -3.395 | 0.020 |
| 7 | -3.408 | 0.017 | -3.425 | 0.018 |
| 8 | -3.497 | 0.016 | -3.498 | 0.016 |
| 8.5 | -3.553 | 0.013 | -3.562 | 0.014 |
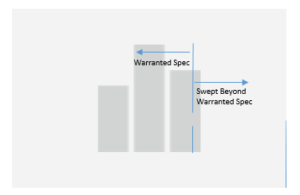
Figure 12: Transmission S21 and S12 associate with Type A Uncertainty
Repeated measurement concept is involved multiple measurement of each frequency. Under the repeated measurements condition, the device under test will exposed the best and worst conditions from the calibration report. It is a statistical measurement calculate the variation in the response to the variation variable that is cause by random and systematic errors. The random and systematic effect will be analysed when performing the Type A and Type B uncertainty.
5. Discussion
5.1. Validate Type A Uncertainty by Using Correlation S21 and S12 Method
The correlation between S21 and S12 is important to ensure the performance of the Network Analyzer generator and receiver measured the power precise and accurately. The correlation of S21 and S12 calculated as shown in Table 9. The mean of S21 and S12 were calculated from Table 3 and 4 respectively by applying the equation 1 to verify the correlation of the transmission measured by the PXIe-5632 VNA. In ideal case, both transmission S21 and S12 should be the same magnitude in term of forward and reverse insertion loss. It is because the same device under test measured at the same condition. However, this theory does not apply in the experimental. There are gaps identified in the calibration.
Table 9 : Delta of Mean Calculated From S21 and S12
| Frequency | Mean | ||
| GHz | S21 | S12 | ∆ Mean |
| 0.0003 | -2.9386 | -2.9506 | 0.0120 |
| 1.0 | -3.0919 | -3.1111 | 0.0192 |
| 2.0 | -3.1537 | -3.1684 | 0.0146 |
| 3.0 | -3.1888 | -3.1954 | 0.0066 |
| 4.0 | -3.2903 | -3.2970 | 0.0067 |
| 5.0 | -3.2392 | -3.2420 | 0.0028 |
| 6.0 | -3.3792 | -3.3949 | 0.0157 |
| 7.0 | -3.4085 | -3.4251 | 0.0166 |
| 8.0 | -3.4968 | -3.4977 | 0.0008 |
| 8.5 | -3.5534 | -3.5616 | 0.0082 |
Figure 13 shown the correlation of S21 and S12 from 300 kHz until 8.5 GHz. From the graph, it was found that the delta of mean is random. It does not proportional to frequency. The maximum delta of mean is 0.0192 dB at frequency 1 GHz and follow by 7 GHz and 6 GHz. Meanwhile, the minimum delta of mean measured at 8 GHz only differentiate with 0.0008 dB.
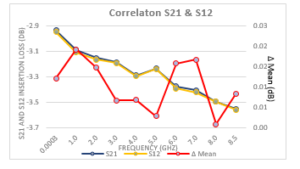
Figure 13 : Correlation S21 and S12
Overall Figure 9 conclude that strong correlation between S21 and S12 trend crossing each other from 300 kHz until 8.5 GHz. The PXIe-5632 VNA port 1 and 2 are two different receivers to measure the signal received. The strong correlation concludes the PXIe-5632 VNA port 1 and port 2 measured insertion loss very close to each other by two different sensors applied in the system.
5.2. Verification of PXIe-5632 VNA Results with Other Original Equipment Manufacturer
Performing the Type A uncertainty analysis only with the PXIe-5632 VNA would not sufficient to determine the accuracy of repeated measurement. With the study had been done is required to perform the gaps analysis with another external system. It is reducing the risk to make mistake in the calibration and to ensure the PXIe-5632 VNA also demonstrate the strong correlation with another system. If the comparison between the PXIe-5632 and external system results are independent, a further detail analysis is required including validate the calibration procedure or hardware being used in this study.
Figure 14 shown the same device under test measured by Rohde & Schwarz ZNB20 VNA from 100 kHz until 8.5 GHz. It was the screenshot from the ZNB20 VNA display. It shown the device under test trend across the frequency swept with markers function turn on. The reading pointed by markers will compare with the PXIe-5632 VNA. From the ZNB20 VNA was found the device under test characteristic does not linear from 1 GHz until 8.5 GHz. It is because the ZNB20 VNA perform the measurement without averaging function turn on. Without the averaging function, the device under test is measured under the “worst case” scenario. If the averaging function turn on, it is expected the device under test measured in a linear characteristic.
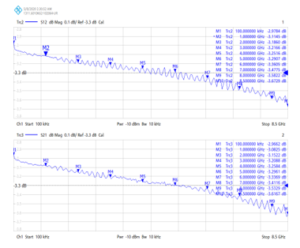
Figure 14: ZNB20 Transmission S21 and S12 Absolute Measurement
Table 10: S21 Comparison Between PXIe-5632 and ZNB20
| Frequency | Measurement Error | |||
| GHz | PXIe-5632 S21 | ZNB20 S21 | Delta S12 (dB) | Delta S12 (%) |
| 0.0003 | -2.9862 | -2.9662 | -0.0200 | 0.67% |
| 1 | -3.1742 | -3.0825 | -0.0917 | 2.98% |
| 2 | -3.1735 | -3.1522 | -0.0213 | 0.68% |
| 3 | -3.1679 | -3.2088 | 0.0409 | -1.27% |
| 4 | -3.3048 | -3.2584 | -0.0464 | 1.42% |
| 5 | -3.2667 | -3.2961 | 0.0294 | -0.89% |
| 6 | -3.3808 | -3.3369 | -0.0439 | 1.32% |
| 7 | -3.3393 | -3.4116 | 0.0723 | -2.12% |
| 8 | -3.4424 | -3.5329 | 0.0905 | -2.56% |
| 8.5 | -3.5594 | -3.6167 | 0.0573 | -1.59% |
From Table 10, the maximum delta between the two system occurs at 1 GHz. It is differentiated by -0.0917 dB or 2.98% above the PXIe-5632 VNA measurement. Overall Table 10 can conclude that the S21 does not measure any significant delta from 300 kHz until 8.5 GHz.
Table 11 : S12 Comparison Between PXIe-5632 and ZNB20
| Frequency | Measurement Error | |||
| GHz | PXIe-5632 S12 | ZNB20 S12 | Delta S12 (dB) | Delta S12 (%) |
| 0.0003 | -2.92652 | -2.9780 | 0.0515 | -1.76% |
| 1 | -2.88306 | -3.1145 | 0.2314 | -8.03% |
| 2 | -3.10583 | -3.1860 | 0.0802 | -2.58% |
| 3 | -3.29741 | -3.2166 | -0.0808 | 2.45% |
| 4 | -3.15151 | -3.2516 | 0.1001 | -3.18% |
| 5 | -3.36279 | -3.2907 | -0.0721 | 2.14% |
| 6 | -3.23231 | -3.3605 | 0.1282 | -3.97% |
| 7 | -3.5807 | -3.4775 | -0.1032 | 2.88% |
| 8 | -3.75398 | -3.5822 | -0.1718 | 4.58% |
| 8.5 | -3.76342 | -3.6729 | -0.0905 | 2.41% |
From Table 11, the maximum delta between the two system occurs at 1 GHz. It is differentiated by 0.2314 dB or -8.98% below the PXIe-5632 VNA measurement. At 4, 6 and 8 GHz were found large deviation measured beyond 3% delta. Overall Table 11 can conclude that the S12 measure multiple significant changes from 300 kHz until 8.5 GHz. Especially at 1 GHz was identify maximum delta in both S21 and S12.
5.3. Summary of Discussion
In the discussion, there are 2 main issues were found. First issue identifies as the frequency swept at 1 GHz and second issue is transmission S12 comparison between PXIe-5632 and ZNB20.
Frequency swept at 1 GHz did not found significant issue when the measurement of S21 and S12 correlation between PXIe-5632 itself. The changes in insertion loss was low measured at 0.0192 dB. However, the same frequency point resulting the biggest delta compare to another system. This is the first improvement required corrective action in next research.
The second issue was found in transmission S21 comparison between PXIe-5632 and ZNB20. There are 4 out of 10 measurement points are beyond 3% delta. Although the 3% changes are not significant to both systems. If the ± 3% set as the benchmark or pass rate. Overall, only 6 out of 10 measurement points were measured below 3% changes. It is only score 60%. Nevertheless, corrective action required in next research as well.
6. Conclusion
In this study, an evaluation of Type A measurement uncertainty for NI PXIe-5632 Vector Network Analyzer from 300 kHz to 8.5 GHz is calculated. This frequency bandwidth is widely used in telecommunications particularly in the calibration system for the 5 G sub-6 GHz range that required to perform calibration on the telecommunication devices. This paper also carries out several the comparison technique applied in the PXIe-5632 VNA, valued to specific calibration techniques. A complete mathematical review shown the effects in each step involve in the Type A uncertainty analysis. This paper could help improve the scattering of parameters for commercial laboratories to extend the calibration potential in the new 5G telecommunication sector. The calibration analysis by using a 3 dB fixed attenuator also helps the commercial calibration laboratory explore existing measuring capacities and increase the degree of competence in the laboratory. In the discussion, it is explained the limitations are identify in existing PXIe-5632 VNA system. A part of the limitation of this paper would contribute to next improvement research area. As future of this work, the first development is to extend the frequency range beyond 8.5 GHz. The second development is extending to PXIe-5632 VNA Scattering Parameters port 1 (S11) and port 2 (S22). The calculation of the reflections S11 and S22 involved only port 1 or port 2. In addition, a measure of the test uncertainty ratio may also be added in future to satisfy the requirements of ANSI / NCSL Z540. A test uncertainty ratio also can be calculated to meet the ANSI/NCSL Z540 requirement.
Acknowledgements
This work was supported in part by the Malaysian Ministry of Higher Education under the MyBrain15 program and Universiti Teknikal Malaysia Melaka.
- National Instruments, Calibration Procedure PXIe-5632 8.5 GHz Vector Network Analyzer, National Instruments USA, 2018.
- Agilent, Fundamentals of RF and Microwave Power Measurements (Part 1), Agilent Technology USA, 2003.
- Williams, A. J. Jeffrey, F. Dylan, “A method for improving high-insertion-loss measurements with a vector network analyzer,” in 89th ARFTG Microwave Measurement Conference (ARFTG) 2017, Honololu, HI. DOI:10.1109/ARFTG.2017.8000839
- Y. S. Meng, A. C. Patel, Y. Shan, H. N. Pandya, Y. Wang, “Performance evaluation of a handheld network analyzer for testing of balanced twisted-pair copper cabling,” in 29th Conference on Precision Electromagnetic Measurements (CPEM) 2014, Rio de Janeiro, Brazil. DOI: 10.1109/CPEM.2014.6898402
- Metrology, ISO/IEC Guide 98-1 Uncertainty of Measurement, Switzerland: ISO, 2009.
- G. G. Jing, “How to measure test repeatability when stability and constant variance are not observed” International Journal of Metrology and Quality Engineering, vol. 9, Article 10, 2018. https://doi.org/10.1051/ijmqe/2018007
- D. Kubatova, M. Melichar, J. Kutlwaser, “Evaluation of Repeatability and reproducibility of CMM equipment,” in Procedia Manufacturing, Elsevier B.V. Vol 13, Page 558-564. https://doi.org/10.1016/j.promfg.2017.09.091
- Agilent, Fundamentals of RF and Microwave Power Measurements (Part 4), Agilent Technologies USA, 2006.
- M.H. Tan, B.H Ahmad Yusairi, S. Mohd Rizal, “An Analysis for 2.4mm-2.4mm RF Connector Insertion Loss Measure From 45MHz Until 50GHz by Using Electronic Calibration Module and Mechanical Calibration kits in a Network Analyzer,” in MIMT 2016, Cape Town South Africa. https://doi.org/10.1051/matecconf/20165403006
- M.H. Tan, B.H Ahmad Yusairi, S. Mohd Rizal, “Radio Frequency Connector Insertion Loss Measured From 300 kHz Until 8.5 GHz By Using Network Analyzer And Meachnical Calibration Kits,” in Journal Of Engineering Science and Technology, 1587-1600, 2019. https://doi.org/10.5281/zenodo.3590276
- K. Hitomi, Manufacturing Systems Engineering: A Unified Approach to Manufacturing Technology, Production Management, and Industrial Economics, UK: Taylor & Francis Ltd, 1996.
- P.L.Liu, L.L.Ren, J.H.Zhang, C.W.Luo, L.Zhao, “Research Progress of HL-2M Distributed Timing System,” Fusion ENgineering and Design 2020, vol. 153, Article 111491. https://doi.org/10.1016/j.fusengdes.2020.111491
- H. Huang, C. Wang, H. Wu, C. Huang, Z. Yang, H. Wang, “Optimization of the two-stage common-emitter transistor amplifier for equalization circuit in visible light communication system,” Optical And Quantum Electronics 2018, Vol 50, Article 349. https://doi.org/10.1007/s11082-018-1613-y
- R. &. Schwarz, “Vector Network Analysis with Up to 48 Ports,” Microwave Journal 2014, Vol 57, Edition 3 , https://doi.org/10.5281/zenodo.3783593
- D. Nix and A. Weigend, “Estimating the mean and variance of the target probability distribution,” in Proceedings of 1994 IEEE International Conference on Neural Networks (ICNN) 1994, Orlando, FL, USA. IEEE 10.1109/ICNN.1994.374138,
- H. Kirkham, A. Riepnieks, M. Albu, D. Laverty, “The nature of measurement, and the true value of a measured quantity,” in IEEE International Instrumentation and Measurement Technology Conference (I2MTC) 2018, Houston, TX. DOI: 10.1109/I2MTC.2018.8409771,
- L. K. Pino, B. C. Searle, E. L. Huang, W. S. Noble, A. N. Hoofnagle, M. J. MacCoss, “Calibration Using a Single-Point External Reference Material Harmonizes Quantitative Mass Spectrometry Proteomics Data between Platforms and Laboratories,” Analytical Chemistry 2018, Vol. 90, Page 13112-13117 DOI: 10.1021/acs.analchem.8b04581
- X. Wan, W. Wang, J. Liu and T. Tong, “Estimating the sample mean and standard deviation from the sample size, median, range and/or interquartile range,” BMC Medical Research Methodology 2014, Vol. 14, Page 135. https://doi.org/10.1186/1471-2288-14-135
- Agilent, Fundamentals of RF and Microwave Power Measurements (Part 2), Agilent Technologies USA, 2006.
- Agilent, Fundamentals of RF and Microwave Power Measurements (Part 3), Agilent Technologies USA, 2003.