
University Students Result Analysis and Prediction System by Decision Tree Algorithm
Volume 5, Issue 3, Page No 115-122, 2020
Author’s Name: Md. Imdadul Hoque1, Abul kalam Azad1,a), Mohammad Abu Hurayra Tuhin1, Zayed Us Salehin2
View Affiliations
1Computer Science and Telecommunication Engineering, Noakhali Science and Technology University, Noakhali-3814, Bangladesh
2Information and Communication Engineering, Noakhali Science and Technology University, Noakhali-3814, Bangladesh
a)Author to whom correspondence should be addressed. E-mail: ak_azad@nstu.edu.bd
Adv. Sci. Technol. Eng. Syst. J. 5(3), 115-122 (2020); ![]() DOI: 10.25046/aj050315
DOI: 10.25046/aj050315
Keywords: Data mining, Decision tree, J48 algorithm, WEKA, Predicting Performance

Export Citations
The main assets of universities are students. The performance of students plays a vital role in producing excellent graduate students who will be the future viable leader and manpower in charge of a country’s financial and societal progress. The purpose of this research is to develop a “University Students Result Analysis and Prediction System” that can help the students to predict their results and to identify their lacking so that they can put concentration to overcome these lacking and get better outcomes in the upcoming semesters. The prediction system can help not only the current students but also the upcoming students to find out exactly what they should do so that students can avoid poor achievement that will help to increase their academic results and other skills. To train the system, we collected data from the university student’s database and directly from students by survey using Google form containing information, such as gender, extracurricular activities, no of tuition, programming skills, class test mark, assignment mark, attendance, and previous semester Grade Point Average (GPA), where the main aim is to relate to student performances and Cumulative GPA (CGPA). We use Weka tools to train the system and to develop the decision tree. In decision tree, the acquired knowledge can be expressed in a readable form and produced classification rules that are easy to understand than other classification techniques. These rules used to develop a web-based system that can predict the grade points of students from their previous records. Moreover, the system notifies students’ lack and gives suggestions to improve their results. Finally, we compared the performance of three (J48, REPTree, and Hoeffding Tree) different decision tree algorithms, and comparative analysis shows that for our system, the J48 algorithm achieves the highest accuracy.
Received: 13 January 2020, Accepted: 24 March 2020, Published Online: 03 May 2020
1. Introduction
University students’ academic acquirement is one of the main factors thought by employers in recruiting employees especially new graduates. So, students have to engage in their lessons to obtain good results for fulfilling the employer’s demand [1]. In the twenty-first century, it may not be a new message that the importance of science and technological education is growing across the whole world. Newer and newer inventions are happening day by day. So, persons with science and technological knowledge and skills are highly demandable for our country’s economic and social development.
In Bangladesh, advancement in technology is also remarkable. Science and technology education are getting a new dimension. A large number of students are interested to admit in different science and engineering universities. It is a very good sign, but we need to ensure the quality of the graduates that we cannot ensure in many cases. So, we need to find out the factors with which student’s academic performance depends and addressing them in a paradigm so that academic performance can increase.
Although some academic performance prediction approaches proposed for various countries, in Bangladesh, enough works have not done yet in this area. We find only works in this area. The authors of [2] have introduced an approach to predict the student’s results in the form of CGPA using neural networks technique where they collected data from a university of Bangladesh. They showed that student’s yearly performance greatly depends on both academic and non-academic activities. However, they work on a comparatively small dataset and do not provide suggestions for improvement. So, this paper aims to the development of an effective university student result analysis and prediction system that can predict semester results, will show their lacking, and give valuable suggestions to overcome the lacking and hence to improve their performance.
The remainder of the paper formed by covering the following: Section 2 briefly explain the related research works, Section 3 shows the major contributions of the work, Section 4 describes the proposed methodologies of this research, Section 5 covers the implementation and output of this research and Section 6 concludes the paper with the outline of future works.
2. Literature Review
For the last few years, researchers are working to address the issue of student result analysis and prediction. In [3] a decision tree-based classification technique to predict students’ final exam results has presented. The authors stated that educational databases’ hidden information could play a vital role in students’ performance development.
Surjeet Kumar Yadav and Saurab Pal [4] proposed a data mining approach to predict good students to enroll in the Master of Computer Application (MCA) course in India using their past academic records. They conclude that Bachelor of Computer Application (BCA) and B.Sc. students with mathematics performed better in the MCA course, and B.A. without mathematics did not perform well for the course.
Cristobal Romero et. al [5] collected real data of seven Moodle courses from Cordoba University students to develop a specific Moodle data mining tool. The authors compared different data mining techniques to classify students based on their Moodle usage data and the final marks obtained in their respective courses. The authors concluded that a classifier for educational decision making should be both comprehensive and accurate.
Lewis Adam Whitley’s [6] research to predict the most affluent learning environment. Within this research project, the author would attempt to use data from the University of North Carolina at Pembroke and process the data into environmental factors that may or may not influence a student’s learning ability. The author determined the best method in order to seek a learning environment and try to discover the factors that could impact on a student’s academic performance.
Authors of [7] analyzed a system that will predict student’s grades using the ID3 decision tree algorithm, where data gathered from the academic department of Redeemer’s University, Nigeria.
Gorikhan [8] presents the implementation of different classification techniques for vocational institutional analysis that help teachers to work on weak students to improve their performance and claimed that decision tree is the accurate prediction model for institutions students’ analysis.
Bhardwaj and Pal [9] conducted another study on predicting the students’ performance by choosing 300 students from 5-degree college conducting BCA (Bachelor of Computer Application) course in Dr. R. M. L. Awadh University, Faizabad, India. Using the Bayesian classification technique on 17 attributes, they showed that students’ academic performance relates to both the academic and non-academic attributes like family annual income and students’ family status, etc. This study would help the students to improve their performance. This study would also help to identify those students who needed special attention and by taking appropriate action at the right time the fail ratio could also be reduced. However, specific suggestions to overcome the lacking were absent in the study. So, more works need to done to find more effective solutions for university students’ result analysis and prediction systems, especially in Bangladesh.
3. Major Contribution of the Work
This paper differs from previously proposed result prediction approaches. The major contribution of the work is as follow:
- The attributes considered for this paper consist of a mixture of students’ general and academic data. Moreover, the work aims to identify the important attributes for predicting the results.
- The predicted results were verified to make sure its accuracy.
- In this work, we designed a web-based environment where a student can input the required (e.g. gender, programming skill, CT marks, etc) data, and the system shows them the predicted results based on their entry data.
- The developed system will provide the reasons behind the results fall, and also provide valuable suggestions to improve their performance.
- Finally, the paper incorporates the comparison among some prediction models to find out the best one with high accuracy.
4. Proposed Study of Students Result Analysis and Prediction System
The proposed methodology used in this work for predicting students’ performance using decision tree algorithms belongs to the data mining technique and make the prediction model that classifies the students’ records.
Said differently, using this decision tree algorithm, we wish to guide the students towards the acquirement of better results that we feel they could achieve. To classify the instances, Tree-based methods classify instances from the root node to leaf nodes where each branch downward from a node represents one of the possible values for that attribute [10]. The stages in the process include the following:
4.1. Dataset Collection
The dataset collected from a university that has introduced different attributes. The data collected in two steps. The first step is to collect a partial part of the data from the university student database. Then the rest of the data was taken from the students through the Google doc survey. This dataset contains 850 instances, each of which has 14 different attributes.
4.2. Data Preprocessing
To apply data mining techniques, the dataset needs to prepare. This stage involves dataset preparation before applying data mining techniques. At first, data collected in an excel sheet. Then, fill the missing data by standard values, and removed another variance manually to hold classifier quality. The original data includes student details such as (id, name, age, date of birth, address, TGPA, gender, extracurricular activities, no of tuition, CT mark, assignment mark, programming skills, attendance, no of backlog). During analysis, attributes like student Id, age, date of birth, address, no of backlog did not help to predict the class. So it excluded from the training data set. To rank the attributes, we use gain ration measures. Then we select 8 attributes based on their rank to use for the study. Here, Table 1 shows the description of the attributes and their possible values.
Table 1: Used attributes in the experiment
| Attribute | Description | Possible Values |
| Gender | Students Gender |
Male / Female
|
| E. activities | Extra curriculum activities |
Yes / No
|
| No of Tuition |
Number of tuition |
Zero, One, Two, Three, Greater Than Three. |
| Programming Skills | Programming skills |
Poor, Average, Good. |
| CT Mark | Class test marks |
1st class, 2nd class, 3rd class. |
| Assignment Mark | Assignment marks |
First-class, Second class, Third class. |
| Attendance | Percentage of attendance |
60%-69%, 70%-79%, 80%,-90%, 90%-100%. |
| TGPA | Term grade point average |
POOR (less than 3.10), AVERAGE (3.10-3.29), GOOD(3.30-3.49), VERY GOOD (3.50-3.69), EXCELLENT (upto 3.69).
|
The data in the excel sheet exists in CSV (.csv) format. Then, we convert it to ARFF(.arff) format by using the WEKA tool.
4.3. The Data Mining Tools
In this work, WEKA (Waikato Environment for Knowledge Analysis) used as an experimental tool for classifying data. Weka is one of the popular machines learning software that contains a variety of algorithms and visualization tools for data analysis and prediction system design. Moreover, Weka offers a user-friendly graphical user interface to access its functionality [11].
Weka facilitates a variety of data mining tasks like data preprocessing, clustering, classification, regression, with an assumption that all data is available as a single file or relation where each data should contain a fixed number of attributes. However, Weka supports other types of attributes as well.
4.4. Technologies Used
Some other technologies we used for the system design and implementation are HTML, CSS, PHP, and Laravel framework, etc.
4.4.1 HTML and CSS
HTML (Hypertext Markup Language) is a type of language used to develop web pages and applications to access over the Internet. It allows us to include objects and images to form interactive documents using several structural semantics.
CSS (Cascading Style Sheets) is used to enable the separation between the HTML or other makeup language contents and its presentation. It used to ameliorate the accessibility of the contents, improving the flexibility and control the contents’ specification and presentation characteristics. CSS also facilitates multiple pages to share the formatting to scale down the redundancy [12].
4.4.2 PHP and the Laravel Framework
PHP (Hypertext Preprocessor) is a server-side scripting language that can embed with HTML code. It is an open-source language widely used for web development [12].
Laravel is one of the popular PHP frameworks generally used to build small to big size web applications. It follows the MVC (Model View Controller) structure which gets in easy to learn and rapid development of web application prototypes. It provides many built-in features like routing, mail, sessions, and authentication, etc.
4.5. Design of the Prediction System
The system comprises a knowledge basis that has compiled experience and a set of rules for utilizing the knowledge base for each case. It is the knowledge-based system where knowledge extracted in the form of IF-THEN rules from the decision tree that uses different attributes, including the semester examination records denoted by TGPA. Through the user interface, the system provides advice and instructions to the user to improve the students’ performance. The prediction system architecture [7] given in Figure 1.
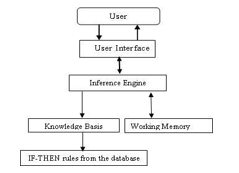
Figure 1: System flowchart of the prediction system
Knowledge Base: It’s the knowledge domain in the form of IF-THEN rules that will be returned from the WEKA tools.
Working Memory: The user enters the required information into the working memory. The prediction system compares this information with the knowledge carried in the knowledge base to deduce the new facts. The matching procedure continues by inserting these new facts into memory. Finally, the system reached some completion and enters into the working process.
Inference Engine: The inference engine interacts with the information in the knowledge base and the working memory. It tried to find out the rules to make a match between its premises and the information there have in the working memory. After finding a match, it reached a decision in memory and looks for a new match.
End-User: End users are those individuals who intend to consult with the system to learn their predicted outcome and to get advice from the system that they could follow to improve their performance.
5. Implementation and Result
This section describes the detailed process of the J48 decision tree algorithm in machine learning software WEKA for the implementation of university students’ result analysis and prediction system.
5.1. Selected WEKA Algorithm
In a decision tree algorithm, one of the main complications is the optimal size of the final tree. All theoreticians and specialists are still now searching for techniques to make this algorithm more accurate, cost-effective, and efficient. A tree if it is too big, then there is a risk to overfit the training data and poor generalization to a new sample. If a tree is too small, then it might not get significant structural data about the sample space. Sometimes, an error could drastically reduce after adding one more extra node. This phenomenon named the horizon effect. A common technique is to use tree pruning. Here, the concept is to eliminate the nodes that do not have any additional information. It reduced the overfitting and can remove a section of a classifier that may base on noisy or erroneous data to reduce the classifier complexity and improve the prediction accuracy. Tree pruning could do using the following approaches.
- Pre-pruning
- Post-pruning
In the pre-pruning approach, the tree construction halts early by deciding not to partition the instance in a node that then becomes a leaf. In the pre-pruning approach, the choice of threshold to halt the tree construction is very crucial because a low threshold could result in slight simplification and a high threshold could result in oversimplification [13].
On the contrary, post-pruning is a popular and reliable tree pruning technique that eliminates subtree from a fully developed tree. In this case, the removed branches replace with a leaf marked with the most regular class among the subtrees that have to replace [14]. However, this approach requires more computation than the pre-pruning approach.
In our decision tree algorithm, we use the J48 algorithm to classify our instances.
About J48 Pruned Tree:
J48 algorithm follows the divide and conquers strategy to create a small decision tree. It is a prolongation of the ID3 algorithm. In the J48 algorithm, each node of the tree effectively selects the best attribute of the data that can divide its samples into subsets prolonged in one class or the others. The dividing measure is the normalized information gain (variety in entropy). The decision takes based on the attribute with the highest normalized information gain. Eventually, the J48 algorithm recurs on the smaller sub-lists.
- Construction
The following steps have to follow to construct the tree:
- Make sure whether every case fits in the same class.
- Then, calculate the information and information gain for each attribute.
- Finally, have to discover the best splitting attribute (based on the present selection principle) [15].
- Calculating Information Gain
Shannon’s theory is at the base of the J48 algorithm. Shannon entropy is the best known and most popular technique applied to calculate the information gain. It could define in this way, the measure of information supplied by a consequence, the higher the chance of happening the occurrence is low (it is rare), the more information it supplies [16]. In the following, all logarithms are base 2.
Shannon Entropy
For a sample S, if the given probability distribution P = (p1, p2,…,pn), then the Information carried by this distribution, also called the entropy of P is given by:
Entropy(p)
The information gain G (p,T)
The information gain function allows us to assess the degree of mixing of classes for all samples to measure the attributes position during tree construction. It allows defining a function to choose the test that must label the current node. For a test T and a position p, the gain equation is as follows:
Gain(p,T) = Entropie(p)
Where, the value of (pj) is the set of all possible values for attribute T. To rank the attributes, this measure is necessary and hence to build the decision tree. In this process, the attributes with the highest information gain placed top positions in the path from the root of the tree [17].
Based on the highest information gain, splitting should do to form a small and efficient tree. Suppose, there are 11 male(m) and 7 female(f) in a class instance. Based on their calculated entropy and information gain, it could be divided further into two different groups of instances. So 4m and 5f as left instance and 7m and 2f as the right instance. After inserting the values to calculate the entropy and information gain, the formula will be as follows [18]:
Entropy_before =-7/18*log(7/18)-11/18*log(11/18)
Entropy_left =-4/9*log(4/9)-5/9*log(5/9)
Entropy_right=-7/9*log(7/9)-2/9*log(2/9)
Entropy_after = 9/18 ∗Entropy_left + 9/18 * Entropy_right
Information Gain= Entropy_before– Entropy_after
In the case of our research, now we calculate entropy and information gain:
Imagine, the entropy of the full training set, S is:
Entropy(S) =
= Ppoor * log2(Ppoor) – Paverage* log2(Paverage) – PGood* log2(PGood)- PVery Good * log2(PVery Good) – PExcellent* log2(PExcellent).
Then, the information gain calculation for the first attribute is:
Information Gain(S, Gender) = Entropy(S) – Pmale, Gender * Entropy(Smale) –Pfemale, Gender * Entropy(Sfemale)
Now,the calculations of entropies are:
Entropy(Smale) =
= Ppoor, male * log2(Ppoor, male) – Paverage, male * log2(Paverage, male) – PGood, male * log2(PGood, male) – PVery Good , male * log2(PVery Good, male) – PExcellent,male* log2(PExcellent, male).
Entropy(Sfemale) =
= Ppoor, female * log2(Ppoor, female) – Paverage, female * log2(Paverage, female) – PGood, female * log2(PGood, female) – PVery Good , female * log2(PVery Good, female) – PExcellent, female* log2(PExcellent, female).
In this way, we can calculate information gain for all attributes (No. of tuition, Programming skills, CT mark, assignment mark, etc.).The attribute having the highest information gain is the root node of the decision tree. The process has been continuing for selecting the whole tree root node and prioritization of those attributes frequently.
5.2. Results from WEKA Analysis
In an academic session, generally, each student has to go through four years of study, and each year consists of 2 terms. The ‘Years’ and ‘Terms’ selected as the possible nodes of the tree in WEKA. Here in our research, we put a total of five class attributes, which are: Poor, Average, Good, Very Good, and Excellent. To build the model, we applied a variety of algorithms using WEKA explorer. The classification algorithms used for this work are REPTree, Hoeffding Tree, and J48 tree. The classify panel of WEKA offers to apply a variety of classification and regression algorithms to the resulting dataset to measure the accuracy of the resulting prediction model, and to look out the flawed predictions or the model itself.
At first, load the data file- NSTU.arff into WEKA. The file contains the information of students. We need to divide up the records, so some data instances can use to create the model, and some data can use to test the model to ensure that we didn’t overfit it. This is necessary to evaluate the generated models’ accuracy as there is no separate data to test the model. Then, we got the model as a decision tree.
In step by step, now we will depict the whole process of WEKA simulation software.
Preprocessed the data by converting CSV to ARFF format:
The raw data which contains CSV(comma-separated values) format on the excel sheet was selected and convert it to ARFF(.arff) format by the WEKA tool (Figure 2). The decision tree-based system model was then generated after the processing of the NSTU.arff file.
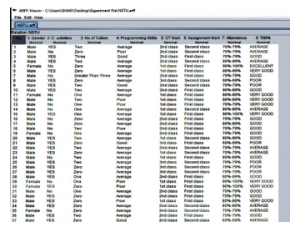
Figure 2: ARFF conversions by Weka tools
The preprocessed data was then used to train the system using the WEKA implementation tool (Figure 3).
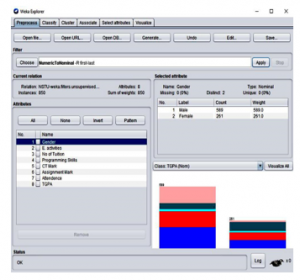
Figure 3: WEKA interface for the pre-processed data
Then the data is used to classify using WEKA implemented J48 algorithm. The visualization of the attributes presented in Figure 4.
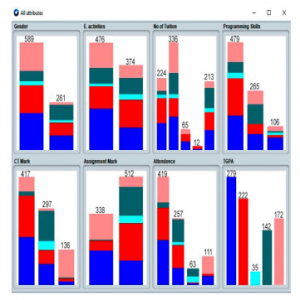
Figure 4: Attributes visualization
Figures 5 show the set of generated rules, and Figures 6 shows the corresponding result of the classifier using WEKA tools.
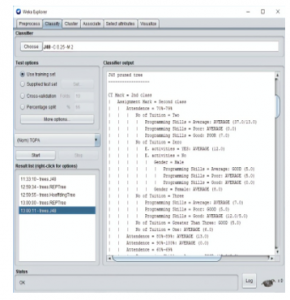
Figure 5: J48 rules generated using WEKA
There are 850 instances and 8 attributes. In the tree shown in Figure 7 has the number of leaves: 89, tree size: 130. Here, the percentage of correctly classified instances is 85.6471%, and the percentage of incorrectly classified instances is 14.3529%. The accuracy model ascertains that the proposed model could be a very good choice to predict student’s results and for further development.
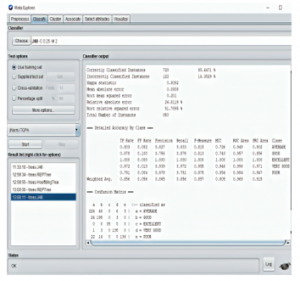
Figure 6: Result of the classifier
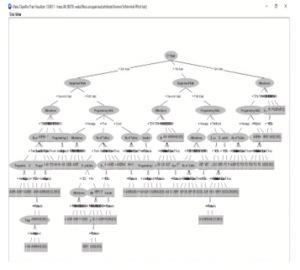
Figure 7: Decision tree produced using WEKA
5.3. Final Result Exploration
The decision tree knowledge was deduced as IF-THEN format rules and demonstrated in Figure 8.
In this way, we got 89 possible IF-THEN rules. Then we use these IF-THEN rules on the backend program for system development.
5.4. Login Page
It is the initial page that the user can see through which a user can get access to the proposed web-based student result analysis and prediction system. Use must put their credentials (username, password) to get access (Figure 9).
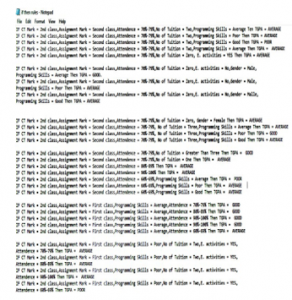
Figure 8: Rule set generated by J48
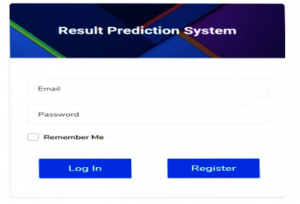
Figure 9: Login page
5.5. Sample Output for the System
The system asks the user questions related to their CT marks, assignment mark, and other related questionnaires of the previous semester, which results have not yet published. Then based on the user response, the system can predict those semester results for the user and give a suggestion that provides the reason behind the corresponding results. The system also able to categories the students’ results. This also enables the system to classify the categories (Excellent, Very good, Good, Average, Poor) of student’s records in their academic period. A sample output of the proposed prediction system demonstrated in Figure 10.
5.5.1 Class-wise Accuracy and Accuracy model for Class Prediction
For different outcome categories, the true positive, false positive, and correct precision results presented in Table 2.
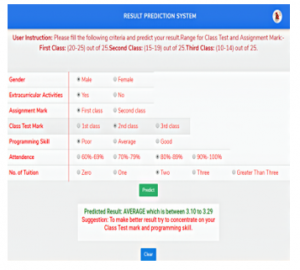
Figure 10: Sample output for the prediction system
Table 2: Class-wise accuracy for five class prediction
| TGPA CLASS | True Positive (TP) | False Positive (FP) | Correct Precision (%) |
| EXCELLENT | 1.000 | 0.000 | 100% |
| VERY GOOD | 0.972 | 0.013 | 97.2% |
| GOOD | 0.878 | 0.100 | 87.8% |
| AVERAGE | 0.803 | 0.082 | 80.3% |
| POOR | 0.791 | 0.004 | 79.1% |
We found the accuracy percentage of the J48 decision tree algorithm is about 85.6471% for the dataset used in this study (Table 1) and shows in Table 3.
Table 3: Accuracy percentages
| Algorithm | Correctly Classified Instances(CCI) | Incorrectly Classified Instances(ICI) |
| J48 | 85.6471% | 14.3529% |
5.5.2 Comparison of the performance metric for other classification models
Table 4 shows the accuracy comparison of J48, REPTree, and Hoeffding tree algorithms for the dataset used in this study (Table 1) observed as follows:
Table 4: Comparison of other classification models
| Algorithm | Correctly Classified Instances(CCI) | Incorrectly Classified Instances(ICI) |
| J48 | 85.6471% | 14.3529% |
| REPTree | 82.2353% | 17.7647% |
| Hoeffding Tree | 65.1765% | 34.8235% |
So from the comparison, we see that J48 is the best classifier for the data set.
6. Conclusion and Future Work
As a countries development mostly relies on the educational outcome of the students, especially on the performance of university graduates, the performance improvement of the students is highly desirable. The proposed system can predict the students’ results and will help them for their performance improvement by knowing their lacking and following the pieces of advice from the system based on their current conditions. Moreover, the proposed system would help the students to cut down the overall failure rate as they can now be well directed and advised. The experimental results show that the true positive rate for getting the POOR, AVERAGE, GOOD, VERY GOOD, EXCELLENT class is 79.1%, 80.3%, 87.8%, 97.2%, and 100% respectively, and J48 is the best algorithm for classification for the dataset used in this study that achieved 85.6471% accuracy. In conclusion, we hope that university students will hugely benefit from using the system for their performance improvement.
The future work would comprise utilizing the proposed system on an extended data set with more attributes (e.g. student financial condition, No of backlog, etc.) to get more accurate results. We also aim to prolong the work with more experiments using other techniques like neural network and clustering, etc.
- A. S. Olaniyi, S. Y. Kayode, H. M. Abiola, S. I. T. Tosin, A. N. Babutunde, “Student’s Performance Analysis Using Decision Tree Algorithm” Annals. Computer Science Series, 15(1), 55-62, 2017.
- M. F. Sikder, M. J. Uddin, S. Halder, “Predicting Students Yearly Performance using Neural Network: A Case Study of BSMRSTU” 5th International Conference on Informatics, Electronics and Vision (ICIEV), 524-529, 2016. https:// doi: 10.1109/iciev.2016.7760058
- B. K. Baradwaj, S. Pal, “Mining Educational Data to Analyze Students Performance” International Journal of Advanced Computer Science and Applications, 2(6), 2011. https://doi.org/doi:10.14569/IJACSA.2011.020609
- S. K. Yadav, S. Pal, “Data Mining Application in Enrolment Management: A Case Study” International Journal of Computer Application (IJCA), 41(5), 1-6, 2012. https:// doi: 10.5120/5534-7581
- C. Romero, S. Ventura, P. G. Espejo, C. Hervás, “Data Mining Algorithms to Classify Students” In EDM, 8-17, 2008.
- L. A. Whitley, “Educational data mining and its uses to predict the most prosperous learning environment” M.Sc. Thesis, East Carolina University in USA, 2018.
- A. O. Ogunde, D. A. Ajibade, “A Data Mining System for Predicting University Students’ Graduation Grades Using ID3 Decision Tree Algorithm” Journal of Computer Science and Information Technology, 2(1), 21-46, 2014.
- N. A. Gorikhan, “A study on Implementation of classification techniques to predict students’ results for Institutional Analysis” MSc Thesis, Faculty of Engineering & IT, The British University in Dubai, 2016.
- B. K. Bhardwaj, S. Pal, “Data Mining: A prediction for performance improvement using classification” International Journal of Computer Science and Information Security (IJCSIS), 9(4), 136-140, 2011.
- R. S. J. D Baker, K. Yacef, “The State of Educational Data Mining in 2009: A Review and Future Visions” Journal of Educational Data Mining, 1(1), 2009. https://doi.org/10.5281/zenodo.3554657
- M. Hall, E. Frank, G. Holmes, B. P. P. Reutemann, I. H. Witten, “The WEKA Data Mining Software: An Update” SIGKDD Explorations, 11(1), 10-18, 2009. https://doi.org/doi:10.1145/1656274.1656278
- K. Adhatrao, A. Gaykar, A. Dhawan, R. Jha, V. Honrao, “Predicting Student’s Performance Using ID3 and C4.5 Classifications Algorithms” International Journal of Data Mining & Knowledge Management Process (IJDKP), 3(5), 39-52, 2013. https://doi.org/doi: 10.5121/ijdkp.2013.3504
- B. Abdullah, I. Abd-Alghafar, G. I. Salama, A. Abd-Alhafez, “Performance evaluation of a genetic algorithm based approach to network intrusion detection system” in 13th international conference on aerospace sciences and aviation technology, Military Technical College, Kobry Elkobbah, Cairo, Egypt, 2009, 1-17. https:// doi: 10.21608/asat.2009.23490
- K. M. Osei-Bryson, “Post-pruning in decision tree induction using multiple performance measures” Computers & operations research, 34(11), 3331-3345, 2007. https:// doi: 10.1016/j.cor.2005.12.009
- W. Y. Loh, “Classification and Regression Tree Methods” Encyclopedia of Statistics in Quality and Reliability, 315-323, 2008. https://doi.org/doi: 10.1002/9780470061572.eqr492
- B. Devéze, M. Fouquin, “Data Mining C4.5 DBSCAN, Promotion” SCIA Ecole pour l informatiqueet techniques avancées, 2005.
- B. Hssina, A. Merbouha, H. Ezzikouri, M. Erritali, “A comparative study of decision tree ID3 and C4.5” International Journal of Advanced Computer Science and Applications, 4(2), 13-19, 2014. https://doi.org/doi:10.14569/SpecialIssue.2014.040203
- D. N. Bhargava, G. Sharma, D. R. Bhargava, M. Mathuria, “Decision Tree Analysis on J48 Algorithm for Data Mining” International Journal of Advanced Research in computer Science and Software Engineering, 3(6), 1114-1119, 2013.